while WE slept: 'contained' start for USTs; 2yy 'More signs of trend exhaustion' (CitiFX); 2025 dart-throwing contest continues (#2025 -Wells and #BeachBoys)
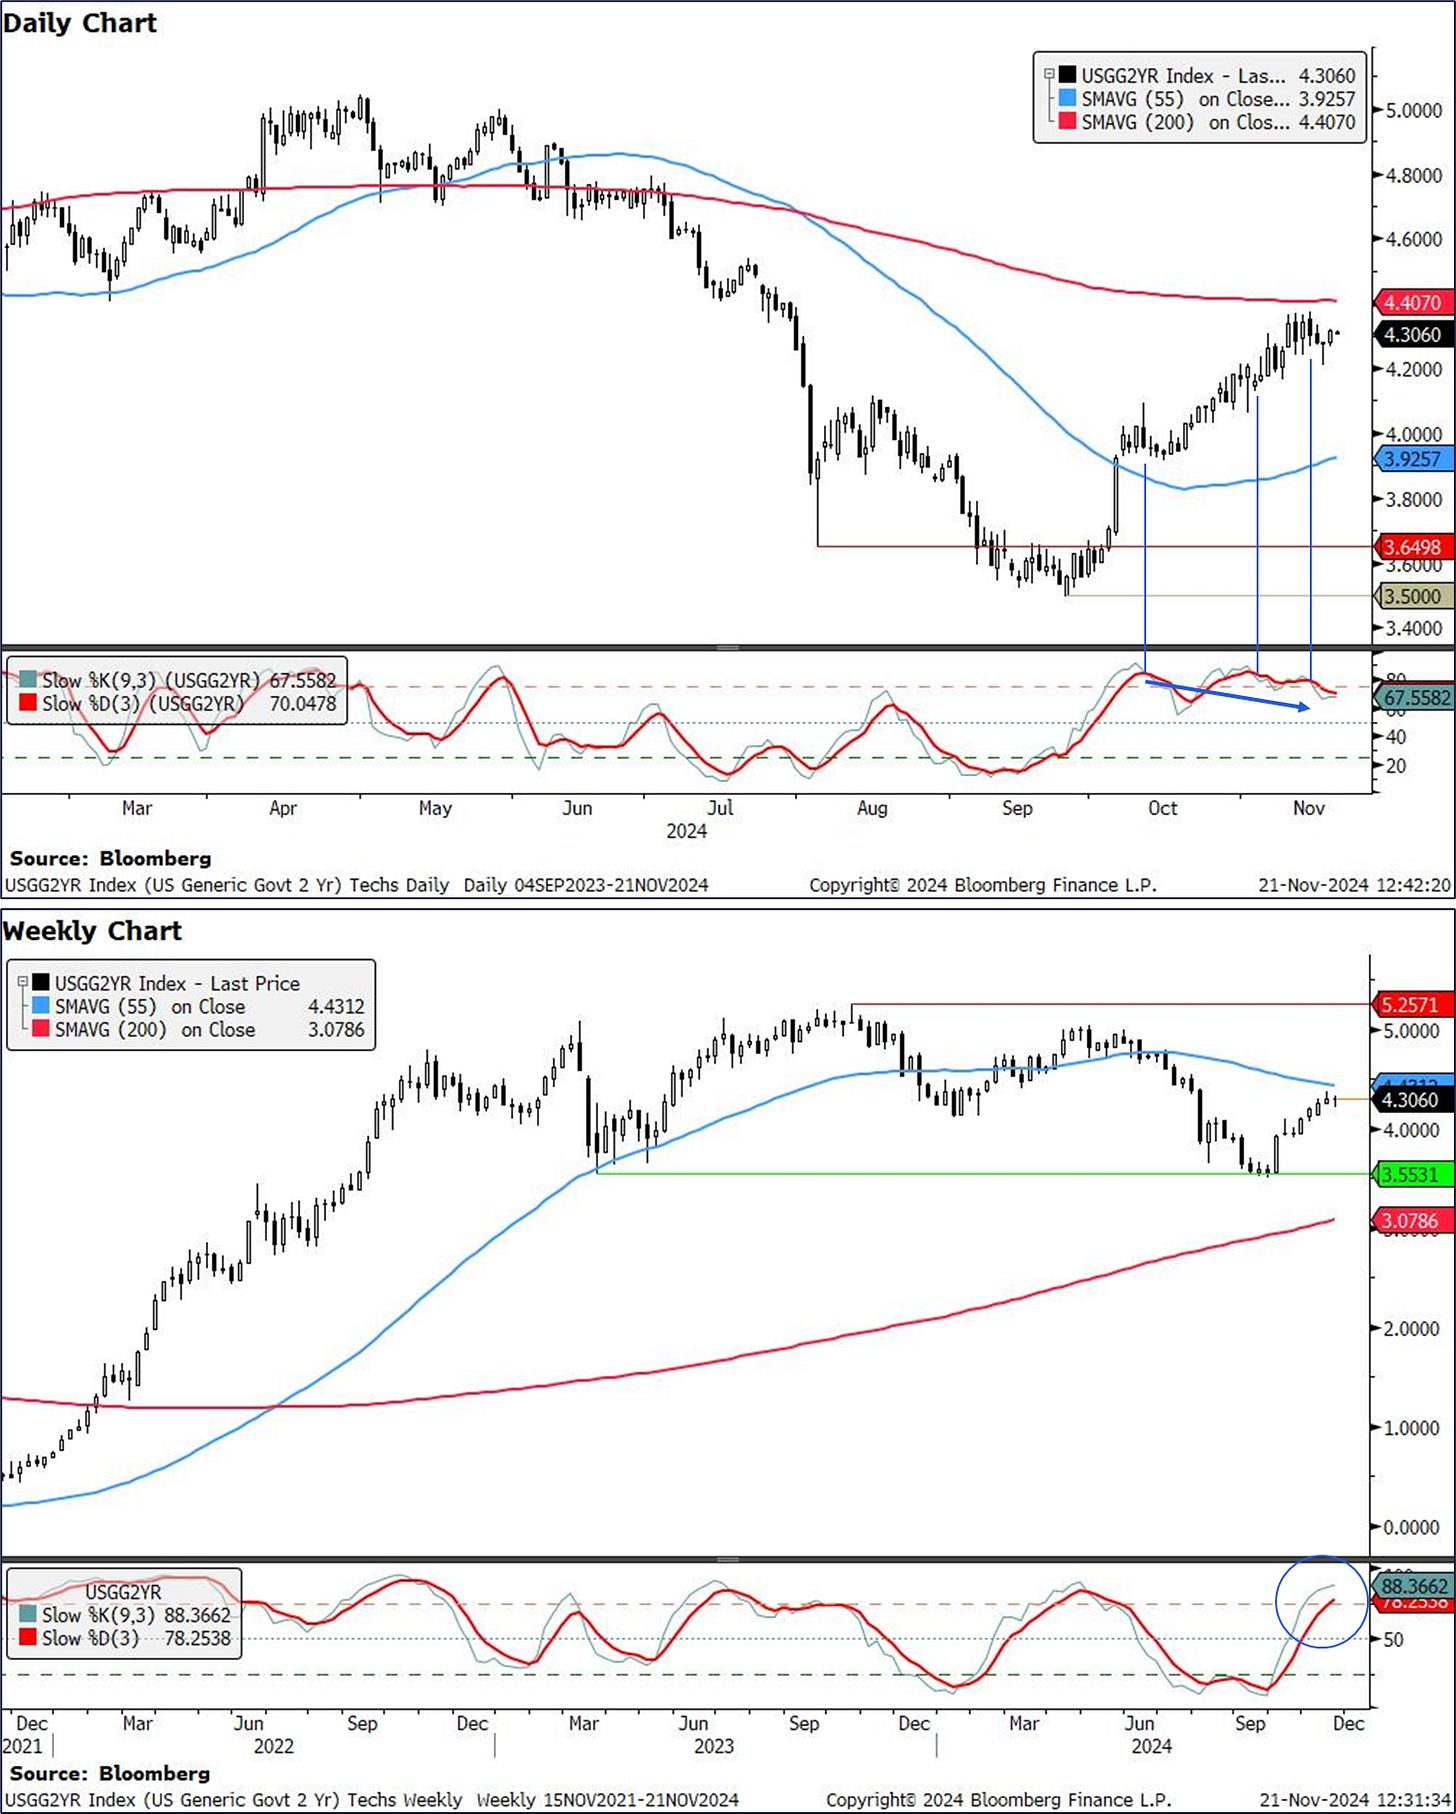
Good morning … I don’t normally begin with another’s visual of rates but today’s inbox had a couple / few from one of the best tech-A-mentalists out there (CitiFX note below) but a look at WEEKLY chart for further signs of the uptrend exhaustion …
… US 30y yields
Yields have again tested resistance at 4.65% (July high), for the third week in a row. IF we close higher on a weekly basis, it would suggest further upside towards the 76.4% Fibonacci level of 4.88%.However, with weekly slow stochastics on the verge of crossing lower from overbought territory, as well as the strength of resistance, we think the bias is for yields to move lower. 4.38-4.40% is the first level of support (55w MA, 200d MA).
… scroll for link to entire note AND a look at front-end. Point IS that the uptrend, best they reckon, is nearing inflection point.
You’ll have found similar visuals and thought process HERE over the weekend just past … another fine example of that old adage whereby ‘great minds think alike OR fools never differ’?
… Moving on and now we know of the NVDA earnings …
ZH: Nvidia Drops After Revenue Forecast Disappoints Exuberant Expectations
… markets suggesting an underwhelming report giving it the proverbial 1-handed clap. And the days data dust settled …
ZH: Missiles, Michelle, & Missed Targets Spark Stock Dump'n'Pump; Bitcoin & Gold Jump
… Then, on the Macro side, round 12ET, Fed Governor Michelle Bowman poured some hawkish water on the dovish hopes:
“We have seen considerable progress in lowering inflation since early 2023, but progress seems to have stalled in recent months,” 'Miki' noted.
“I would prefer to proceed cautiously in bringing the policy rate down to better assess how far we are from the end point,” because progress in reducing inflation has slowed.
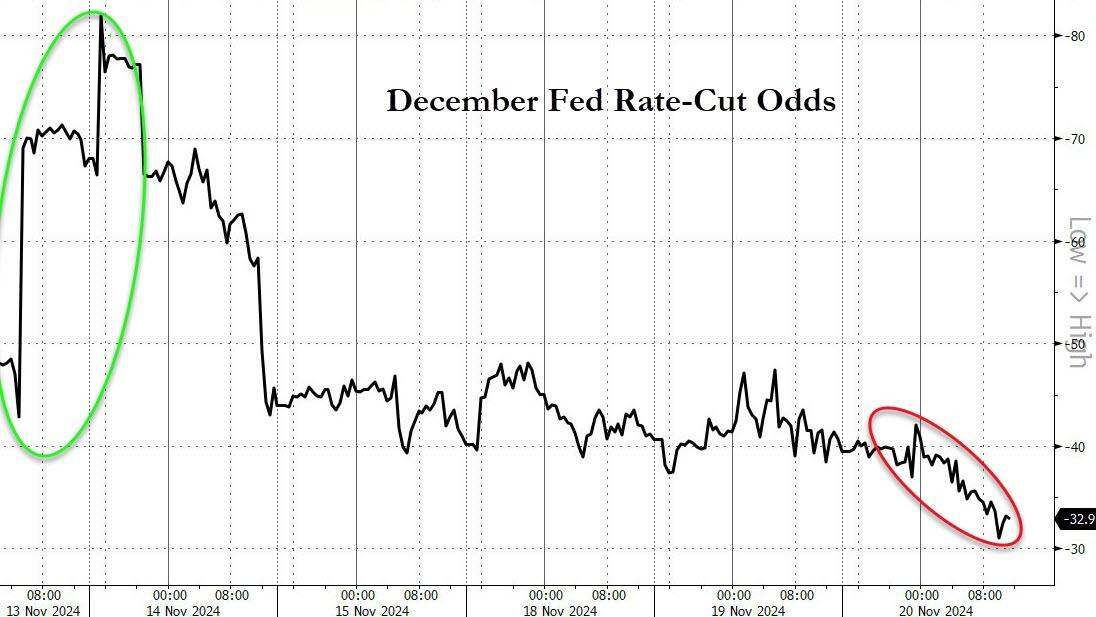
That sent December rate-cut odds significantly lower (33% now)...
… before we learned of these NVDA results we heard from the FOMC dissenting Michelle Bowman (ie Michelle referred to by ZH just above) …
Bloomberg: Fed’s Bowman Urges Cautious Approach to Further Rate Cuts
Bowman dissented from Fed’s 50-basis-point cut in September
She sees risk rates dip below neutral before price goal is met
…. “I would prefer to proceed cautiously in bringing the policy rate down to better assess how far we are from the end point, while recognizing that we have not yet achieved our inflation goal and closely watching the evolution of the labor market,” Bowman said in remarks to the Forum Club of the Palm Beaches in West Palm Beach Florida Wednesday …
… this Bloomberg story lifts an excerpt from p10 of the speech (which is 11 of the PDF) and this speech delivered ahead of the 20yr auction, setting the tone …
ZH: Terrible 20Y Auction Has 2nd Biggest Tail, Lowest Directs On Record; Spikes Yields
… here is a snapshot OF USTs as of 646a:
… and for some MORE of the news you might be able to use…
IGMs Press Picks: November 21 st 2024
NEWSQUAWK: US Market Open: NVDA -2% as revenue growth slows, havens lifted by tensions between Russia and Ukraine…Bonds are benefiting from the geopolitical risk-premia into numerous central bank speakers…A contained start for USTs with fresh drivers somewhat light after the 20yr auction on Wednesday (which was weak) and as we await the latest weekly jobs data before the latest wave of Fed speakers. USTs have remained in a narrow 109-20+ to 109-25+ parameters; the high of which printed most recently as Russia described Ukraine’s use of storm shadow missiles as a “new escalation”.
PiQ Overnight News Roundup: Nov 21, 2024
Opening Bell Daily: NVDA beats, then falls. Nvidia shareholders are so spoiled that they felt let down by a $35 billion quarter … Another record-breaking earnings report failed to satisfy Wall Street.
Reuters Morning Bid: Nvidia sees past triple-digit growth
Finviz (for everything else I might have overlooked …)
Moving from some of the news to some of THE VIEWS you might be able to use… here’s SOME of what Global Wall St is sayin’ …
Jobs on the brain …
BARCAP: QCEW: More than meets the eye
Initial job gain estimates for Q2 2024 from the QCEW were aligned with published estimates from the payroll survey. At face value, this suggests that overcounts from the prior benchmark period have not persisted. It would be premature to dismiss the risk that job gains are overstated, just yet.
…The revised QCEW estimates for Q1 24 are scheduled for release on December 5, 2024. This March 2024 estimate would be used by the BLS to finalize the magnitude of the upcoming benchmark revision. Given the systematic tendency of initial QCEW job estimates to revise upward in recent years, we think that the benchmark revision will point to a downward revision of about 500k, a fair bit smaller than the preliminary estimate of -818k.
…The problem with benign interpretation is that the aforementioned pattern in 2023-24 is the historical norm: The payroll survey systematically understates job gains in Q2, then overstates them over the remainder of the benchmark period. This historical tendency is shown in Figures 3-6, which compare the job gains from the two surveys in each of the four quarters of the benchmark period — which runs from Q2 through Q1 of the following year. As shown in Figure 3, using available estimates beginning in 1979, the payroll survey has systematically understated job gains during Q2, relative to the QCEW, by an average of about 480k. This bias is typically corrected in Q1 of the following year, which shows an average overcount of nearly the same magnitude (440k, Figure 4). Discrepancies in estimated job gains during the remaining two quarters, Q3 (Figure 5) and Q4 (Figure 6) tend to be more volatile, but show little evidence of systematic bias, especially in more recent decades.
… some yields input from THE preeminent tech-A-mentalists out there …
CitiFX: US yields: More signs of trend exhaustion
US 2y yields are showing more signs of trend exhaustion, suggesting that any move higher in yields could be very limited. We are also holding below strong levels. We also discuss US 10y yields and 30y yields in this update.
US 2y yields
Last week we noted that there was still the potential for higher yields. However, upside is looking increasingly limited, with very strong resistance at 4.41-4.44% (200d MA, 55w MA).The current picture remains one of limited upside. Weekly slow stochastics for us 2y yields is inching closer to crossing lower from 'overbought' territory. Meanwhile, daily slow stochastics has posted triple momentum divergence, one of our favourite trend exhaustion indicators.
As a result, we are on the lookout for any more reversal indicators that would suggest lower yields. We see support first at 3.93% (55d MA).
… fan fav recapping of NVDA results (and a couple / few words ‘bout bonds) …
DB: Early Morning Reid
… Nvidia’s results overnight drew a tepid reaction despite a solid Q3 beat by the world’s most valuable company as its guidance failed to match some of the loftiest expectations. Q3 sales came in at $35.1bn (vs $33.2bn est.) and the earnings surprise the strongest in three quarters. However, the Q4 sales guidance at $37.5bn, was “only” a touch above the average analyst estimate of $37.1bn. The company’s earnings call talked of “very strong” demand for its new Blackwell chips that will begin to ship this quarter, but overall it was deemed to be a slightly underwhelming outcome with Nvidia’s shares down -2.5% in post-market trading. Of course, this has be to put in perspective of the stock’s +195% rally YTD …
… The earlier negative market driver was fears of an escalation in the Russia-Ukraine conflict. Indeed, yesterday it was widely reported that Ukraine had used British Storm Shadow missiles against military targets in Russia, which comes after their use of US missiles on Tuesday. The geopolitical risk-off tone saw gold (+0.70%) post a third consecutive increase, while the dollar index rose +0.41%. Another related market theme was a notable rise in near-term inflation expectations, with the US 2yr inflation swap up +5.1bps to 2.72%. That’s its highest level since March 2023, right before SVB’s collapse, and it shows how investors have adjusted their expectations relative to early September, when it fell beneath 2%.
With inflation expectations moving higher, markets continued to pair back near-term Fed rate cut expectations, with the market odds of a December rate cut falling to 52% from 59% the previous day. The 13bps of easing now priced for the December meeting is the lowest that it’s been since April. This came as Fed officials continued to strike a patient tone. Fed Governor Bowman said she “would prefer to proceed cautiously” with further easing and Boston Fed’s Collins said that while “some additional policy easing is needed”, the cuts delivered so far “enable the FOMC to be careful and deliberate going forward”.
Global bonds mostly sold off yesterday, with the 2yr Treasury yield up +3.5bps to 4.32%, whilst the 10yr yield was +1.5bps higher at 4.41%. The Treasury sell-off was reinforced by a weak 20yr auction that saw bonds issued 3bps above the pre-sale yield. European yields also saw similar moves, with those on 10yr bunds (+1.3bps), OATs (+2.9bps) and BTPs (+2.8bps) all rising. Meanwhile in the UK, 10yr gilts (+2.7bps) sold off after the latest CPI print was above expectations in October. For example, headline CPI rose to a six-month high of +2.3% (vs. +2.2% expected), whilst core CPI was up to +3.3% (vs. +3.1% expected). So that led investors to dial back their expectations for rate cuts from the BoE, with the likelihood of another cut by February down to 78% now …
… and finally, inbox on the light side and today’s 2025 darts thrown by those in the covered wagons …
Wells Fargo: 2025 Annual Outlook
A New Horizon: The Economic Outlook in a New Leadership and Policy EraSummary
The economic aftershocks of the COVID pandemic, which have dominated the economic landscape over the past few years, are steadily dissipating. These pandemic-induced economic effects are set to be largely supplanted by economic policy changes that are on the horizon in the United States.
The American president can act largely unilaterally when it comes to changes in trade policy. During his campaign for the presidency, Donald Trump promised to impose a 10% across-the-board tariff on U.S. trading partners with 60% levied on China. Although the magnitude and timing of any actual tariff hikes are uncertain, we expect the Trump administration will indeed impose some levies on American trading partners. By raising consumer prices, tariffs impart a modest stagflationary shock to an economy.
We have bumped up our forecast of inflation for next year, while shaving down our real GDP growth forecast. We still expect the Federal Reserve to ease monetary policy further, but we believe the target range for the federal funds rate will be 50 bps higher at the end of 2025 than we did previously.
Republicans will control both chambers of Congress beginning in the new year. We expect Congress to fully extend the tax cuts that were legislated in the 2017 Tax Cuts and Jobs Act, which are set to expire at the end of 2025. But extension of the tax cuts does not impart fiscal stimulus to the economy, because extension would simply prevent tax rates from reverting to their higher pre-2017 levels. That noted, we expect Congress to legislate some additional tax relief next year, which should help to boost real GDP growth in 2026.
Not only will tariffs weigh on U.S. real GDP growth next year, but economies with significant export exposure to the United States likely will be negatively affected as well. Under our tariff assumptions, we forecast the global economy will grow only 2.5% in 2025, down from 3% in 2024.
We look for a significant amount of monetary easing next year by many major foreign central banks, including the European Central Bank, the Bank of England and the Bank of Canada. As interest rate differentials move in favor of the greenback, we look for the trade-weighted value of the U.S. dollar to rise to its highest level in more than 20 years in the coming quarters.
…Expect Status Quo on Budget Deficits, Treasury Yields
…Against this economic, monetary and fiscal backdrop, we expect Treasury yields to recede over the course of next year, but we think any decline will be modest. We forecast the 10-year Treasury yield will end 2025 at 4.00%, which is down a bit from its current spot rate of 4.45%. As we went to print, markets were priced for roughly 75 bps of additional rate cuts from the FOMC over the next year, about 25 bps less than our forecast. Thus, even though we expect the FOMC to keep cutting rates, much of this easing is already reflected in Treasury yield pricing. The deceleration in real GDP we expect to see in 2025 argues for lower yields next year. However, our projection that the decline in inflation will stall out and our expectation that tax cuts are coming in 2026 should limit the decline in intermediate and longer-term yields. Similarly, since we do not expect a major increase or decrease in the federal budget deficit over the next year or two, we believe this also argues for longer-term Treasury yields remaining near where they are today. Of course, given the significant uncertainty in the outlook, there likely will be considerable volatility over the next year, even if yields are not too materially different in one year's time.
…And from Global Wall Street inbox TO the WWW …
First, from The Terminal dot com, a view with couple US jobs related charts …
Bloomberg: Stuck in the muddle with UK stocks and inflation
Price rises will stay a worry as long as people talk about them, but Britain’s bigger concern should be the stagnant stock market.…Charts That Make You Go Hmmmm...
It’s difficult to know how much to trust employment data in the wake of the pandemic. The overall jobless numbers in the US have so far thwarted predictions of an imminent recession. With Donald Trump taking office with an agenda virtually certain to spark fresh growth in the short term, it’s reasonable to worry more about overheating than any slowdown.But there are two charts of the US jobs market that make me go hmmmm. First, the Atlanta Fed’s wage tracker series measures wage rises for those who switch jobs and those who stay. Wage rises are usually bigger for switchers, as this is generally the reason they decide to move in the first place. Stayers get higher raises, as a rule, only when the economy is really tough and the switchers are moving because they have to.
The “switcher’s premium” hit an all-time high in 2022 as the Great Resignation put negotiating power emphatically in the hands of employees. That’s declined; it’s now lower than the norm for the last quarter-century, and earlier this year even went negative:
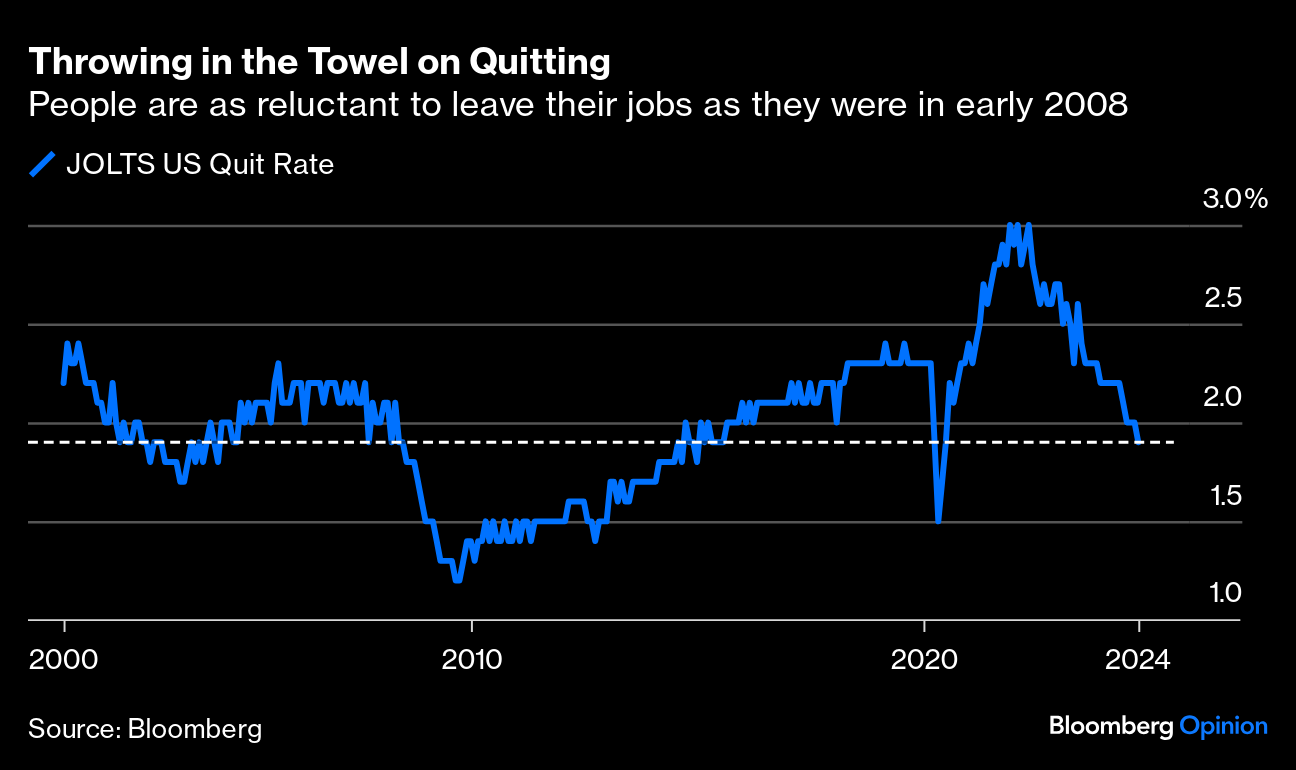
For another disquieting sign, the JOLTS (Jobs and Labor Turnover Survey) shows that the rate of quitting, which peaked at a remarkable level following the pandemic, is now back below its norm. The quit rate is where it was in early 2008, when the economy was beginning to weaken alarmingly. This looks like further evidence that workers are finding that the labor market is turning against them:
As Peter Tchir of Academy Securities says, “My take on the quit rate is that it is ‘crowd-sourced’ data. Every individual has a pretty good idea about their own job prospects, and that gets reflected in the quit rate.” There are problems with low response rates and other distortions post-Covid, but this seems a wise assessment. Amid much anxiety about continuing inflation, reflected in spades by the result of the US election, it looks like workers are inhabiting a world where finding a job is getting difficult.
This doesn’t mean that it’s safe to ignore inflation, because it isn’t. The pendulum has swung against major rate cuts for good reason. But it’s important to question assumptions, and these charts certainly raise questions …
… beachboys sing a tune ‘bout 2025 (think rules and cuts) …
Macro Signposts | Fed 2025 Outlook: Hikes Still Unlikely
… One useful benchmark is comparing rates today with a range of monetary policy rules and prescriptions for the appropriate level of rates. In past discussions, we’ve used a set of rules that were first introduced by James Bullard when he was president of the St. Louis Fed and that built upon the well-known Taylor rule for Fed policy developed by John Taylor (see Bullard’s 2023 paper: “Is Monetary Policy Sufficiently Restrictive?”).
The peak policy rate range prescribed by Bullard’s rules was between 5% to 7% when he wrote the paper, versus the actual peak this cycle of a range of 5.25% to 5.5%. However, now his rules suggest that actual monetary policy should be between 100 basis points (bps) to 200 bps below the current midpoint (about 4.6%) of the fed funds rate range. If we adjust upward Bullard’s −0.5% to 0.5% assumed range for the real neutral interest rate to be more in line with the Fed’s current long-run real policy rate projection of 0.5% to 1%, these rules still prescribe a level for the fed funds rate that is 50 bps to 150 bps below where it is today.Figure 1: Realized target fed funds rate (upper bound) vs. Taylor-type rules
Putting it more bluntly, these monetary policy rules suggest there is room for the Fed to cut rates further – even under a range of scenarios for the unemployment rate and inflation.
…Bottom line
Under a range of employment and inflation scenarios (and potential policy outcomes), the Fed has some room to cut. While the most aggressive tariff scenarios would make the Fed’s job tricky, the combination of higher inflation, and potentially higher unemployment, would likely limit the Fed’s appetite to further restrict the economy through higher rates.
So while recent stronger U.S. economic data could have the Fed considering a pause in December and/or adjusting its projected policy rate path somewhat higher in 2025, we think the broader trend, and distribution of potential outcomes, is toward lower policy rates. Inflationary scenarios that could change the outlook for gradual cuts would likely need to be large global supply shocks that start to feed into inflation expectations, but even then, the negative growth and labor market effects could be an offset. On the other hand, if the U.S. economy performs worse than we expect and the labor market weakens, the Fed could cut more quickly in an effort to close the gap between current policy and the Taylor-based rules.
… more on 2025 from the sandbox …
Sandbox: Year-end outlooks? Forget about it.
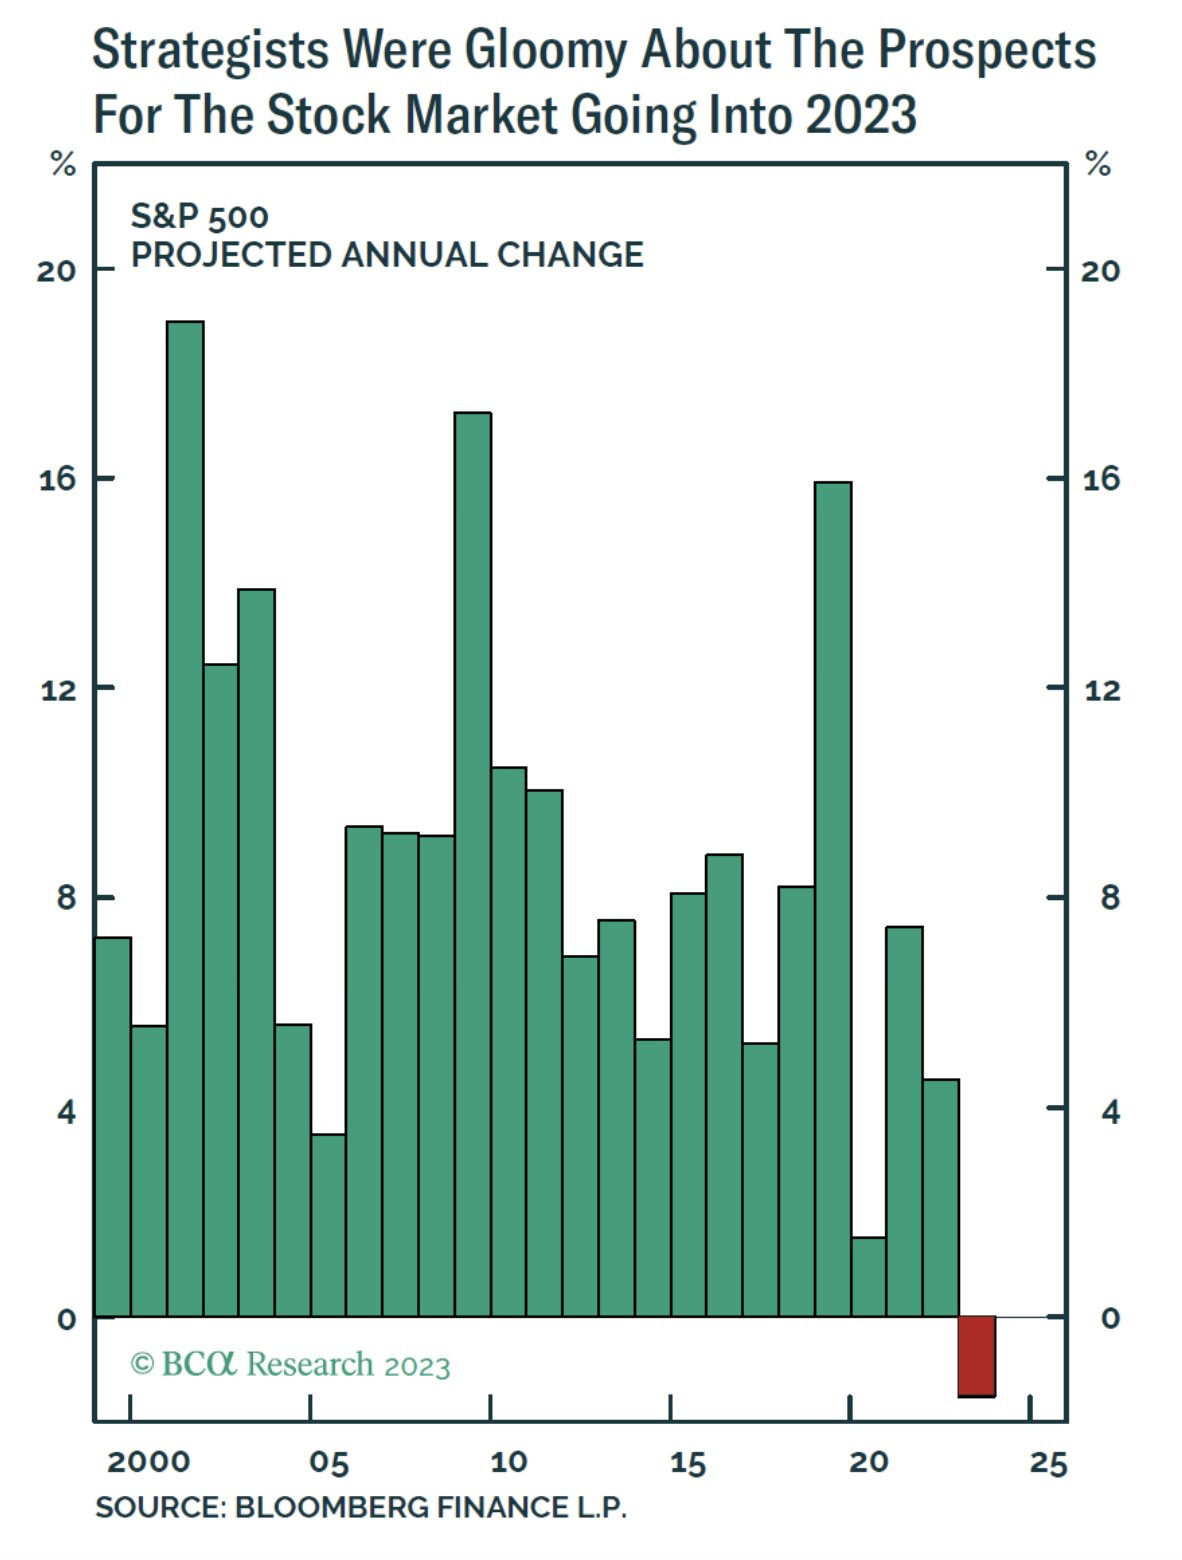
…Did you see how Wall Street came into 2023?
The consensus target called for an outright fall in the stock market in 2023, the first time this century they had predicted a loss.
It turned out to be one of the greatest years on record. The S&P 500 returned +26.29% in 2023.
Even at the midpoint of 2023, there was a ~50% difference between the most bullish year-end S&P 500 target (Fundstrat’s Tom Lee saw it rising nearly +10% higher to 4,825) and the most bearish call (Piper Sandler had stocks down some -27% to 3,225).
In hindsight, that was a difficult market to call with any level of conviction.
What about 2024? Surely they updated their models.
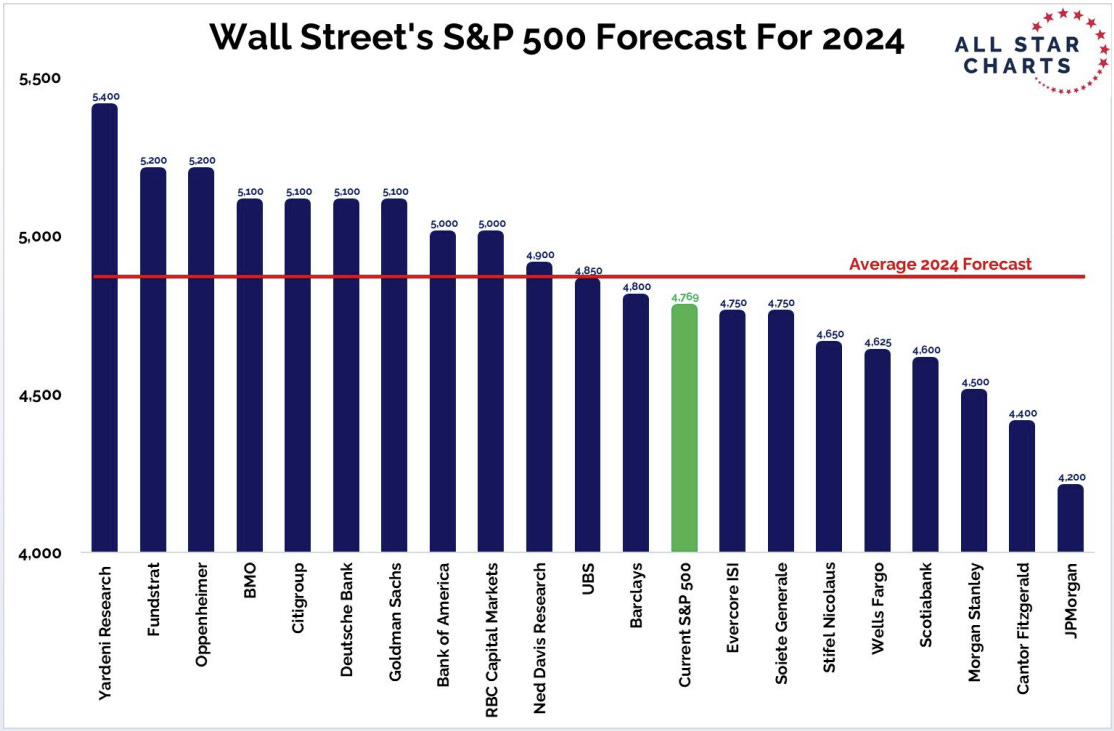
Wall Street consensus predicted a meager +2% upside move.
Ed Yardeni was at the top end with a 5400 year-end target (+13% upside), while the bears over at J.P. Morgan called for 4200 at the low end of the range (-12% downside).
Today, the S&P 500 closed at 5917 – higher than all of them.
… ‘bout that FINANCIAL yield curve …
SurplusProductivity: Will The 3mo/10yr Ever Turn Positive Again?
The Financial Yield Curve Has Been Operating Wider Than Trend But That's Not Saying MuchYesterday, the yield spread between the 3month Treasury Bill and the 10year Treasury Note closed the trading day at -23 basis points (4.67 percent versus 4.39 percent). This happens to be some 7 basis points more inverted than it was just a few days ago (November 13th) but also the 519th consecutive day of a negative spread. In fact, it was the close of trading on October 24th of 2022 that produced the last positive spread when the two maturities ended the day with the 3mo at 4.16 percent and the 10yr at 4.25 percent. The 3mo/10yr US Treasury yield curve is known in market circles as the financial yield curve or Fed curve as it is much more reactive to changes, perceived or otherwise, in monetary policy. Given its shorter maturities, especially compared to that of the 2yr/30yr or economic yield curve, it is relatively easy to understand why this particular Treasury yield curve spread is so sensitive to the Fed and the financial sector it uses to achieve its goals of stable prices and full employment. Yet the persistence of the inversion of this curve through some major policy transitions speaks to a much larger issue guiding the economy and the markets that mark it. In this case, the economy is falling much too much behind its current rate of long-term potential, leaving it to discover leverage outside of the capital markets and leaving financial sector increasingly out in the cold.
The Fed curve has been inverted for over two years, straight…
… THAT is all for now. Off to the day job…


