while we slept; buy dip? pensions bad year about to get worse? are we there yet? econ dashboards, financial conditions and canaries in the coal mine ...
Good morning … If ONLY we all had a penny for every time JPMs Marko K put out a BUY THE DIP call (this year, courtesy of ZH),
… for those curious for a quick walk down memory lane, here is an annotated history of the 2022 bear market overlaid with Marko's weekly recommendations to buy each and every dip.
Bonds been down so long they look UP ! One day in a row a rally makes? Long end BID but lagging the move yesterday, makes some amount of common sense (which ain’t so common) given duration supply in the days ahead. To say nothing of Biden’s inflation pep-talk to be followed by CPI.
… Losses across both stock and bond markets delivered a double blow to the funds that manage more than $4.5 trillion in retirement savings for America’s teachers, firefighters and other public workers. These retirement plans returned a median minus 4.01% in the first quarter, according to data from the Wilshire Trust Universe Comparison Service expected to be released Tuesday. Recent losses have further eroded their holdings.
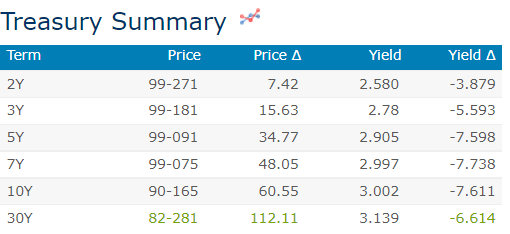
Inspirational, I know, right? Here is a snapshot OF USTs as of 731a:
… HEREis what another shop says be behind the price action, you know,
WHILE YOU SLEPT Treasuries are mixed with the belly of the curve outperforming this morning with the UK and German markets doing much the same (2s5s10s lower) too while those markets outperform overall. DXY is little changed while front WTI futures are lower again (-1.45%). Asian stocks saw a ~1% rise in Chinese shares but modest declines elsewhere, EU and UK share markets are all higher (SX5E +1.2%) while ES futures are showing +0.7% here at 7:10am. Our overnight US rates flows saw another series of TY blocks overnight- all looked like buys totaling ~10k) as SPX fell further below 4k then. We saw 2-way flows from fast$ in the front end but little else during Asian hours. In London's AM the desk reported much better buying with HF's also adding 2s7s and 2s10s flatteners. A block buy of 5146 TU's was also reported a few hours ago. Overnight Treasury volume was quite decent at ~170% of average overall.
… and for some MORE of the news you can use » IGMs Press Picks for today (10 May) to help weed thru the noise (some of which can be found over here at Finviz).
Ahead of today’s soothing words from Biden on the ‘flation and ahead of this afternoons liquidity event (aka 3yr auction), and then tomorrows CPI, here are a couple things from the inbox to note.
First, a rather large German institution asked / answered
Is the rates sell-off over? It is getting tricky, but most likely, not.
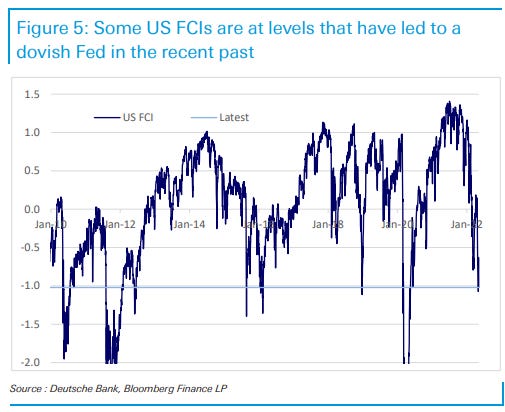
Global growth is slowing on the back of the expected monetary policy tightening, the Ukraine war, the China lockdown and a negative fiscal impulse in the US. Financial conditions have tightened to levels that have led to a dovish shift from the Fed in the past. The UST10y yield has overshot other asset classes and the data on models calibrated over the 2010-2014 period. Over the past decade, this would have been more than enough to call peaks in yields and to expect lower yields in the months ahead. Why would this time be different?
… Financial conditions have tightened: In the US, financial condition indices that include equities have tightened to levels that have led to a dovish shift from the Fed in the recent past (Q1 2020, Q4 2018, Q1 2016, Q3 2011 and Q2 2010). In Europe, BTP-Bund spreads are close to 200bp, a level last exceeded in the early days of the Covid crisis and during the Italian political crisis of 2018.
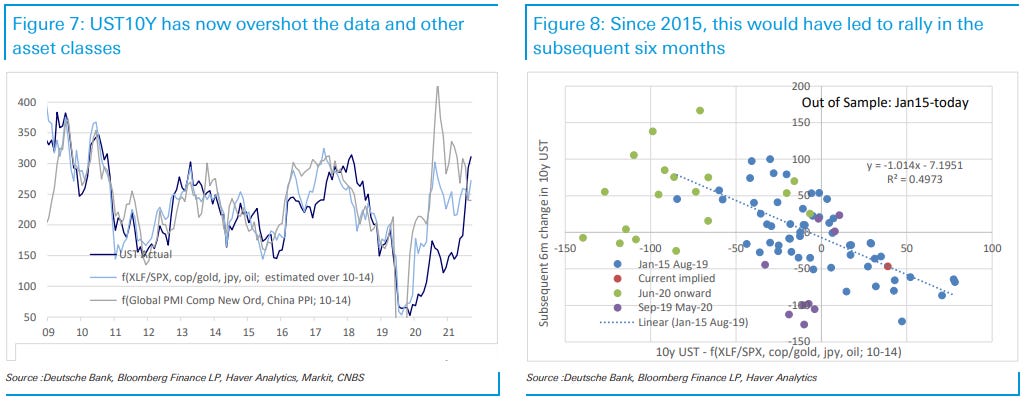
USTs have overshot valuation metrics calibrated over the last decade: For the first time since September 2020, UST10y has overshot its cross-asset proxy (copper/ gold, financials/spx, oil, JPY). It has also overshot the data (Global PMI Composite New Orders and China PPI). Historically (since 2015), this has led to a rally in UST in the subsequent six months.
… On balance the nays have it for now. But as the ayes had a good case, it is worth asking what would change the conclusion? First and foremost, a noticeable decline in inflation expectations globally and the quit rate in the US. Second, US IG credit spreads widening well above 150bp and a more disorderly move in peripheral spreads. Third, a significant shift towards tighter fiscal policy in the US. Finally, a pick-up in political risk in Italy.
For somewhat more on financial conditions and STOCKS, THIS from BBG
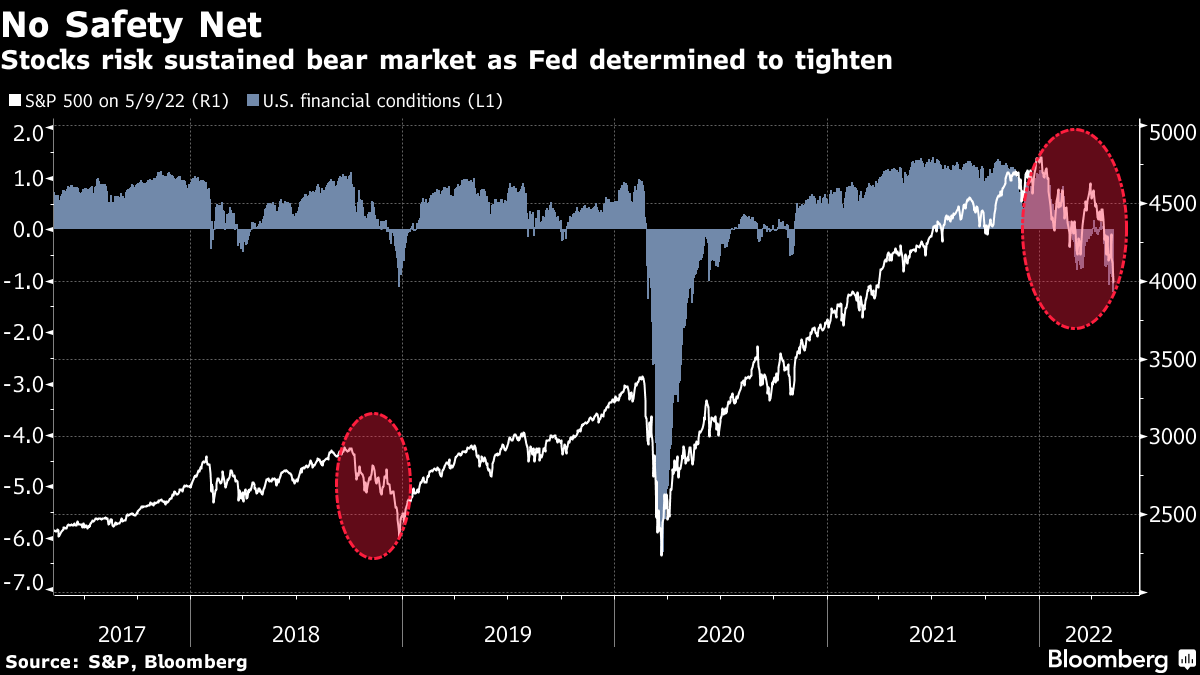
… The outlook for stocks is deteriorating in relentless fashion, and there’s one key reason it’s likely to go on doing so. Sure, there are a swarm of immediate concerns — war in Ukraine, China’s slowdown, de-globalization supply shocks — but the key worry is central bank tightening in response to sizzling inflation. U.S. stocks are getting close to what would be their first so-called bear market since the pandemic.
A more salient comparison for the current set up is the near-bear experience at the end of 2018, when a 19.8% peak-to-trough drop for the S&P 500 (closing prices) was arrested as the Federal Reserve signaled it would halt interest-rate hikes, and then moved toward cuts. The S&P 500 is now down about 16.8% from its Jan. 3, 2022, peak, and the Fed is committed to keep hiking rapidly now. That means financial conditions can stay at or worsen from current levels that are already tighter than in 2018. And stocks can keep moving lower.
Who cares? STOCKS, for one. See Josh Browns hit on how, Bonds catch a bid. Since on the topic of STOCKS, when I see this sort of writeup from THE most consistently optimistic ‘analyst’ out there, well … You might be interested,
… Put it all together, and we think there’s a recipe here for an equity rally into year end with the S&P 500 ending the year at 4,900 and the Dow at 39,000.
However, assuming some modest increases in interest rates from here, such a rally would also put the stock market in overvalued territory. So the rally we’re projecting would be something for equity investors to enjoy, but not a reason to become complacent…
Equity markets theoretically price expectations for the economic future. Yesterday’s market volatility raises the question “what new economic information did we get?”. The answer is “nothing really”. The economic outlook has not significantly changed from last week or last month. Markets seem caught in a narrative, not objectively reacting to economic news.
Equity moves create a negative wealth effect as consumers’ asset values decline. However, the US consumers most at risk recently have been low income households, who are unlikely to care about the gyrations of the Nasdaq.
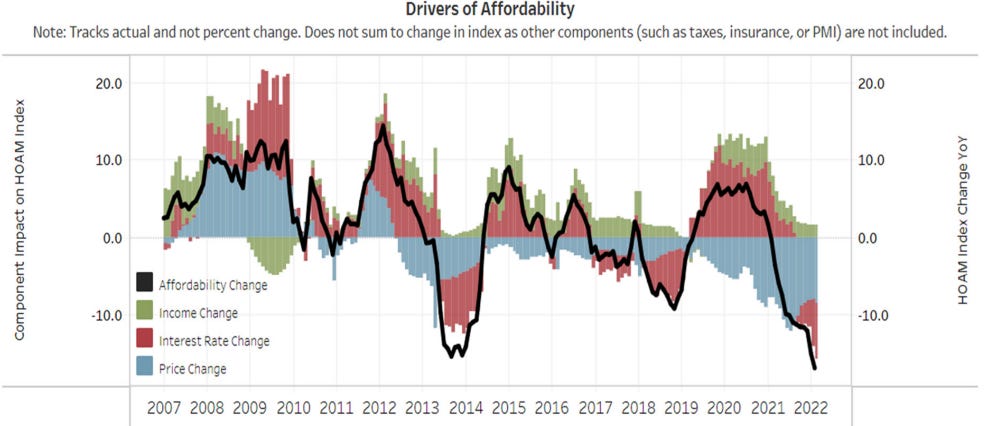
Whilst up in the ivory tower, having a look around one MIGHT notice some … ‘canaries in the ivory towers coal mine’. SWONK SAYS
Along with an excellent visual of makeup of ‘affordability’,
Swonk’s bottom line,
… The housing market was among the largest winners from ultra low rates; it is now among the most vulnerable to a correction with rates rising. Not surprisingly, markets that saw the greatest in-migration and housing appreciation during the pandemic experienced the hottest inflation. Cooling those markets is key to taming inflation.
The speed at which mortgage rates go up is already cracking the foundation of the housing market. The worst of the losses are expected to hit in 2023, unless the Fed decides to empty out the dance floor sooner. The canary is still singing but its song is growing more faint.
And speaking of economists, like those at the Fed, how about whatever message stocks have for bonds (and / or vice versa), John Authers morning thoughts
Valuation is of little or no use in timing; over-expensive stocks can always get even more expensive. Plenty of bearish commentators (myself certainly included) have been warning for years that the stock market looks too expensive, and that it would be vulnerable to a rise in bond yields. After years of being wrong, those warnings have finally come to pass. The old “Fed Model” — so called because Alan Greenspan once appeared to be using it in congressional testimony — suggests that the multiples on stocks should be a function of bond yields. The lower the bond yield, the higher the multiple you can justify paying for stocks.
In the 1990s, the relationship seemed strong. In this century, less so. But it’s striking how the rise in yields of the last few months has overlapped almost perfectly with tumbling earnings multiples. It has been the inflation shock, combined with the growing realization that the Fed will have to raise rates, that catalyzed investors to look at valuations more skeptically:
Meanwhile, economists both inside the Fed and out in the real world are STILL trying to model modern day stagflation impact on the US economy which is largely consumption based. Thankfully, Goldilocks is,
… we introduce a dashboard to monitor consumer trends across six areas that are relevant for the macroeconomic outlook. We will update our dashboard monthly to help assess the status of the US consumer …
… Exhibit 1: Our US Consumer Dashboard Indicates Very Favorable Employment Opportunities and Strong Household Balance Sheets, but Consumer Spending Faces Headwinds From Weak Real Income Growth and Low Consumer Confidence
Consumer dashboards, message from / to the stock market and other things being bantied about up in the ivory tower. A mere mention of all this without an updated recession call from the yield curve by the FRBSF well, would be miss the point.
And NOW we know … ? Until Markos NEXT BTFD note and we learn whatever happened while we slept, THAT is all for now. Off to the day job…