while WE slept: bonds on the 'backfoot'; 2025 dart-throwing contest continues (#2025 -GS); ALSO "Bond Yields are Too HIGH!" and #ZweigRules ...
Good morning … unless yer long TGT as yesterday, WMT beat and raise, we then turned the page of the calendar and TGT does exact oppo — miss and cut …
CNBC: Target shares plunge 20% after discounter cuts forecast, posts biggest earnings miss in two years
… we KNOW this is but a sideshow to this afternoons NVDA announcement and i’ll not delay much more other than to note … BONDS are on the backfoot (more from newsquawk below) but …
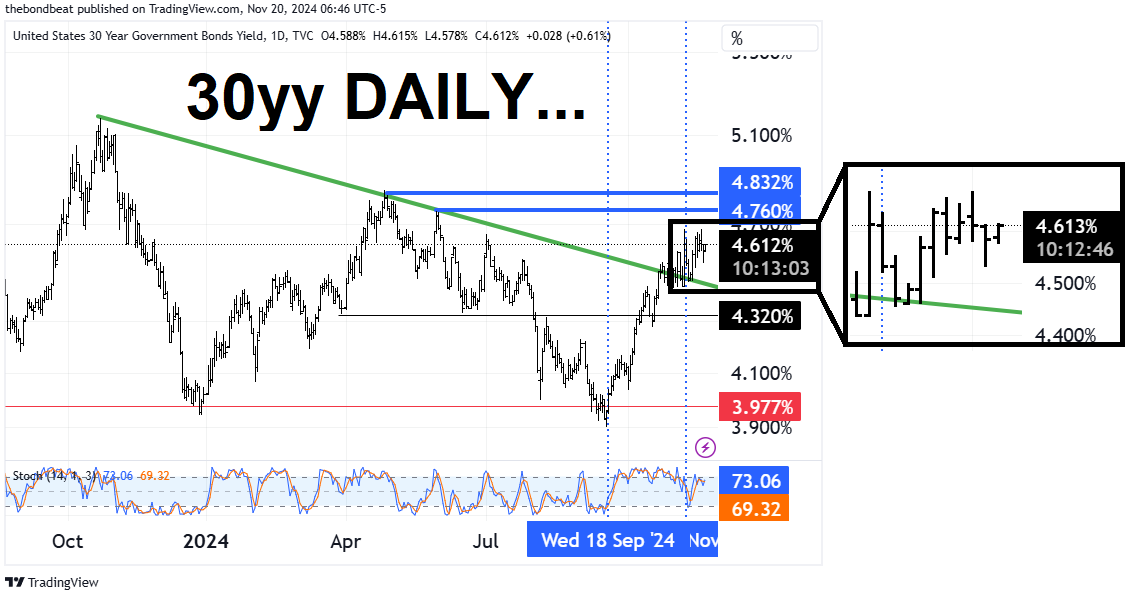
30yy DAILY: peaking just above yesterdays levels …
… with momentum leaning back towards further cheapening …
… and SO, aside from WMT, i’ll ask .. what did I miss? Monday, in a click …
ZH: Bitcoin, Bullion, Black Gold, & Bonds Bid As 'Trump Trade' Builds
… AND there was yesterday, in all it’s war-mongering F2Q glory, in a click …
ZH: Bonds, Bitcoin, & Bullion Bid As Markets Mull Moscow, Mullahs, Musk, & Macro
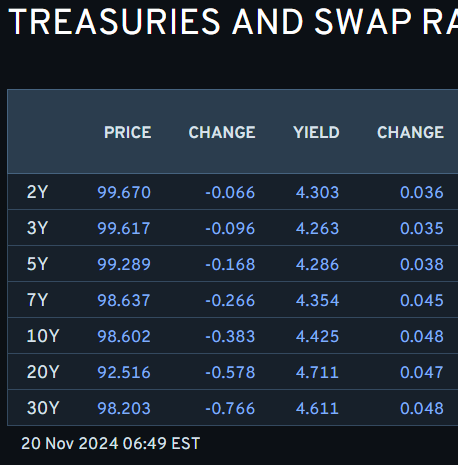
Back TO TGT trading — something to do ahead of NVDA (?) and bonds being on the proverbial backfoot … here is a snapshot OF USTs as of 649a:
… and for some MORE of the news you might be able to use…
IGMs Press Picks: November 20 2024
NEWSQUAWK: Positive risk tone sees equities gain, DXY bid & Gilts underperform post-CPI, NVDA due … Bonds are on the backfoot, and with clear underperformance in Gilts after the region’s hotter than expected CPI figures … A softer start for USTs as they continue to unwind Tuesday’s Russia-driven haven bid, taking USTs below Tuesday’s 109-19 base but still over 10 ticks clear of Monday’s 109-04+ base. Benchmark was largely unreactive to UK data or most recently EZ negotiated wages. Fed speak ahead include Barr, Bowman, Collins & Cook.
PiQ Overnight News Roundup: Nov 20, 2024
Opening Bell Daily: NVDA's dominant run … Nvidia's absurd earnings expectations stem from a decade of dominance: 5 charts … Wall Street expects another quarter of blowout numbers from Jensen Huang's chipmaker.
Reuters Morning Bid: Nvidia vigil sees risk overcome safety
Finviz (for everything else I might have overlooked …)
Moving from some of the news to some of THE VIEWS you might be able to use… here’s SOME of what Global Wall St is sayin’ …
France calling and walking down 1996 memory lane (and noting equity / rate correlations) …
BNP: US rates: Lessons from 1996
In January 1996, US rates markets reacted almost immediately after the Fed ended rate cuts after only 75bp. The curve bear flattened with short-end yields 100bp higher after two months while realized volatility rose markedly.
Recent rate cuts have been undertaken for similar reasons to the 1995-1996 ‘mid-cycle’ adjustment. In both cases inflation was above the Fed’s preferred gauge, but the FOMC cut rates to stay ahead of economic weakness and preserve a ‘soft landing’ after previous hiking cycles.
In this report, we detail the scale of the 1996 rate and vol moves as the economy re-accelerated. With next month’s FOMC meeting ‘live,’ it is worth considering if the past is prologue. Should this be the case, we think curve steepening may be severely challenged.
… UST level and curve in 1996: We index UST yield and curve levels to 31 January 1996 and measure performance (bp change) in the months surrounding the January 1996 cut (Figures 1 and 2). UST yields had been falling in sympathy with Fed rate cuts and bottomed 10 trading days after the cut. Within two months, the 2y UST yield was more than 100bp higher and was 150bp higher by mid-1996.
BNP: US equity derivatives: BTD and hedging with Equity/Rate hybrids
Buying the dip: US equities have given up a significant portion of the post-election knee-jerk gains. We think this presents an attractive entry point to strike tactical bullish ideas into year end on RSP or IWM.
Upside implied vol levels are low enough that owning call spreads on RSP or SPY is attractive; there are ~4x1 payouts for 5% rallies into Dec24 expiry. On IWM, we also like Call Spreads into year end, but our preferred trade to consider would be a 1x2 call ratio given the still-elevated IWM short-dated call wing.
Rate risks: The lack of follow-through from equities post the election raises a red flag that tailwinds this year might be weaker than after the 2016 election. One reason for this could be rates. Pre the 2016 election, the US 10y yield was <2% and the post-election move higher was not seen as a headwind for equities.
The US 10y yield is now at ~4.5%, in line with the equity earnings yield (~22x PE and 4.6% earnings yield). US 10y yields have picked up ~80bp from the September lows. We think a reflationary US equity rally can co-exist with modestly higher rates. However, if 10y yields accelerate higher, through YTD highs (now only 25bp away), that could become a more significant risk to a bullish equity view.
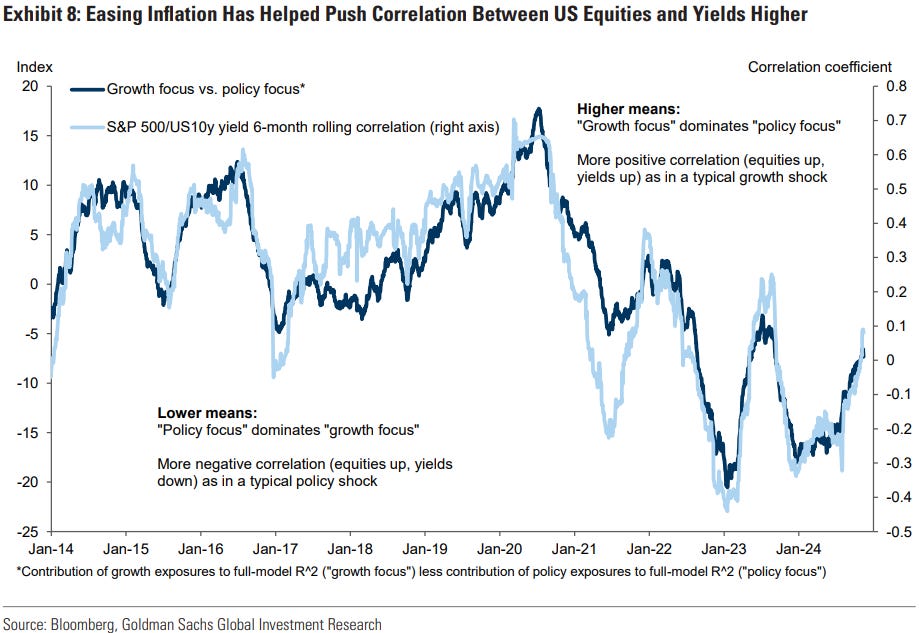
Recent realized correlation for US equities versus rates has been positive. However, if rates accelerate higher, we would expect that correlation to flip. This implies interesting opportunities to trade equity versus rate hybrids. Looking at a three-month maturity, we can find structures for both RTY and SPX down 5%, with 10y yields +25bp, that have ~10-20x payoffs. Equity puts conditional on 10y yields >+25bp also have 65-70% discount versus equivalent vanillas.
… next up are a few tech-A-mental thoughts on oil and gold where the thoughts on oil caught my inflationary eyes …
CitiFX: Oil and gold
Oil and gold have seen short term bounces recently. We reiterate our view that we see upside in gold, while Brent and WTI continue to look lackluster.
…WTI (CL1)
WTI futures show a similar chart to Brent. We posted a bullish outside day off support at 66.33 (October low). IF we see a weekly close below 65.27 (2024 low), it would open the door to a move towards 62.43-63.64 (December 2021 and 2023 low).Resistance is likely at 76.09-76.84 (55w MA, 200d MA).
Watching … and once again from France TO Germany we go with a note and a visual showing how rates react TO data (and surprises) …
DB: Data surprises and front-end yields
Today’s chart explores the relationship between changes in economic data surprises and front-end yields over the past two decades. We calculate the coefficients in the chart from regressing daily changes in 2y yields on daily changes in the Citi Economic Surprise Index over a 90-day rolling period. The coefficients have risen sharply since the beginning of the hiking cycle in 2022, reaching the highest levels since the global financial crisis and remaining at elevated levels through the pause and the beginning of cuts. In other words, front-end yields have become more sensitive to economic data surprises.
The increased yield sensitivity in part reflects the nature of the aggressive hiking campaign in this cycle, and it also supports market perceptions that the Fed has become more data-driven, which increases the importance of notable surprises in economic data releases when it comes to front-end rates. If so, we would expect these elevated readings to persist over the course of this cutting cycle. The finding that recent movements in yields have reflected adjustments in data surprises is in line with our previous note exploring drivers of US yields, where we found that economic data has been the largest factor in the market repricing this year.
… 2025 dart-throwing continues and trhese are for all us muppets …
Goldilocks: 2025 Global Rates Outlook
Terminal Differences…Global duration: divergent fortunes — Europe the best long
Persistently large deficits in the US underpin both a higher neutral rate assessment in the US for the current cycle as well as elevated term premia. Still, US rates have embedded more upside risk in the aftermath of the election, suggesting that investors can plausibly expect to earn the yield and a bit more at the 10y point, provided a bullish resolution of a few key factors. On a total return basis, our 4.25% YE25 forecast implies about 5% to owning 10y USTs given an end-24 forecast of 4.3% (Exhibit 4), consistent with slightly positive (~1%) excess returns versus bills. In other words, we think investors will be modestly compensated for taking US duration risk, consistent with current term premium estimates…Given the healthy domestic outlook, why are we not bearish on US duration next year? In part because US growth resilience is more fully priced into asset markets following the election; rather than arguing for significantly higher yields still, we think its realization should keep intermediate and longer-term forwards somewhat sticky at higher levels while Fed cuts sustain a stronger rally at the front-end…
…Despite our forecasts for modest returns vs cash in major bond markets, duration still offers a hedge against negative growth shocks given the skew of risks for yields remains asymmetric to the downside should growth disappoint. However, under our base case of robust growth, the path to benign rate relief is narrower …
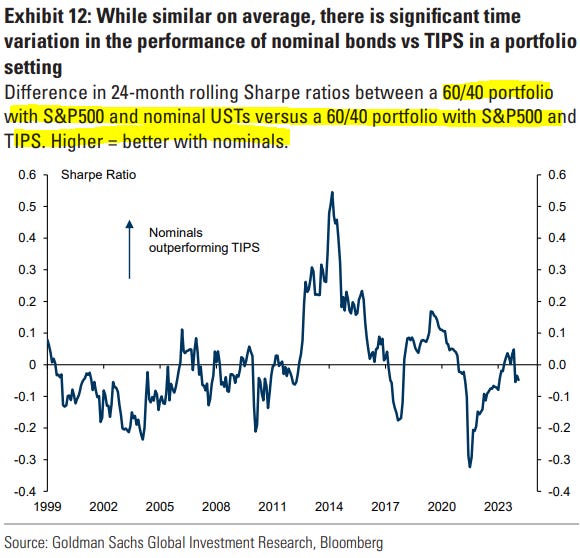
…Alongside the evolution of inflation risks, it is also worth considering the value of real rates in a portfolio context. While nominal rates have typically been the cornerstone of multi-asset portfolios, real yields have at times also played a valuable diversifying role. Since 2000, the total return case for replacing nominal bonds with TIPS in a multi-asset portfolio has been somewhat weak empirically and owning TIPS alongside S&P500 in a 60/40 portfolio largely yields the same Sharpe ratio as owning nominal bonds with S&P500. This is primarily because as long as inflation risk premia pricing is relatively modest (as has been the case over most of the last 20 years), owning TIPS should mostly be equivalent to owning nominal bonds as long as inflation breakevens are an unbiased reflection of realized inflation outcome. Meanwhile relative liquidity considerations can expose TIPS to significant underperformance during market stress periods.
However, looking at the average performance also masks the significant time variation in relative performance of nominals vs TIPS. Exhibit 12 shows that the two-year rolling Sharpe ratio of a 60/40 portfolio with S&P and nominal bonds can differ significantly from that of a 60/40 portfolio with S&P and TIPS over time…
Goldiloarcks: Global Markets Analyst
Markets Outlook 2025: Trading Tails and Tailwinds…highlighting as usual 10 core investment themes that drive many of our market views. More detailed outlooks for the individual asset classes are forthcoming.
1. A wider distribution after the soft landing: Solid growth, higher equities and stronger Dollar in base case, but markets have moved and tails are fatter.
2. Weighing the tariff tail: Tariffs on China are largely expected and manageable; ‘across-the-board’ tariffs would be more inflationary, more USD-positive and more ‘risk-off’.
3. Finding terminal rates in a world of fiscal risks: US post-election fiscal expansion (joining Japan, UK and some EMs) raises risks of higher terminal rates.
4. Renewed divergence reinforces Dollar strength: US growth stronger than DM peers, and consensus; broader tariff agenda is where the real Dollar upside remains.
5. China in the cross-hairs but some scope to respond: Ultimately, challenges and prospects for China asset picture still mainly rest on domestic policy delivery.
6. Europe and EM—a more challenging picture …
7. Energy markets—ample supply, watch the tails …8. A bit more inflation risk but growth shocks still in focus: Equity-yield correlations likely to drift higher; value in Treasuries/TIPS, and especially Bunds and Gilts, in portfolios.
9. The growing valuation challenge …
10. Diversification, tails and hedges…Goldilocks: 2025 US Equity Outlook: The Art of the Deal
We forecast the S&P 500 index will rise to 6500 by year-end 2025, reflecting an 11% price gain from the current level and 12% total return with dividends. Our view is predicated on continued US economic expansion, earnings growth of 11% in 2025 and 7% in 2026, and a forward P/E multiple of 21.5x at the end of next year, a 1% compression from the current P/E of 21.7x. Our projected return would rank in the 46th percentile of the historical distribution of 12-month returns….
… MORE on state labor data …
ING: US state payrolls numbers confirm the cooling jobs narrative
Headline non-farm payrolls were significantly weaker than expected in October. Today's state data show that this wasn't entirely due to temporary strike- and hurricane-related factors and that there is a broader cooldown in play. This suggests to us that a December Federal Reserve interest rate cut remains more likely than not
… have you had ‘nuff ‘bout state labor data? too bad too sad …
MS: PULSE: US Economics: The slowing in October payrolls was largely storms
Today's data on state payrolls confirmed that hurricanes accounted for much of the slowing in payrolls in October. They suggest that the storms subtracted 60k. The drag should be mostly reversed in November. (We had figured a slightly larger drag of around 75k.)
The slowdown in payrolls (to +12k in October from +148k per month averaged in 3Q) also reflected a 41k drag from new strikes.
The return to work of hurricane-affected employees and of strikers boosts November payrolls by an estimated 100k. We expect that the 60k hurricane drag is fully reversed. Strike resolutions add 40k. A near-275k rise in November is not out of the question. (We have not finalized our forecast.)
We also expect upward revision to September-October payrolls of about 50k.
Last month's net downward revisions to August-September payrolls probably exaggerated weakness.
… live from the Swiss …
UBS: Inflation quirks
UK consumer and producer price inflation data for October leads today’s data calendar. The headline numbers will be distorted by the weirdness of UK energy pricing (despite large-scale renewable energy generation, gas prices determine what consumers pay). Bank of England Governor Bailey yesterday put some emphasis on service sector inflation, while advocating a gradual reduction of rates.
The Eurozone publishes third quarter negotiated wage data. Will markets stop trading in tense anticipation of this release? They will not. Will economists be giving it some attention? Maybe. Wage growth has become an important part of the medium-term growth and inflation narrative.
Japan’s October trade data showed stronger export numbers, led by trade with Asia (excluding China) and the chipmaking machinery and medical goods sectors. Thus, the data is not necessarily a signal of consumers choosing to spend more on goods.
US President-elect Trump cast the investor Lutnick in the role of commerce secretary, where (if confirmed) he will oversee the consumer tax increases represented by tariffs. This obviously means that Lutnick is not in the race to be treasury secretary, and the issue of who does get to sign dollar bills is still uncertain. Questions like Fed independence and trade tariffs make this appointment important to markets.
… Covered wagon folks weigh on on the STATE labor data …
Wells Fargo: Strikes and Storms Disrupt State Labor Markets in October
A Majority of States Shed Payrolls While Unemployment Rates Moved HigherSummary
State Labor Markets Broadly Weak
Labor markets weakened across the nation in October. Twenty-nine states shed payrolls, the highest count since the pandemic recession save for July 2023.
Although Hurricanes Helene and Milton made their mark on state labor markets, they alone cannot explain October's softness. The Bureau of Labor Statistics indicated that strike activity in the manufacturing sector influenced payroll counts as well. What's more, labor markets were generally easing before October.
Several states in the hurricane-impacted Southeast saw payrolls drop notably. Florida, the state where hurricanes Helene and Milton made landfall, registered the sharpest overall contraction with 38K payroll losses on net. Similarly, North and South Carolina lost 5.5K and 3.5K payrolls, respectively.
Meanwhile, payrolls in Washington declined by 35.9K, the largest monthly fall since the throes of the pandemic. The sharp pullback likely reflects the labor strike at Boeing, which has a significant employment base in the state. Elsewhere, hiring fell by 10.9K in New York and 10.6K in Texas.
Payrolls in October rose in 21 states. The largest expansion occurred in Colorado, which added 9K payrolls on net, followed by Louisiana and Ohio.
Unemployment rates rose in 22 states, were unchanged in 20 states and fell in eight states. Louisiana, Michigan and South Carolina experienced the largest over-the-month bumps, rising by 20 bps each. Meanwhile, unemployment rates in Ohio, Delaware and Connecticut each posted 20 bp declines.
The number of states experiencing a trend rise in their unemployment rates increased to 37, surpassing the 34-state threshold historically associated with recessions. While one-off factors likely exerted upward pressure on state unemployment rates in October, this count was on the rise before the most recent month.
Nevada and Washington, DC hold the highest unemployment rates in the nation at 5.7% each. South Dakota leads the nation with the lowest unemployment rate (1.9%), followed by Vermont and North Dakota.
… And from Global Wall Street inbox TO the WWW …
Bloombergs Bolingbroke on positions and bets …
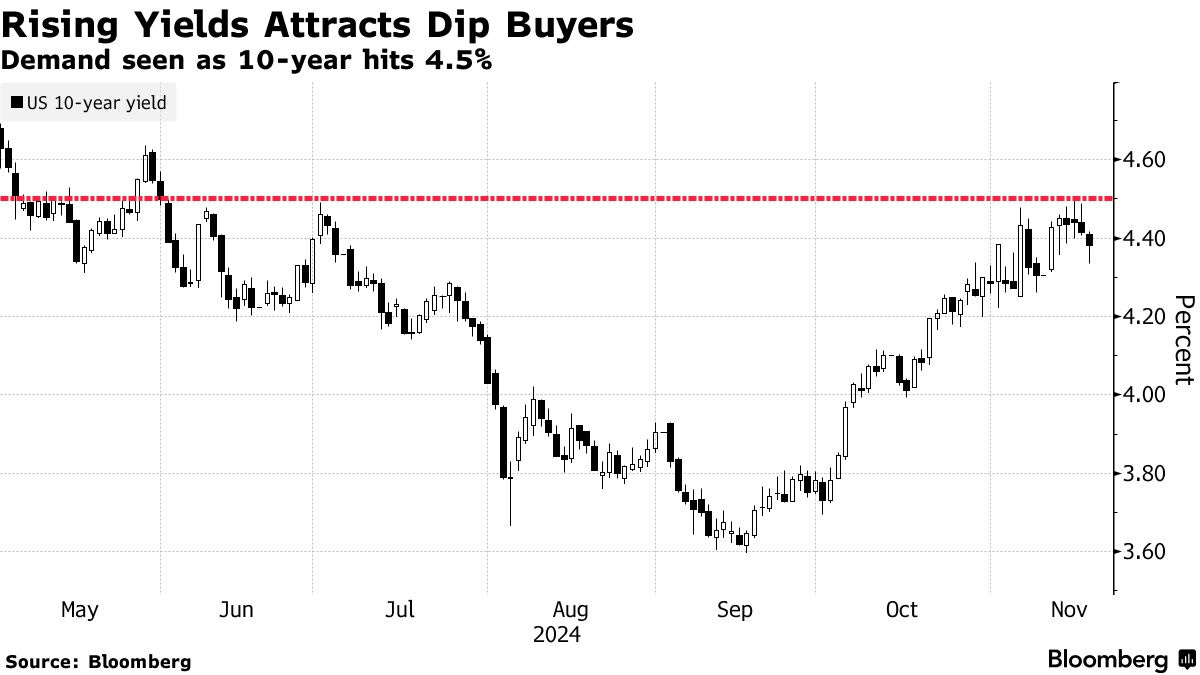
Bloomberg: Bond Traders See Short-Bet Payoff Capped as Dip Buyers Emerge
Traders have boosted bearish wagers after Trump victory
But buyers emerge as yields rise to multi-month highs
… Traders boosted bearish wagers in the past week, helping push benchmark 10-year yields briefly to 4.5% for the first time since May on the view that President-elect Donald Trump’s policies would spur quicker growth and inflation. Resilient US economic data and dwindling expectations for deeper Federal Reserve interest-rate cuts also played a part.
That level in the 10-year rate, and around 4.68% on the 30-year Treasury, then appeared to draw in buyers, potentially from investors who are holding out hope that the world’s biggest bond market can rally in the coming weeks and avoid a losing year. Tuesday also brought a burst of haven buying as tensions escalated in Russia’s war against Ukraine, adding roadblocks to bond-market shorts.
The upshot is that trades leaning toward higher yields heading into next year look like they’re capped at least for the moment, signaling the potential for a range-bound stretch and ebbing volatility. That backdrop of diminished gyrations may prompt more wagers in listed options targeting periods of calm, such as the $27 million strangle sale seen on Monday.
… more from The Terminal dot com and this next OpED offering some thoughts on consumption ahead of hols which caught my eye …
Bloomberg: Prediction Markets Won It, Right? Only Up to a Point
They don’t deserve quite this much post-Trump afterglow. And polls did better than they’re credited.…The Consumer Test
The post-pandemic resilience of the American consumer is almost like wine — it gets better with time. October’s retail sales data backs the narrative of a continuing splurge ahead of the holiday season. The latest print topped consensus estimates and the prior month’s figures were sharply revised. Glenmede’s Jason Pride describes the consumer as a V8 engine firing on all cylinders, and retail traffic volumes in the coming weeks should come in even stronger. This chart offers a baseline for the upcoming holiday season:
… rest of the note more political and clearly the commenter one of the many NOT able yet to grip the reality — mandate and majority have spoke and DJT EARNED a ‘honeymoon’ and not all is lost. Not YET … MORE on the honeymoon in as far as yields go …
Paulsen Perspectives: Bond Yields are Too HIGH!
The almost 1% increase in the 10-year yield since mid-September should begin moderating U.S. economic momentum by late December allowing a renewed bond market rally in the New Year!Bond yields have taken center stage in the financial markets. The 10-year Treasury bond yield has surged from a low of 3.6% on September 16th to an intraday high briefly last Friday above 4.5%! The nearly 1% rise in just two months is due to a variety of reasons.
First is the Trump trade. Leading up to the Presidential election, a consensus developed that a Trump win would mean higher bond yields as his agenda advocated juicing economic growth with fiscal spending and tax cuts. As the political presidential betting markets rose expecting a Trump win, bond yields also rose and have continued higher since Trump won the White House.
Second is a growing obsession with a rising Federal deficit, debt, and interest burden. Large peace time deficits since the pandemic have produced a troublesome Federal government debt service burden raising investor anxieties that bond vigilantes may ultimately impose fiscal discipline by simply refusing to buy bonds and forcing yields higher.
Third, the recently announced Federal Reserve’s easing campaign is now proving wishy-washy and uncertain as Fed members increasingly are recanting on how fast they may cut the Funds rate. This has forced bond investors to also alter their yield expectations.
Fourth, until very recently, a persistently strong stock market has been unfazed by surging bond yields. Often, upward trending yield markets keep rising until something breaks – usually until the stock market succumbs.
Fifth, inflation concerns are again rising. Most inflation reports remain tame and hardly alarming. For example, the Bloomberg U.S. commodity price index has declined by about 6% from its recent high at the start of October and remains almost 30% below its post-pandemic peak in mid-2022. The CPI inflation rate has risen mildly to 2.6% from its post-pandemic low of 2.4%, the PPI inflation rate is just 2.4%, and the overall U.S. wage tracker is currently at its post-pandemic low of 4.6%. Current inflation reports overall remain docile, but inflation expectations (fears?) have nonetheless recently increased slightly. The 10-year U.S. breakeven rate (the 10-year forward inflation expectation of the bond market) has risen from 2.03% in mid-September back to where it last was in early June at 2.38%.
Although these factors have contributed to the recent surge in bond yields, in my view, they have played only a minor role. While I may be wrong, these seem like explanations offered whenever yields rise rather than major contributors to the real reason why yields have increased. I think there is an overwhelming culprit behind the recent rise in bond yields and that is simply improving economic momentum. Yields should keep rising as long as economic activity proves stronger than expected. But when economic momentum again moderates, yields will likely decline and all the “reasons” for rising yields should quickly disappear.
… ever wonder what’s driving interest rates higher? welp, there’s lots of views on the intertubes and here’s one …
Sandbox: What's driving interest rates higher, plus bitcoin's smashing success and icebergs
…Higher rates? I thought we were cutting rates!
The post-election rally seems to have lost some steam – temporary or not, we shall see – amid rising interest rates and less dovish commentary from Fed Chair Jerome Powell.
The relentless backup in yields since the Federal Reserve initiated its rate cutting cycle on September 18 is quite remarkable. From 3.6% to 4.4% on the 10-year U.S. Treasury while the Fed begins its easing cycle with 75 bps in cuts to their policy rate – just the way strategists drew it up.
A popular narrative is that rates have been climbing as the unified Republican Party sweep takes hold of the market. Campaign promises like deregulation and tariffs bring about more growth and more inflation, and the bond market is repricing these prospects accordingly. The market could be signaling a growth re-rating from this fiscal impulse, the so-called Trump Bump.
Another narrative emerging more recently is monetary policy expectations, which we all know is a powerful driver to changes in both sentiment and positioning. “The economy is not sending any signals that we need to be in a hurry to lower rates,” Chair Powell stated during a speech in Dallas last week. “The strength we are currently seeing in the economy gives us the ability to approach our decisions carefully.” Hmmm, from a supersized 50 bps rate hike in September to a we’re-in-no-hurry statement in November. Quite the pendulum shift for the Federal Reserve’s most powerful tool, it’s public signaling/guidance or “Fedspeak,” for short. Make no mistake, Powell’s speech last week leaned quite hawkish and supports the higher-for-longer camp.
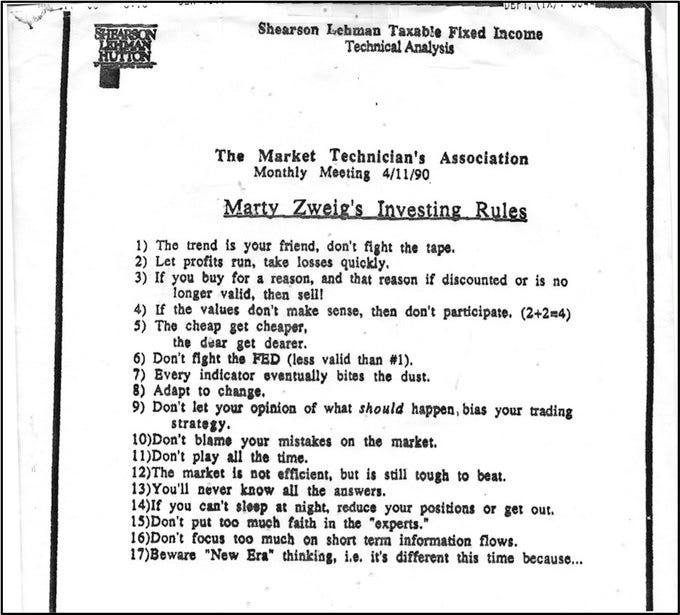
And, as we learned from famed investor and market forecaster, Marty Zweig, all the way back in 1990, rule #6 says “Don’t fight the Fed.”
What’s also not immediately clear to me is how much current economic conditions are in part responsible for higher rates. The CITI U.S. Economic Surprise Index – which measures how strong the reported data comes in vs. expectations – has been climbing higher throughout 2024. Its significance is confirmed by the market because yields are often moving higher on days in which strong economic data is being reported. Remaining above-trend for economic growth does, in fact, support higher yields over the long-term.
Maybe the yield story reflects rising risks from the enormous balance of the U.S. debt load, the ongoing fiscal deficits, and our deeply-entrenched standing as the reserve currency in global markets. Not to discount the size or importance of these issues but investors have been worrying about these same matters for decades. One day they will be proven right, but that day is not today, or even tomorrow.
Like most things in life, it’s not just one thing or another. It’s a mix of them.
Ultimately, investors should maintain a flexible stance on the future path of interest rates and understand risks to both higher and lower rates exist on either side.
Source: The Chart Report, Yardeni Research
… finally on foreigners holdings of USTs …
WolfST: US Treasury Debt Held by Foreign Investors: Ravenous Appetite for Juicy Yields, Juicy Compared to their Stuff at Home
Will foreign investors buy the Recklessly Ballooning US Debt? Increasingly crucial question. But yield solves demand problems.
… THAT is all for now. Off to the day job…


