while WE slept: Bonds modestly softer in a continuation of the prior day’s losses; month-end extensions recon; BI says: awaiting bull steepening, 10s TO 3.79 by y/e & 1st CUT in NOV
Good morning … Today’s dance card is highlighted by $44b 7yr USTs…
7yy: watching bearish momentum and 4.40% (near TLINE and mid range)
middle of the recent range (5.00 - 3.80) is just about 4.40% and is beckoning and this as momentum (stochastics, bottom panel) remains a BEARISH — higher yield — input)l and so … perhaps a bit more of a concession warranted and is coming where higher yields, then, to be met with dip buying of all sorts including month-end indexers (see below) and Team Rate CUT …
… And with that in mind — something to look forward to ahead of tomorrows ‘flation report — here’s quick recap of the DATA helping shape shift the price action (concession) ahead of todays the auction
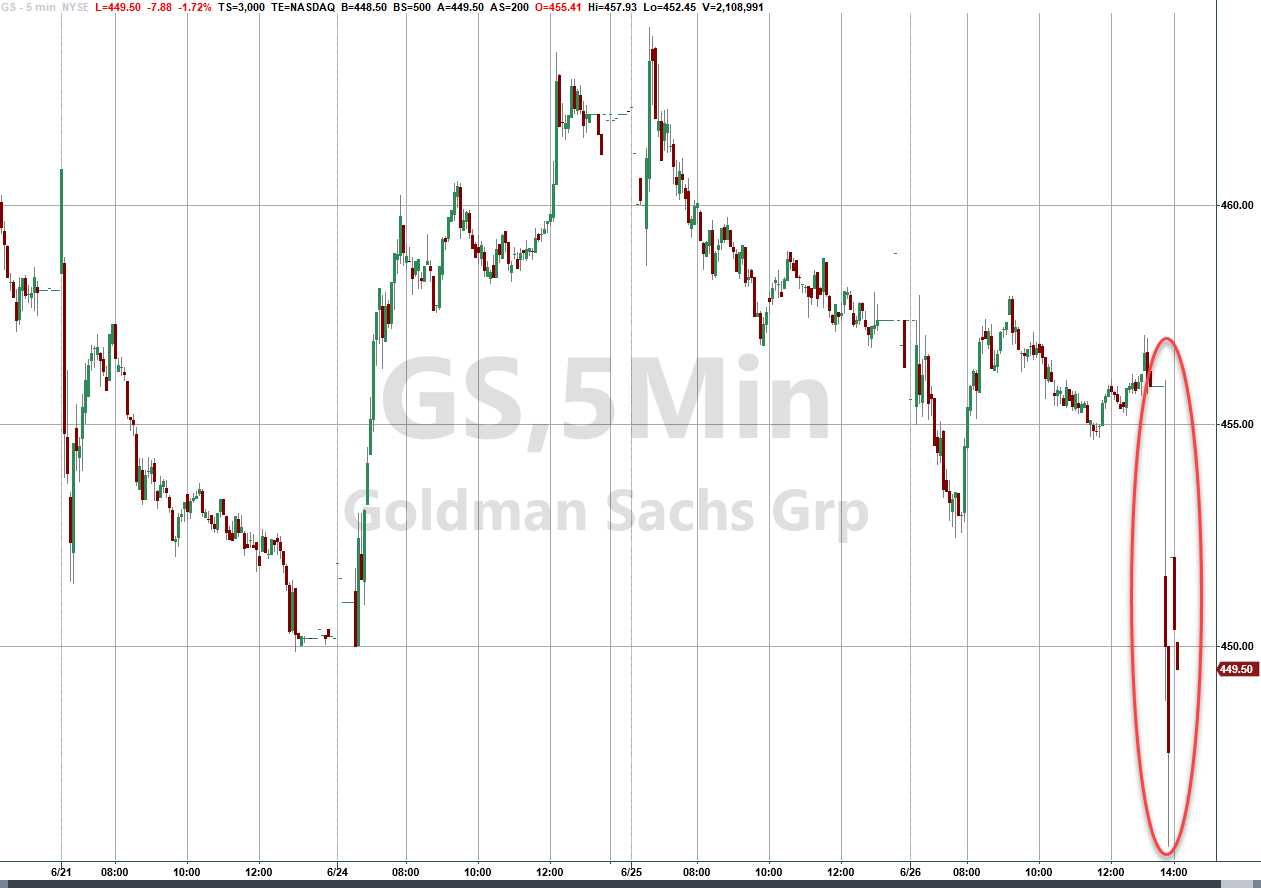
ZH: US New Home Sales Crashed In May (isnt this bullish?) ZH: As Usual All US Banks Pass the Fed's "Stress" Test; Goldman Unexpectedly Has 2nd Ugliest Credit Card Portfolio (and the CC portfolio issues apparently mattered)
... something which wasn't lost on the market.
… The Fed said Wednesday that it expects banks to wait until after 4:30 p.m. Friday to publicize any plans for dividends and buybacks. The agency expects stress capital buffers, the required cushion driven by stress-test results, to go up in aggregate as the liquidity that the Fed feeds banks via various emergency mechanisms and acronyms always eventually leaks out to their shareholders about a year later.
… And to be clear, the report itself, doesn’t deliver well in an inbox (444p)
from: Federal Reserve Board Notification date: Jun 26, 2024, 4:44 PM subject: Federal Reserve Board annual bank stress test showed that while large banks would endure greater losses than last year's test, they are well positioned to weather a severe recession and stay above minimum capital requirements
… Hey … so, things would be WORSE than last year (so, deterioration), but don’t worry be happy.
TEAM RATE CUT leaning in (again) …
I know, it’s shocking to see the banks pass, right? Crazy! Only some of this news of yesterday (housing) was available ahead of the 1pm bidding deadline and this helped set stage and bidding frenzy aka 5yr auction
ZH: Solid 5Y Auction Stops Through As Foreign Demand Jumps To 4 Month High
… The internals were more remarkable: Indirects took down 68.9% which was the highest portion going to foreign buyers since the 70.5% in march; it was also above the 66.0% recent average. And with Directs taking down 17.7%, up from 15.4% last month and just above the 17.5% average, Dealers were left with just 13.4% of the auction, the second lowest since September with just March below today's print.
… ok so maybe NOT a frenzy but … one might not blame me for hoping it mighta / coulda / shoulda been one because, you know …
Bloomberg: Bond Traders Boldly Bet on 300 Basis Points of Fed Cuts by March
… anyways, the REAL story past couple / few days been building on a quiet summer week ahead of tomorrows PCE data and summarised by end of day recap …
ZH: Yen-sanity Blows As Jensenity Slows: Bonds & Bullion Dumped As Big-Tech (Ex-NVDA) Jumps
Fooling nobody who’s still reading, I’ve got little to NOTHING more to offer.
I did happen to catch latest (June 24) report from Bloomberg Intel (BI) and for any / all looking for somewhat more …
The Bloomberg US Treasury Index can rally over the second half of the year as the economy and inflation moderate further, potentially returning about 4.5% for 2024, based on our scenario. The economy could remain just strong enough that the Federal Reserve waits until after November’s elections to start cutting interest rates, yet once it does, the market may price for a series of reductions leading to bull steepening of the yield curve.
Awaiting Bull Steepening: The Treasury yield curve may not begin to bull steepen until the Federal Reserve starts lowering interest rates. Consensus had been for the curve to uninvert this year, but we think the trend toward a steeper curve won’t occur until the economy weakens further, allowing the Fed to begin a series of rate cuts.
TIPS Yields to Lead: Real yields expressed by Treasury Inflation Protected Securities (TIPS) may be the first to move in Treasuries. Over the past 18 months, longer-term inflation expectations have remained stable, which we expect to continue.
Election May Have Longer-Term Effects: The outcome of November’s vote may not be positive from a fiscal/debt issuance perspective as both leading candidates lack fiscal restraint. The next president will appoint a new slate of Federal Reserve leaders. Federal elections traditionally don’t spark a knee-jerk reaction in markets, with 2016 the notable exception.
Featured in This Report: Our proprietary models, starting in Section 3 and available on the Terminal, show fair value for 10-year Treasury yields and gauge Fed sentiment with our Natural Language models and the BI Minutes Sentiment Score model.
Global Wall informing BI informing Global Wall … we’ve all been ‘awaiting bull steepening’ haven’t we?
In any case, BIs year end tgt for 10s is 3.79% (why NOT just 3.80 or 3.75? dunno but am thinking we’ll read full 65pg report and learn)?
One interesting, if not completely unrelated to anything other than FEDSPEAK, chart which caught MY eye on first glance …
… We don't see the Fed cutting rates until after the November presidential election. We're skeptical that economic data and inflation will be weak enough to overwhelmingly point to a September rate reduction -- election angst aside.
The Fed's June summary of economic projections had a "dot plot" showing the median Fed member saw only a single 25-bp rate cut in 2024, followed by 100 bps in each of 2025 and 2026, with a longer-run "neutral" rate of 2.75%. Though the Fed's dots aren't often realized, the important indication they give is the expectation of the members based on each one's economic forecasts. The Fed believes "longer run" PCE inflation will fall to 2%, suggesting a real federal funds rate of about 75 bps as the median member's view…
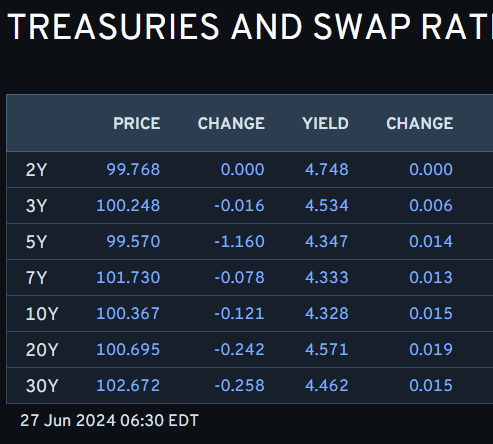
… AND here is a snapshot OF USTs as of 630a:
… and for some MORE of the news you might be able to use…
NEWSQUAWK: US Market Open: US equity futures modestly softer, MU -5.6% post-earnings, USD slips helping to lift Crude & XAU … Bonds are modestly softer in a continuation of the prior day’s losses … USTs are down to a 109-28 base with the benchmark on a gradual downward path once the fleeting upside from Wednesday's strong 5yr sale dissipated; 7yr tap this evening. Overnight, Treasuries came under pressure alongside a move lower in JGBs as the latter extended below 143.00 to a 142.58 base.
Finviz (for everything else I might have overlooked …)
Moving from some of the news to some of THE VIEWS you might be able to use… here’s SOME of what Global Wall St is sayin’ …
BAML US Rates Watch: Private pension fund rebalancing update
Rough estimate for direction of rebalancing needs We use the framework introduced in the Pension fund rebalancing and UST demand report, to estimate expected June quarter-end rebalancing flows. The rebalancing needs of a portfolio that contains two assets (with allocation weights w1 and 1-w1) and N assets under management is a function of the relative total return performance of the two asset classes (r1-r2):
Rebalance = N * w1 * (1-w1) * (r1-r2)
The underperformance of corporates mtd (c.1.7%) vs the S&P & the 10y+ UST index (c.3.1% & c.4.2% performance, respectively) drives the expectation for a month-end rebalancing out of equities & USTs and into corporates. For the quarter, however, we see the performance for corporates c.0.6% vs c.4.3% & 0.5% for the S&P & 10y+ USTs, respectively, implying quarterly rebalancing needs broadly out of equities and into FI.
Our expectations for rebalancing flows Assuming only c.1/3 of the Apr and May rebalance was performed at the respective month ends, we see c.-$31bn outflows from equities and c.$3bn inflows into USTs (the 3y stdDev of quarterly rebalancing flows is c.$25bn for equities & 12bn for USTs, so a material -1.2σ equity outflow). For other FI assets the flows break down as: c.$23bn into Corporates, c.$5bn into Agency & GSE-backed securities, and unch. Mortgages.
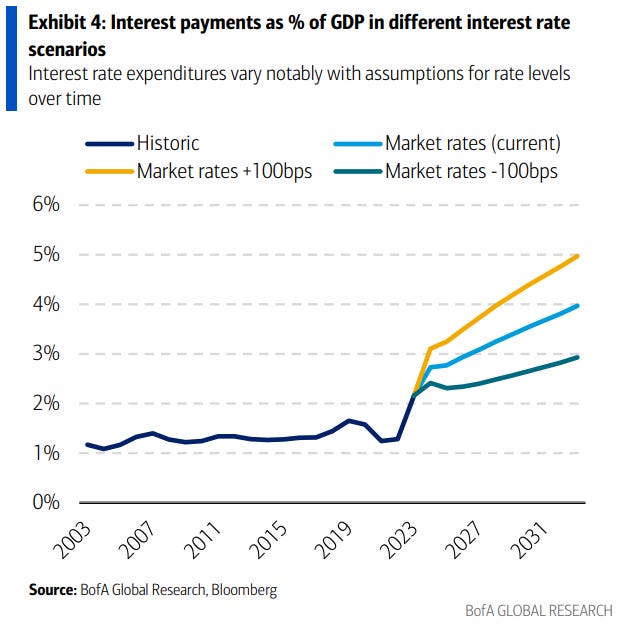
BAML Liquid Insight: UST deficits & supply: up, up and away
Key takeaways
Deficit forecasts have evolved higher and total around $2tn through FY '26, nearly doubling from forecasts as of '21
Larger share of spending stems from interest rate expenditures & we see upside risk to CBO's latest deficit revisions
UST will likely need to grow duration supply as early as May '25 refunding & respond to evolving demand backdrop
BARCAP: May new home sales drop, but revisions show stronger trend
May new home sales fell 11.3% m/m, to 619k, alongside a 64k upward revision to the prior month. The print highlights continued demand in prior months through revisions to February-April. Meanwhile, the median new home price declined and months' supply increased to 9.3.
DB: Quarter-end flow estimates (for June 30, 2024)
The US Treasury Index extension for July 1 is estimated to be 0.05 years. This is the smallest extension since March 2020, and it compares with the average July extension of 0.074 years for 2019-2023 and the average extension of 0.08 years over the last 12 months. We forecast net buying of ~$15.9mm in DV01 from passive indexers1 , or about 36% smaller than the last 12-month average forecast.
Pension rebalancing SPXT has outperformed the US Agg by 3.6% in the current quarter, compared to outperformances of 11.3% in Q1 and 4.9% in Q4 2023. We forecast $48bn in rebalancing flows toward fixed income securities during the quarter by DB pension plans, basing this estimate on static-weight calculations and a model incorporating underinvestment and asset growth in the most recent quarter. In Q1, DB pensions purchased $30bn of debt securities, which was less than the model's estimate of $45bn, while their asset base grew by $220bn. The rebalancing flow forecast for Q2 is about 8% higher than for the last quarter.
Translating the forecast into DV01 terms, we estimate ~$23mm of net buying in long-end Treasuries using the latest UST allocation figure of 32%. A scenario analysis of different allocation percentages suggests a range of $14mm to $35mm rebalancing flows for Treasuries during the current quarter…
We are closing our tactical long recommendation on crude oil (Supply conundrum; tactical long, 5 Jun 2024). While we maintain a short term bullish stance and think there is further upside to Brent USD 88/bbl, the risk-reward on the trade is beginning to look more balanced. Supply demand in the third quarter indicates a substantial deficit of -900 kb/d, and an unbiased inventory regression (2012-2023) suggests Brent could average USD 90/bbl over the second half, above our forecast of USD 88/bbl in Q3. Therefore we would not recommend turning short, although the most concentrated part of the move may possibly be behind us.
If indeed Brent prices carry on rising toward USD 88/bbl, one contributing element is that ICE Brent positioning took such a large move into negative net positioning in early June, and remains a modest net short position compared to the net long which is more typical (10y avg +5%, 5y avg +2% of open interest). However, this may occur later in the third quarter, so a continued bullish recommendation may no longer qualify as 'tactical' in its timeframe.
US first quarter GDP is revised, and will keep being revised; we will not have a clear picture of current GDP performance for five years or more. Markets will pay some attention to prices from the personal consumer expenditure deflator, but May data is due tomorrow. Politicians use GDP as a weapon or a rallying cry, but GDP is so far from real world living standards that voters do not care whether growth is reported as 1.4% or 1.3%.
US President Biden and former President Trump debate tonight. This might accelerate investors’ focus on politics (which normally starts around September). Both sides have focused on the other candidate’s fitness for office, so markets probably care more about presentation than policy pledges. Investors tend to regard Biden’s policies as representing some continuity, and to dismiss Trump’s policies as campaign rhetoric that would not actually be implemented…
Wells Fargo: New Home Sales Pulled Back Sharply in May High Mortgage Rates Continue to Weigh on Sales
Summary New Home Market Softening as Rates Restrict Activity New home sales fell 11.3% to a 619K-unit pace in May, the weakest pace since November 2023. The new home market has softened recently alongside higher mortgage rates, increased availability of existing homes and a more moderate pace of economic growth. Although these factors are likely to remain as a constraint moving forward, an uptick in mortgage applications for purchase so far in June suggests that the small dip in mortgage rates over the past several weeks will translate to a slightly stronger pace of home sales in coming months.
Looking further ahead, the Federal Reserve appears poised to initiate a rate cutting cycle later this year, which should help mortgage rates fall further. While lower rates likely will help improve affordability conditions for buyers and make pricing incentives less of an imperative for home builders, a deteriorating macroeconomic backdrop marked by higher unemployment and slower income growth will likely continue as headwinds for the new home market.
Yardeni: Rate Cuts This Year Unlikely As Fed Gets Closer To 2.0% Target (MOSTLY behind paywall BUT … you’ll get the drift)
We still expect that the Fed's preferred core PCED inflation measure will fall to the Fed's 2.0% target by the end of this year (chart). It was already down to 2.8% y/y in April. May's number will be released on Friday, and should show further progress.
We don't see the Fed cutting the federal funds rate (FFR) this year, which should keep the 10-year yield above 4.00% in the second half of 2024. Here's our take on the latest relevant developments and Fedspeak:
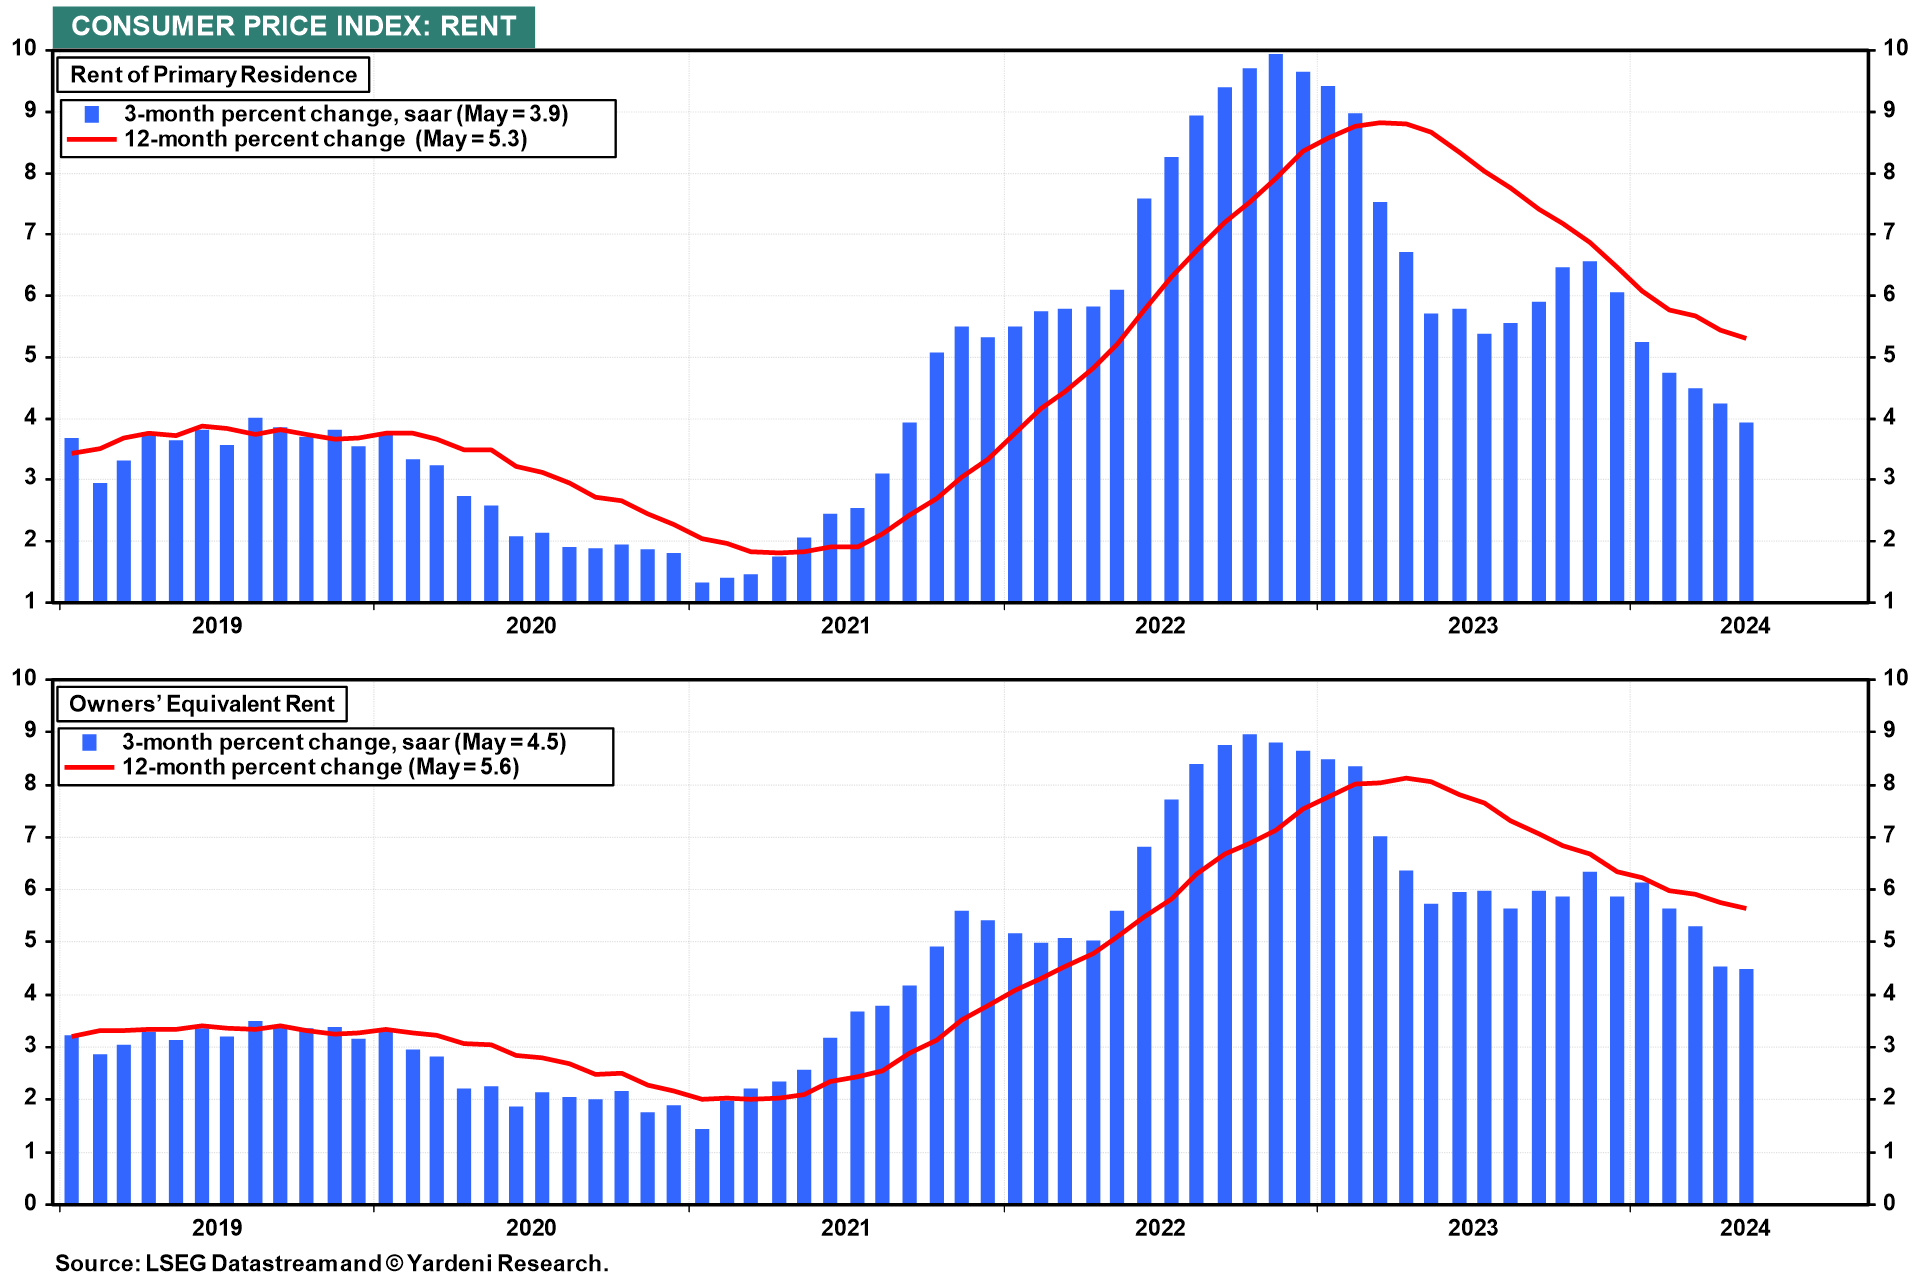
(1) Rent inflation. Rent inflation continued to moderate through May in the CPI (chart). It should do the same in May's PCED report on Friday.
… And from Global Wall Street inbox TO the WWW,
ABNAmro: US - High inflation is good for Trump | Insights newsletter (not sure I agree with this message … but…it’s not mine, and so …)
There is usually a slowdown in GDP growth in the quarters preceding elections, predominantly driven by slower private investment. After the election, the recovery is rapid, and partly accelerated by increased government expenditures. When inflation is high, the Republican candidate is more likely to win. Higher inflation implies the Federal Reserve is more often in a tightening cycle when a Republican enters the office, leading to amplification and lengthening of the growth slowdown and poorer stock market performance.
… Fed policy the main driver of post-election growth difference The median change in effective fed funds rate around elections shows no sign of systematic hiking or easing around elections. The shaded region shows that, in any given cycle, while rates have come up and down before elections, they’ve very rarely come down following elections (an easing cycle following this year’s election is likely to change that). Moreover, there is a clear difference in policy around Republican and Democrat victories. The typical Republican victory occurred in the midst of a hiking cycle, with rates being lower before the election and higher after. Importantly, this overall trend is driven by the cycles where the incumbent president was a Democrat, who therefore faced the initial tightening. The typical Democrat victory occurred in a more stable period where rates may have come down recently, but then stay steady afterwards.
Looking at annualized monthly core PCE inflation around elections, the hiking cycles around Republican victories are evidently warranted, as the average level of core PCE inflation has been substantially above the level around a Democrat victory, and indeed above the target rate of 2%. While we present no evidence of causality, all but one Republican win occurred in a period where inflation was above target. Indeed, of the 7 out of 10 elections since 1960 when core PCE inflation was above target were Republican victories, versus 1 out of 6 in elections where inflation was below target. Polls tend to show voters trust Republicans more with the economy, potentially offering an explanation for this correlation. The current elevated level is therefore seemingly an advantage for Trump.
The higher level of inflation when a Republican enters office has a significant impact on the direct comparison of economic outcomes under the two parties’ rule. Indeed, the hiking cycle that is typical under a Republican president is also the likely driver of the slower post-election recovery in GDP growth. While we see no impact on the unemployment rate, we do observe a large difference in stock market performance, with an average annual return of over 13% in the two years around a Democrat victory, compared to less than 5% around a Republican victory. A large part of the outperformance after a Democrat presidency is probably explained by the difference in Fed policy.
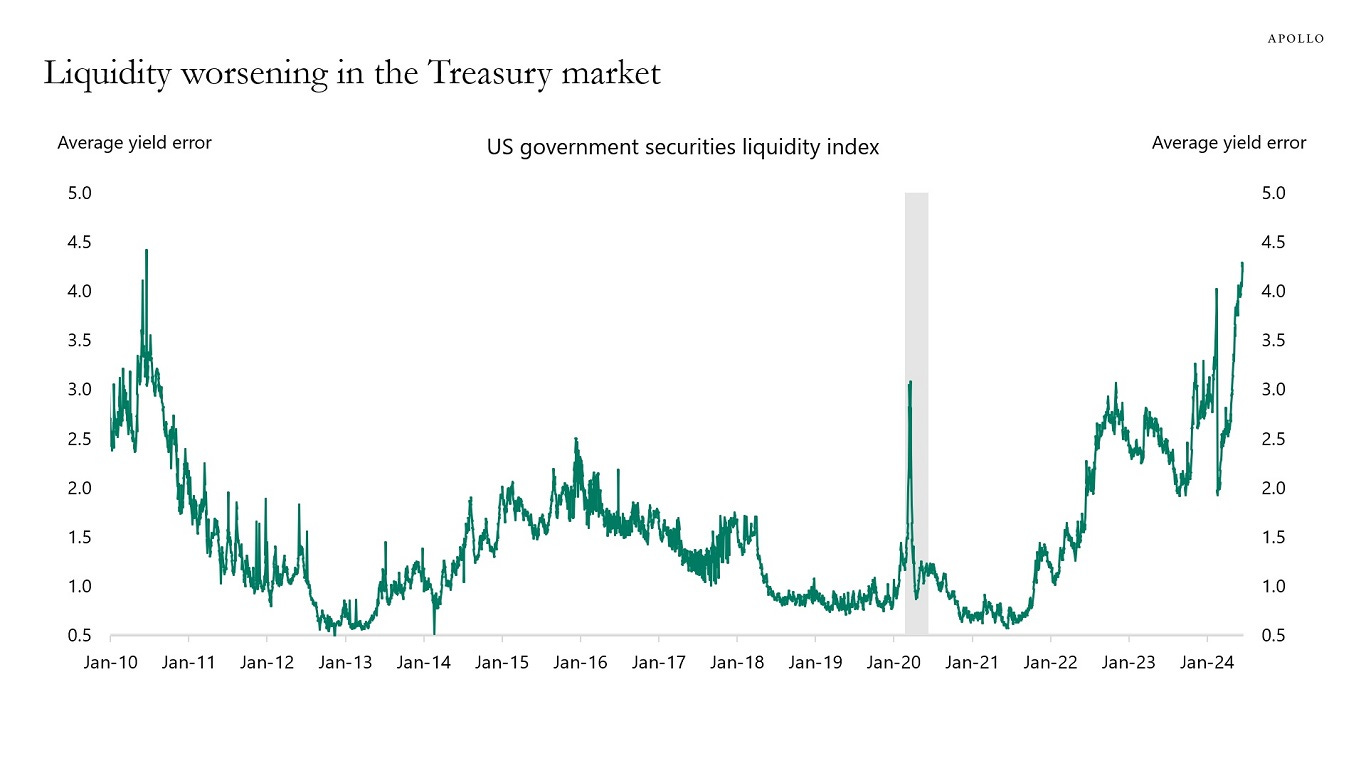
Apollo: Liquidity Deteriorating in Treasury Markets (ruh roh RelRoy)
Measures of liquidity in Treasury markets continue to send worrying signals, with the average yield error approaching 4.5, see chart below.
Something bad is happening in the US Treasury market. This is Bloomberg's liquidity index, which rises with the number of kinks in the yield curve. Those kinks point to poor liquidity. We now have more of those than in March 2020 when COVID hit. US fiscal space is NOT infinite...
It fascinates me how people continue to dismiss today's inflationary forces as potentially being a structural issue. Having been born and raised in an emerging market, I find these signs unmistakable. As shown in the chart below, the past cyclical increases in consumer prices over the last few decades were nothing like what we are experiencing today. Inflation remains deeply entrenched in the US economy, and unlike the aftermath of the GFC, the current fiscal imbalance combined with another re-acceleration of the money supply will only intensify the pressure on consumer prices.
Yahoo: The inflation upside that Americans are ignoring: their wages
… When inflation goes up, so does wage growth and vice versa.
The economists found that this relationship was particularly strong in 2021 and 2022 when both measures spiked.
(Credit: Federal Reserve Bank of Boston)
While supply chain issues turbocharged inflation, there was also quite a labor force disruption at the same time…
ING: Sweden’s Riksbank doubles down on future rate cut guidance
Even as the Federal Reserve and European Central Bank remain cautious on the timing of future easing, the combination of higher interest rate sensitivity and a more predictable path to lower wage growth makes an easier case for the Riksbank to keep cutting rates. We retain a neutral/slightly bearish outlook on EUR/SEK this summer


")