… Both the stagnation of demand and worsening outlook were widely blamed on the rising cost of living, tighter financial conditions and concerns over energy and supply chains linked to the Ukraine war and ongoing pandemic disruptions …
Perhaps that string of UP days in stocks related TO … bonds?
Some relief? Relief ≠ cause for celebration … not just yet. Not in bonds and certainly not yet in stocks … Read Yahoo Morning Brief
… Declines of 45% and 51% from record highs were met with rallies of 18% and 24% in the fall of 2008, moves that came several months before the market's ultimate bottom in March 2009.
Suddenly, headlines were reading: "Stock market 20% off the lows," enticing traumatized investors to possibly pull the trigger on what remained of their cash position — only to see new lows in the coming weeks and months.
… And the demand for dollars is suddenly soaring...the cross-ccy basis swaps signal dollar liquidity is drying up..
So, whether or not we get a bear market rally short-squeeze here, the global financial system is 'stressed'.
… here is a snapshot OF USTs as of 720a:
… HEREis what another shop says be behind the price action, you know,
WHILE YOU SLEPT Treasuries are higher with the belly outperforming as German bunds sharply outperform Treasuries and Gilts (see attachments) after the weaker-than-expected Eurozone composite PMI print. DXY is higher (+0.4%) while front WTI futures are modestly lower. Asian stocks were generally mixed but Chinese shares did well (SHCOMP +1.6%), EU and UK share markets are mixed and ES futures are showing +0.8% here at 7:25am. Our overnight US rates flows saw early Asian buying in 10's before front end (TU's- estimated at $1mln/01 in total) block sales took yields back to NY closes. In London, Asian real$ sold 20's-30's into the uptick alongside fast$ selling in intermediates. Overnight Treasury volume was roughly 150% of average- so pretty solid overall.
… UST 30yrs, daily: Going to the other side of the curve, Tsy 30yrs also show bullish tactical momentum now (lower panel) with bonds also testing its bear trend in place since early March this year. Take the bear trend out with a close (3.181% today- roughly the overnight "high") and the door opens for a re-visit to 2%-handles again. We see support emerge near 2.94%, as illustrated.
… and for some MORE of the news you can use » IGMs Press Picks for today (23 June) to help weed thru the noise (some of which can be found over here at Finviz).
And we’ve reached that part of the programming where I’m going to rip through a few items from Global Wall St inbox and in much shorter form than normal given Thing 2s graduation from high school in just a few hours.
Along with ALL the FOMC recapping you’ve already seen,
… We argue that in an environment of high inflation, markets will expect policymakers to put relatively less weight on uncertain estimates of the output gap (or expect that they will tolerate some increase in the unemployment rate). Moreover, if consensus expectations for inflation remain skewed to the upside, markets may struggle to price very low mean outcomes for the funds rate. Therefore, in a US recession, we argue that markets will price a higher probability on funds rate outcomes around 1-2% in late-2024 and a lower probability on funds rate outcomes around 4-5% …
The same firm writes, separately of
Equity Corrections in Recessions … If the economy entered into a recession, it would look most like the early 1970s or the early 1990s recession in terms of the macro environment—with moderately high inflation, some macro equity overvaluation, no significant private sector imbalances at the start of recession and a modest increase in the unemployment rate on our forecasts. But while the equity correction in the 1969-1970 recession was almost twice the size of the 1990-1991 recession, it is difficult to see a strong relationship between these macro variables and the size of the correction.
The simple conclusion from our earlier work valuing equities as a macro asset is that the deeper the growth slowdown and the more persistent the inflation profile proves to be, the larger the risk to equity returns. Our analysis overall suggests that it may be easier to define the point at which equity markets could trough—at or close to the point at which the Fed shifts away from its current tightening—than to be confident about how far equities will have fallen when that point is reached.
UBSs Paul Donovan asks, How fast is the economy slowing? … With real wages at record lows, inflation is not driven by wage costs. Strong demand gives companies’ pricing power, allowing profits to drive inflation. Consumers offset negative real wage growth with lower savings rates or higher borrowing. Central banks do not need to lower wage pressures; they need to moderate demand. Demand may react more quickly than wages to policy tightening (per the US housing slowdown). That increases policy error risks, and the Fed has already made policy errors.
The 10yr US/Germany recently broke below key support at 158bps, against our expectations, which nonetheless suggests further tightening, especially as the breakdown has been reinforced by an acceleration in short and medium-term momentum. We look for a move to next support at 141.5bps, then the “neckline” to the 2020 base and 78.6% retracement of the 2021/22 widening at 124.5/24bps.
You’ll also note the firms bearish bias 5yy was neutralized following break below s/t resistance (3.265%) and they’d sell again into further rally (3.055). They’d turn tactically BEARISH 10yy @ 3.015. Finally they’ve neutralised succesful bearish bias 30yy and intend to stay on sidelines.
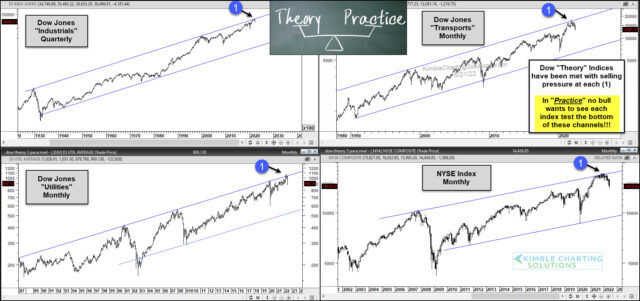
In as far as something stock jockeys MIGHT be looking at, Dow Theory
Kimble: Dow Theory Indices All Declining From Trend Resistance!
… Clearly, these Dow Theory Indices are each struggling at long-term resistance. In practice, No bull investor wants to see each index test the bottom of these channels. That would be really ugly. Stay tuned!
Finally, one more chart — pictures are worth a thousand words, right? From BBG
Growing fears of a US recession should come to the rescue of a battered and bruised Treasury market. Citigroup's US surprise index -- a gauge of whether economic data beats or falls short of analyst expectations -- has fallen to the lowest since May 2020 and has been in negative territory for a month. And the copper-gold index -- a good gauge of sentiment on the global economy -- has fallen to the lowest in over a year. That's a measure that traditionally has a close relationship with benchmark Treasury yields, suggesting they too may soon roll over. Even Fed Chair Jerome Powell is turning gloomy, giving his most explicit acknowledgment yet that aggressive rate hikes could tip the US economy into recession. Concrete signs of a slowdown could quickly shift the narrative in favor of bonds as would a worsening slide in commodity prices as a signal that inflationary pressures are easing.