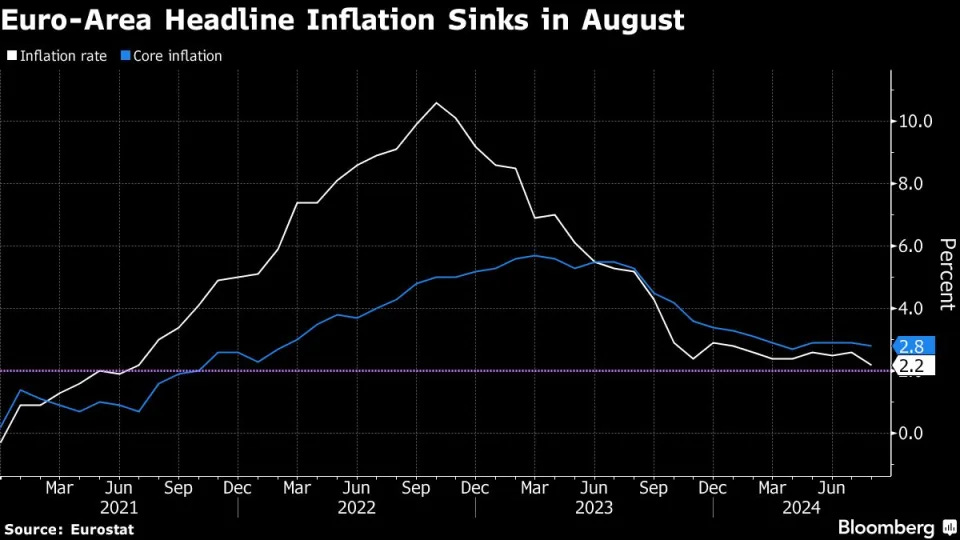
The drop in eurozone inflation from 2.6 to 2.2% was mainly because of energy inflation but does confirm the view that the inflation environment is slowly getting more benign. The ECB has arrived on a long home straight when it comes to bringing inflation back to target
NORDEA Euro-area flash inflation: Closer to target
Headline inflation dropped to 2.2% y/y in August – the closest it has been to the ECB’s inflation target since 2021 – but risks remain: Wage growth remains high and will keep core inflation sticky for the rest of this year.
As the day begins and the week and month come to a close, a few words from Mayor Mike & team showing the power of JPOW and gives a sense of how Team Rate CUT(s) are setting up for the end of the year …
Bloomberg: Treasuries on Track for Best Rally Since 2021 Ahead of Rate Cuts
US bonds returned 1.7% through Aug. 28, advancing since April
Inflation and labor market data are key to the winning streak
US bonds are poised for their best run in three years as traders brace for the Federal Reserve to cut interest rates for the first time since 2020.
Treasuries have returned 1.7% this month through Aug. 28, on pace for a fourth straight monthly gain, according to the Bloomberg US Treasury Total Return Index. The gauge has been rallying since the end of April as investors grew more confident in the case for lower US borrowing costs, extending its gain for the year to 3%.
After suffering steep losses earlier this year, bonds have roared back as recent signs of cooling inflation and job growth eased the path for the Fed to lower rates from the highest level in more than two decades…
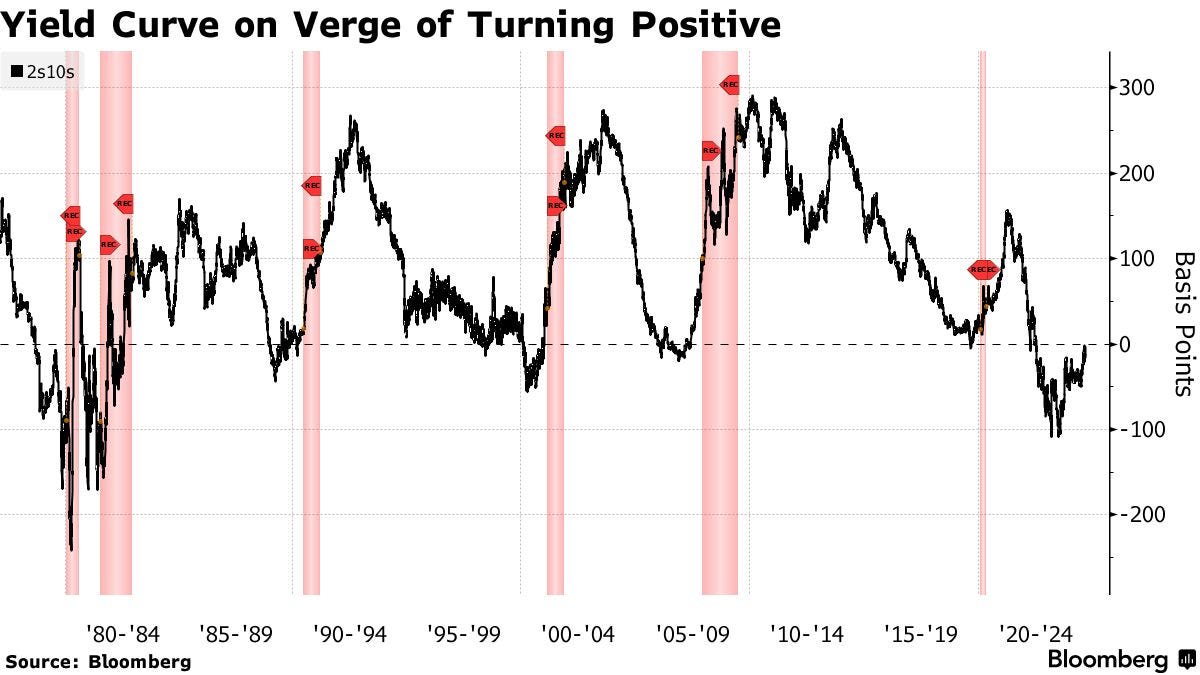
… Short-term notes, which are more sensitive to the Fed’s policy, outperformed this month, leaving a key part of the yield curve on the verge of turning positive for the first time since July 2022. At 3.9%, the two-year yield is less than 2 basis points higher than 10-year rates. The gap was more than 100 basis points in March 2023, marking the deepest inversion since 1981.
The winning streak has some concerned that the rally has come far enough. The risk now is that the labor market stabilizes from here, giving room for the Fed to ease monetary policy slower than what’s currently anticipated.
The run paused on Thursday after second quarter US GDP growth rate and weekly jobless claims pointed to a resilient economy, pushing Treasuries lower and yields higher.
“It’s amazing to me just how much sentiment has shifted,” said Meghan Swiber, a US rates strategist at Bank of America Corp. But the data so far hasn’t fully justified “the narrative that the Fed is going to deliver very swift, aggressive cuts this year,” she said.
The month will end with the release of a measure of inflation that is closely followed by the Fed on Friday. But the key read on the economy and labor market will come at the end of next week with the August payroll data.
… Headline says BONDS ARE BACK but the devil is, as always, in the details of the story … I’ll have a look at some specific security charts over the weekend, ‘weather’ and TIME permitting but in as far as YESTERDAY goes AND ‘bout that supply
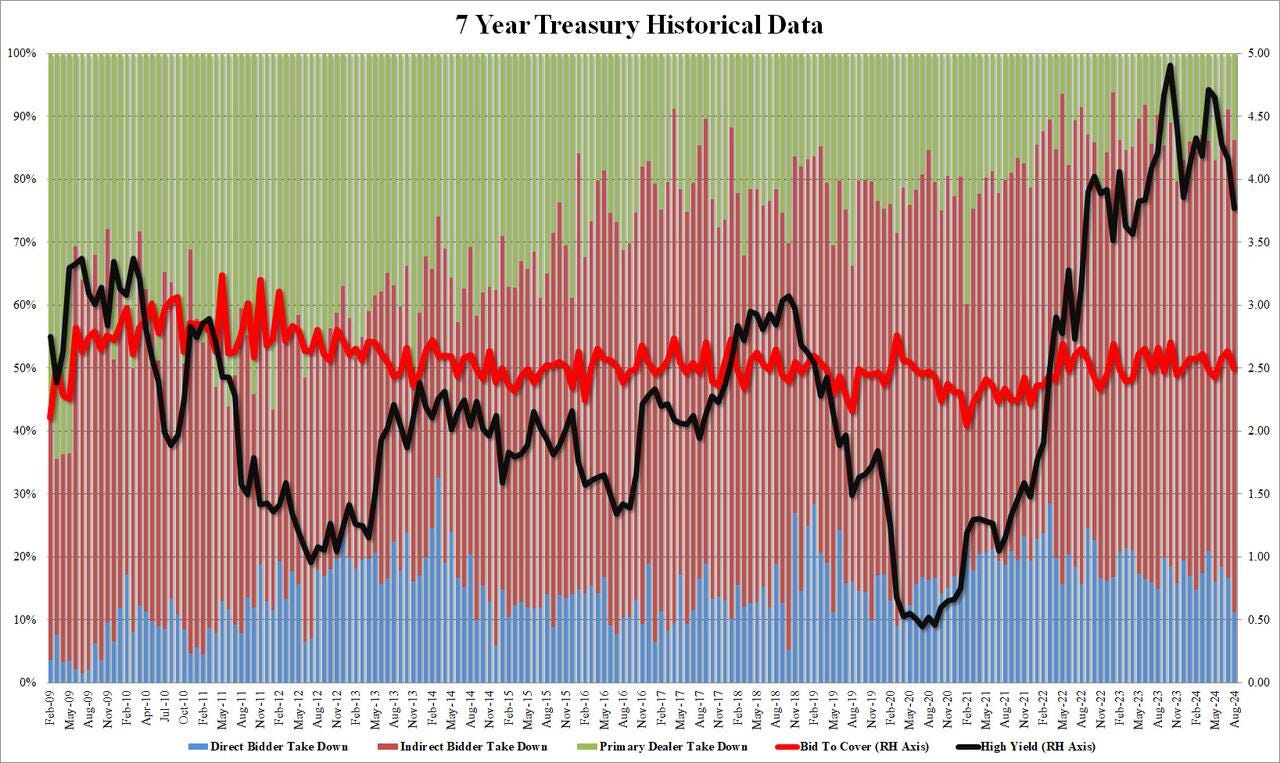
ZH: Subpar 7Y Auction Tails As Direct Bidders Tumble To Lowest Since March 2020
… The internals were more impressive, with Indirects taking down 75.1%, above last month's 74.4%, and also above the recent average of 69.22%. But while Indirects rose, the Direct takedown tumbled to just 11.2% from 16.8% last month, and the lowest since March 2020. That means that Dealers were left with 13.7%, up from 8.9% last month and in line with the recent average of 13.4%.
… Oki dokie. 1 outta 3 ain’t bad? In as far as that was then goes, and the inputs leading up TO the 1p bidding deadline, helping shape shift and inform the price action …
ZH: Initial Jobless Claims Drop Again As Labor Market Sends Mixed Signals ZH: Q2 GDP Unexpectedly Revised Higher On Bizarre Surge In Personal Consumption ZH: Dollar General Crashes Most On Record After Management Warns Of “Financially Constrained Core Customer” ZH: Goldman Says Five Below's Earnings Indicate "Core Customer Pressured & Is Reducing Discretionary Spending"
… Lots to chew on right there and the latter couple of bullets on consumers feeling the pinch certainly speak TO pick up in BONDS and the uninverting of the yield curve.
Finally, the year of the bull steepener is here after being touted for a long LONG while?? Maybe so but for now … here is a snapshot OF USTs as of 635a:
… and for some MORE of the news you might be able to use…
NEWSQUAWK: US Market Open: Equities gain whilst DXY & USTs hold flat ahead of US PCE; EZ-HICP cooled as expected, but Services rises … Bonds are incrementally firmer, Bunds climbed above 134.00 into the EZ-inflation metrics, but were unmoved by the release … USTs are flat ahead of monthly US PCE, afterwhich conditions will likely become thinner than normal on account of Monday's US market holiday. A few fleeting ticks higher on EGB-drivers, but not sufficient to merit a range of more than a couple of ticks; additionally, yields are pivoting the unchanged mark but with an incremental flattening bias.
Finviz (for everything else I might have overlooked …)
Moving from some of the news to some of THE VIEWS you might be able to use… here’s SOME of what Global Wall St is sayin’ … on GDP, the bigger they are the harder they’ll fall?? lets see whatever today’s ‘flation read brings (and if anyone ‘round to writeup for a weekend note) … For now …
BARCAP: Second Q2 GDP estimate revised higher on consumer spending
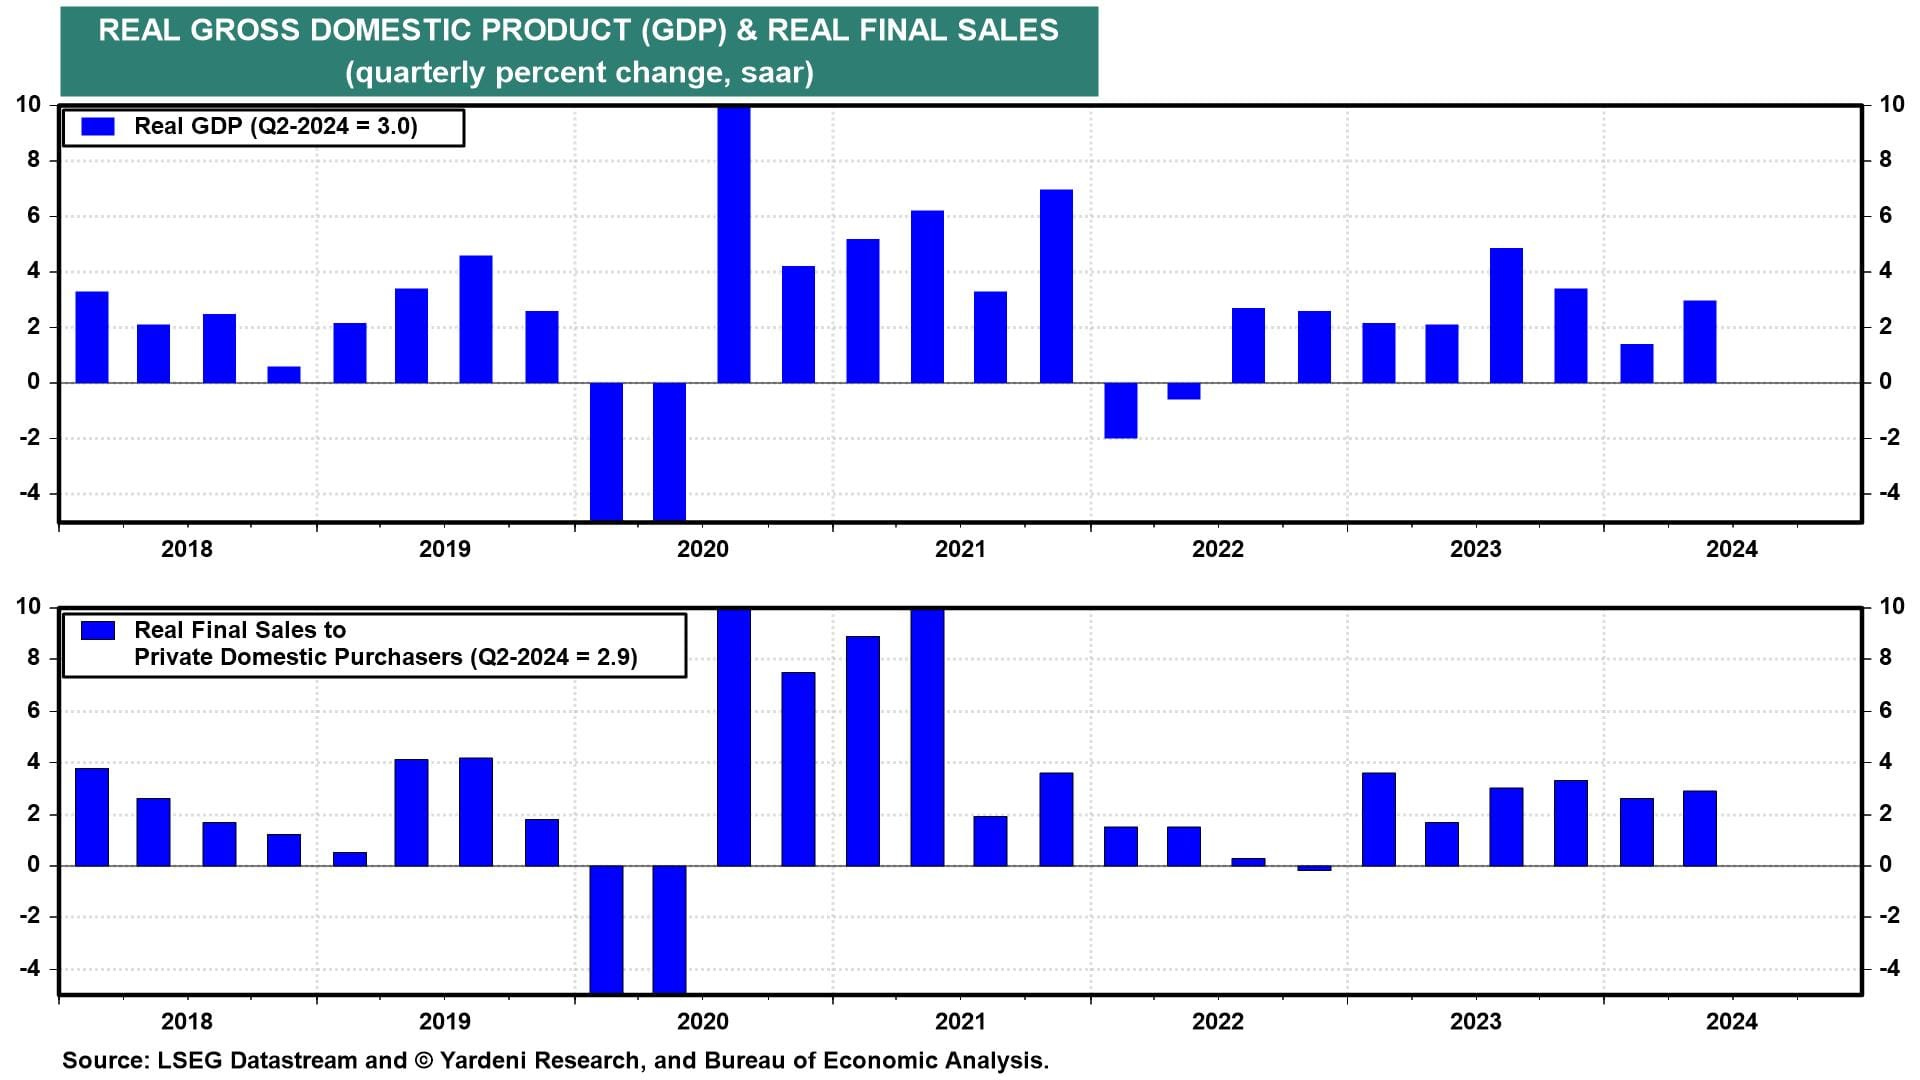
Upward revisions to PCE drove the 0.2pp upgrade from the initial GDP growth estimate, now placing Q2 GDP growth at 3.0% q/q saar. As with the initial estimates, the strength relative to Q1's 1.4% q/q saar reflects continually strong PDFP, despite some further compositional shift with today's revisions.
We expect a 175k increase in nonfarm payroll employment in August, faster than July's 114k gain, with average hourly earnings rising 0.3% m/m (3.7% y/y). On the household side, we look for the unemployment rate to edge down to 4.2%. In all, we expect the August report to clarify the role of weather effects in July.
July's unemployment rate hit levels that either trigger — or are very close to triggering — the Sahm Rule, an indicator with a good (but hardly perfect) record of identifying when a recession is underway. This "manual" discusses the rule's strengths and weaknesses, looking behind the hype to deliver much needed perspective.
Quick Start Guide
Congratulations on your decision to upgrade to the Sahm Rule, the gold standard for indicating that a recession is underway. It performs better than other indicators, such as inversions in the yield curve.
The rule says that a downturn is likely already underway if the 3mma of the unemployment rate surpasses its low over the preceding 12 months by at least 0.5pp. We walk through the latest monthly data, showing that the rule may or may not have been breached in July.
This 0.5pp threshold works from the intuition that, in recessions, the unemployment rate increases sharply alongside declines in overall activity. Given this, logic implies that there might be some "point of no return" when such sharp increases become inevitable. The threshold is determined by back-testing using available historical estimates from 1970-2018. By construction, it has a perfect record identifying recessions over that timespan.
Although the rule is accurate, optimal use requires careful interpretation and application. Multiple conditions will "void the warranty":
One is that conditions must resemble those seen during this historical sample over which the Sahm Rule was calculated. Our tests show that it is less accurate when applied to a longer history of available data, and when it is applied to estimates as they evolved in real time rather than revised estimates. It also may not work well if the unemployment rate is being boosted by noncyclical influences, such as labor supply shocks (especially if these boost the NAIRU) or measurement error.
Aftermarket modifications will also void the warranty. Risks of falsely identifying an active recession intensify when one uses a lower threshold than the recommended 0.5pp: Being "close" to this threshold is not the same as surpassing it. Our historical analysis identifies a number of close calls and false positives, demonstrating that a recession is not inevitable following significant increases in the unemployment rate.
The warranty is also voided if one applies the Sahm Rule in ways that go beyond its intended design. It should neither be mistaken as a leading indicator of a recession (it performs poorly at that) nor should it be applied as an indicator of the recession's duration (overruns are the norm).
…Core-PCE was revised lower to 2.8% in Q2 vs. 2.9% prior/expected. Real GDP was unexpectedly revised higher to 3.0% vs. 2.8% prior. Personal Consumption was revised sharply higher from 2.3% to 2.9%, in contrast to expectations for a modest downward revision to 2.2%. Household spending continues to drive the real economy. Advance trade was lower at -$102.7 bn in July vs. -$96.6 prior and -$97.8 bn anticipated. Wholesale Inventories matched forecasts at +0.3% MoM. Overall, the data reinforced the notion that employment is driving the macro narrative as the jobless claims print triggered the selling while the downward revision to core-PCE was easily dismissed.
The August payrolls report will define the size of the Fed’s widely expected September rate cut. While our base case is 25bp, the absence of a rebound in job growth and another increase in the unemployment rate would likely warrant a 50bp move.
We estimate payrolls will rise by 175k, rebounding from July’s weak 114k print. Despite the BLS explicitly stating there was “no discernible effect” from Hurricane Beryl in July, we do see traces of the impact in the details and expect an August reversal.
The July increase in the unemployment rate was mainly driven by temporary layoffs (another possible sign of weather impact). A reversal in August would push the unemployment rate down to 4.2% from 4.3% prior.
ING Rates Spark: Another 0.2% and the rate cut story is intact
US PCE is the key for Friday. Once that's in, and okay, then it's Labor day weekend for the US. German and Spanish inflation showed a downside surprise, helping the front end of the Bund curve lower. Friday's eurozone inflation and unemployment numbers could shine light on whether market pricing for an October ECB cut is justified
MS: Cross-Asset Brief - Will We See a 50bp Cut from the Fed in September? Key Debates in Under 5 Minutes – August 2024
1) Will we see a 25bp or 50bp cut from the Fed in September? We forecast 25bp
The July payrolls were weak, stoking fears that the labor market may be slowing faster than anticipated, but unemployment insurance and state-level data confirm a sizeable hurricane effect. All these mean the data are not as soft as investors interpret them to be, warranting 'just' a 25bp cut. But Powell stated at Jackson Hole that the Fed does "not seek or welcome further cooling in labor market conditions," which suggests that the skew of outcomes is towards more, rather than less, easing. However, a substantially weaker job market – with nonfarm payrolls at a ~100k run rate – would mean bigger or more cuts.
Disinflation data continues today. The US July personal consumer expenditure deflator is expected to show fairly stable inflation rates. It is worth remembering that if inflation falls because of owners’ equivalent rent, this does not change the spending power of any US household (as OER is a fiction).
On the spending side, yesterday’s revisions to second-quarter GDP boosted the role of the consumer noticeably. Middle-income households continue to spend, even as lower-income households are constrained. Economic data is plutocratic not democratic, and in an election year that difference (and the differences between consumers’ perceptions and reality) is important to keep in mind.
Japan is defying the disinflation trend, with a rise in August Tokyo consumer price inflation. This was mainly about food and fuel prices (using the conventional global core measure, inflation rose less than 0.1 percentage point). The July unemployment rate rose unexpectedly and is back at early 2022 levels…
Wells Fargo: Faster Consumer Spending Lifts Q2 GDP Growth to 3.0%
Summary Consumer spending propelled the economy to a 3.0% annualized growth rate in Q2, an upward revision that exceeded expectations. A rebound in profits growth recouped all the prior quarter's decline and then some to restore profits to a record high.
… On a year-ago basis, profits bounced 8.0%, which is the fastest pace since the end of 2022 (chart). While a slower pace of hiring signals some hesitation among businesses to take on additional help, continued consumer resilience, even as households are growing a bit more choosy in their purchases, is boosting profitability and allowed for continued growth through the first half of the year.
Yardeni: US Economy Still Flying High (so, no rate cuts?)
Today was a Roaring 2020s kind of day. The DJIA jumped to yet another record high. Stock prices rose even as Nvidia dipped after beating quarterly earnings expectations (which were widely expected to beat expectations). Once again: No recession in today's economic indicators.
For the past couple of years, many economists (and Jamie Dimon) have predicted that the consumer would soon be "tapped out" after exhausting pandemic-period "excess savings." A robust jobs market, rising real wages, increased productivity, and record corporate profits and cash flow suggest the bull market has room to run. Consider:
(1) Real GDP growth was revised from 2.8% q/q (saar) to 3.0% in Q2. Real final sales to private domestic purchasers increased from 2.6% to 2.9% (chart). In his July presser, Fed Chair Jerome Powell described it as "private domestic final purchases, or PDFP—which excludes inventory investment, government spending, and net exports and usually sends a clearer signal of underlying demand." It is sending a strong signal currently.
Consumer spending was revised from 2.3% to 2.9%, in part due to less personal saving. That makes sense considering stock prices, home prices, and interest income continue to boost wealth and income. Inflation was a touch lower than initially estimated, with Q2's PCED lowered from 2.6% to 2.5% y/y.
(2) Unemployment claims. The labor market continues to normalize. Initial jobless claims fell to 231,000 for the week ended August 24 (chart). Continuing claims rose slightly to 1.868 million.
… Throughout August, US Treasury yields have declined across the curve, but the short end has seen the steepest declines. After starting the month at 4.26%, the 2-year US Treasury yield has declined 40 basis points to 3.86%, while the 10-yield has dropped just 20 basis points, falling from 4.03% to 3.83%.
Given the steeper declines at the short end of the curve, the spread between the two yields has narrowed considerably and is close to flipping positive from inversion (negative spread). It got close earlier this month during the heightened volatility when the yen carry trade was being unwound, but this would be the closest it has gotten to a positively sloped curve in a ‘normal’ market environment since mid-2022.
At 540 trading days, the current streak of inversion between the 10-year and 2-year yields is easily the longest on record, easily surpassing the prior record of 419 days back in the early 1980s. As the chart below also shows, following prior periods when the yield curve ended an extended period of inversion (>100 days), recessions usually weren’t far off on the horizon. Bulls are hoping that this time is different and will prove to be the exception, and if this morning's economic data is any indication, they could be proven right.
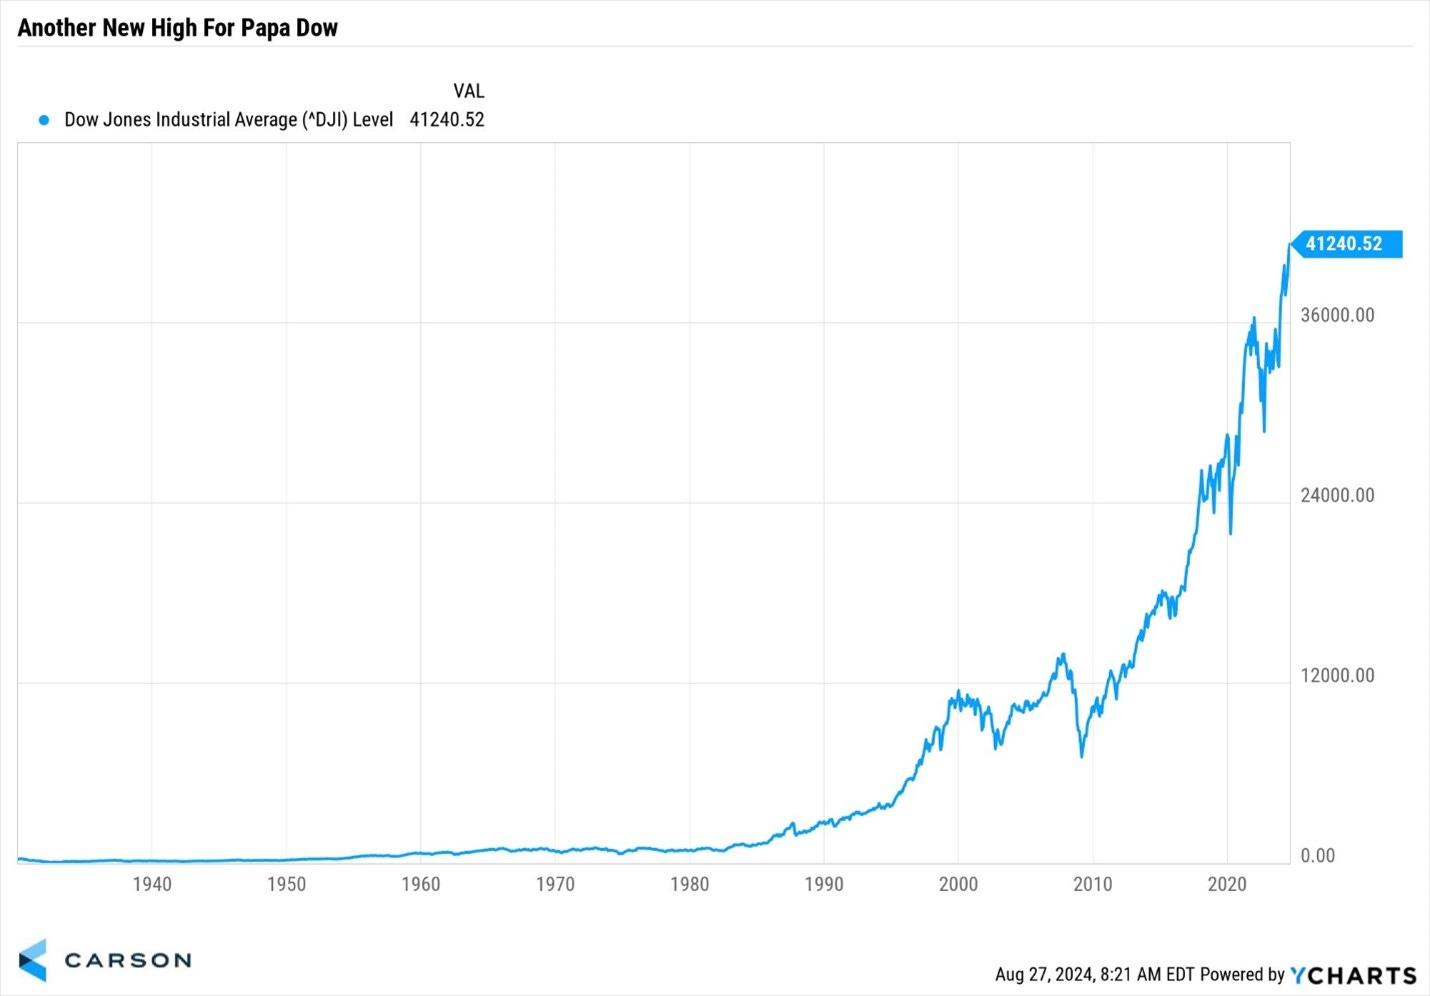
CARSON: The Best Indicator for the Economy Just Hit a New High
“Why did God create economists? To make weather forecasters look good.” -Old economist joke
Two things to think about today.
1.) Since the Great Financial Crisis (GFC) ended 15 years ago our economy has been in a recession only 1.1% of the time. 2.) The Dow Jones Industrial Average started trading on May 26, 1896, and on Monday AND Tuesday this week it closed at the highest level EVER.
Think about how many endless discussions have focused on the ‘coming soon recession’ only for stocks to continue to soar…
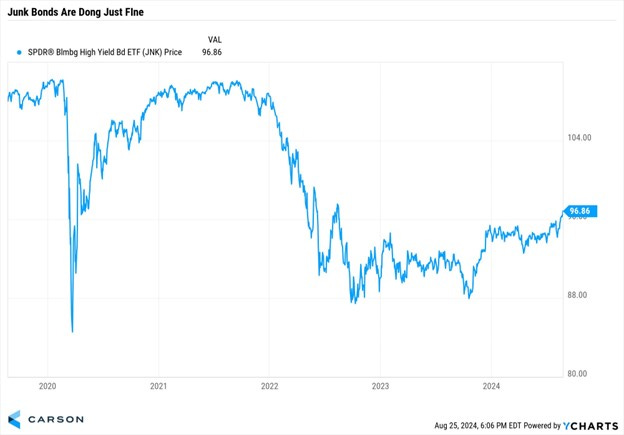
… Lastly, the action in junk bonds (also called high-yield bonds) continues to suggest a risk-on appetite, as they are near their highest level in two years. If things were as bad as they keep telling us, you’d think some of the riskiest assets (companies that might not pay you back) would be weaker. Well, they aren’t. I learned a long time ago that if credit markets were confident, then I should be confident. This is another sign this bull market is alive and well.
LPL: What Does a Rate Cut Mean for Stocks and Bonds?
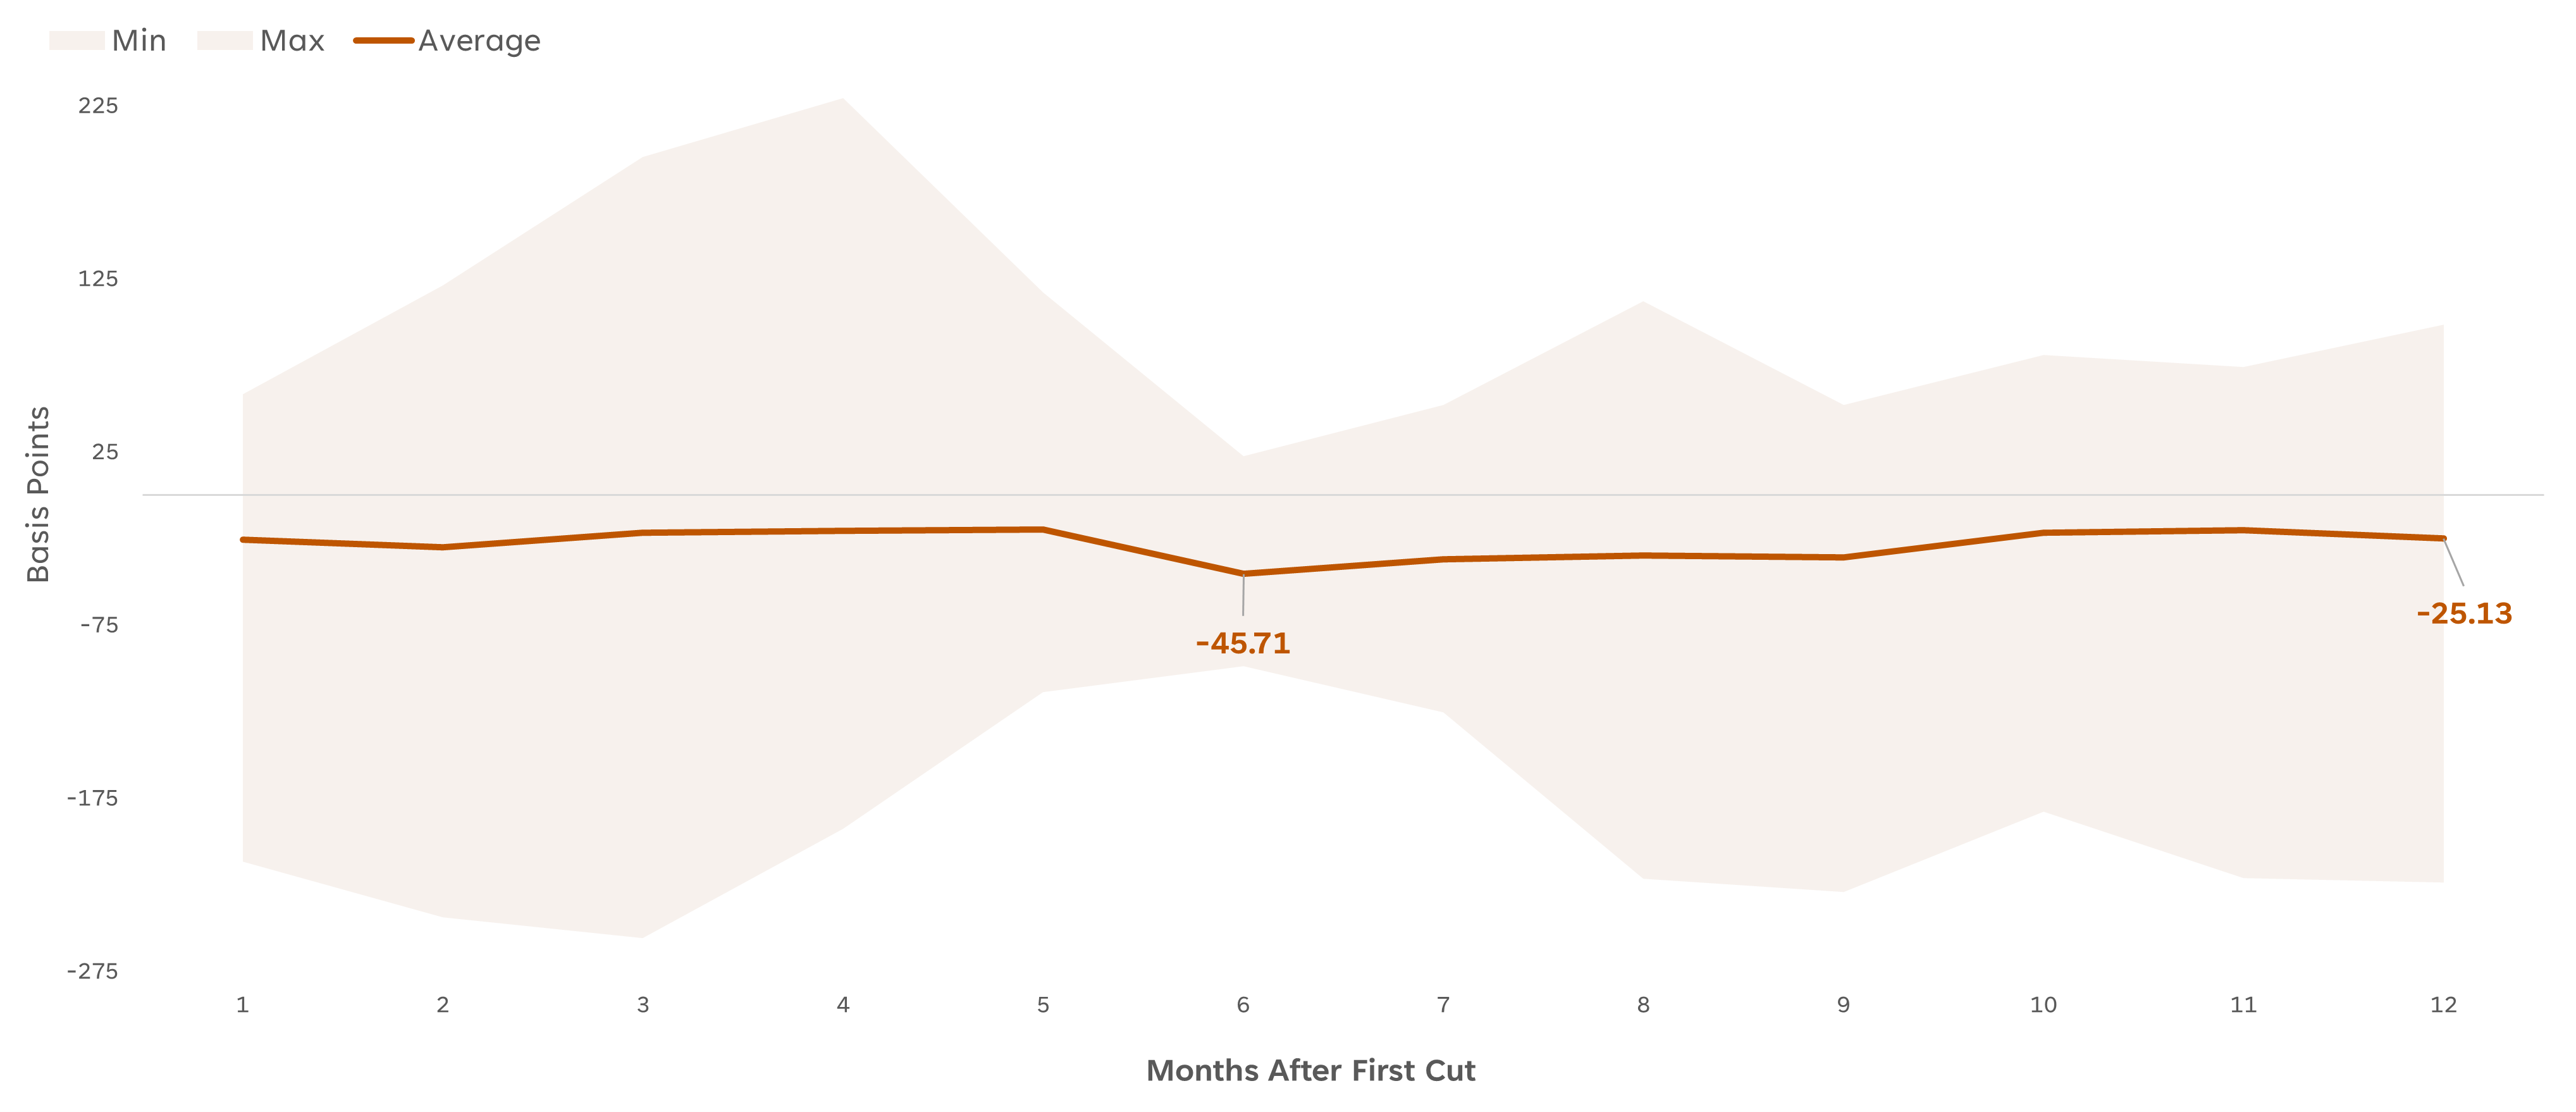
…What About Bonds? Using the same rate-cutting periods from above, we also analyzed how 10-year Treasury yields historically progress after the Fed starts cutting rates. As highlighted below, yields tend to decline over the following 12 months, falling by an average of around 25 basis points (bps). The lows for the 10-year occurred at the six-month mark, where the average decline reached 46 bps, with eight of nine periods posting lower yields, marking the lowest positivity rate across the 12-month time frame.
Progression of 10-year Treasury Yields After First Cut
NORDEA: Macro & Markets: Was it all about Beryl? (great chart .. so, ‘bout that 50…)
Hurrican Beryl, which swept through Texas on July 8th might have been the main reason the July employment numbers looked so bad. We expect a rebound in next week's data will remove some of the recession fears.
Hurricane Beryl appears to have depressed the July employment data by a significant amount. Texas experienced floods and massive power outages which depressed economic activity and left workers unable to do their jobs. In fact, BLS estimates that more than 450K were unable to work and more than 1 million had to work part time because of bad weather, 7-8 times the normal for July. The Hurricanes in September or October of 2016, -17 and -18 saw a comparable jump in this statistic. We also observed close to a 100K slump in the payrolls numbers for those same months, only for payrolls to recover the month after. It would be strange if Beryl did not have the same effect when people returned to work in August. Jobless claims for Texas more than doubled from July 1st over the next two weeks, just at the right time to impact both the establishment and the household survey. Those claims have since fallen back to the pre-Beryl level.
…A record number of workers were impacted by bad weather this July, either by not being able to work or forced to work part time
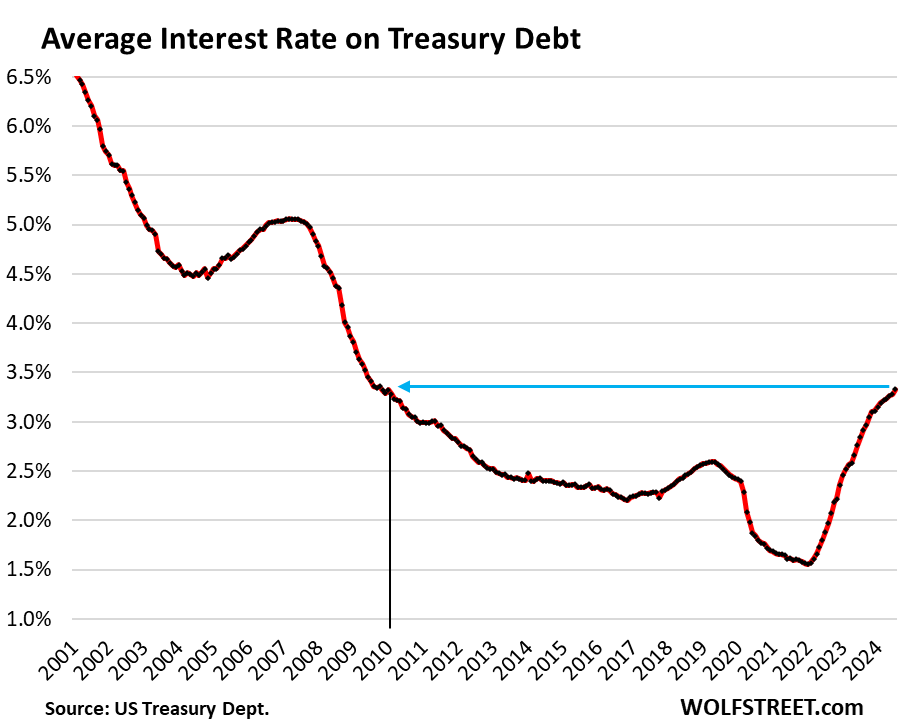
WolfST: Spiking Interest Payments on the Ballooning US Government Debt v. Tax Receipts, GDP, and Inflation: Q2 Update
Burden of the national debt: The portion of tax receipts swallowed by interest payments.
AND … THAT is all for now. Off to the day job, hope to have time (and inspiration) to write up and send / spam something out over LONG weekend…


Excellent work!!!
I guess the Salm rule proves nothing
works 100% of the time.
But I do like it.
I like that PDFP number.
Getting to Core Final Sales, very good.
Somewhere, J.Powell is smiling.
Love the Economist/Weatherman joke!!!
With all the economists tracking the US economy, there is still an incrediblely
wide variance in short term forecasts.
I have followed Ed Yardeni for years.
But even Jim Bianco, who I respect had
been calling for a return to 5+% yields, not
2 or 3 months ago.
Economic forecasting ain't easy.
Measurement error is certainly part of it.
Well, it's still before the election, so I
look for the BLS to continue to play games with the Birth/Death calculation for the benefit of the Ruling Party.
And I agree that the hurricane effects
will be reversed.
Kamala will be jumping for JOY.