while WE slept: bonds are 'flat/lower' ahead of CPI; "The Kuiper Belt.." (DB on 100yrs of BAA vs 3m TBILL yld); 'Bond Traders Built Bets on a Treasury Rally Each Day in July' -BBG
Good morning … With CPI and liquidity provisioning straight ahead, I SHOULD be brief (but I won’t, you know that) as it’s quite likely that by the time you read this, it will already be due for an overhaul … CPI will set the table for this afternoons auction and so …
30yy: triangulating RANGE with supp (4.60) and resis (4.46) well defined and not much of a signal from momentum …
BIG picture trend higher in rates, H1 channel BUT you can see a more pressing - INTERIM - DOWNTREND (green line) dating back to September of last year … HOPE springs eternal that inflation moderates (de / disinflation permeates and is everywhere, if you trust some …) and that would benefit longer end of the curve …
… and as Global Wall HOPES for whatever it deems to be the best possible print for CPI (good, bad or indifferent — whichever will INCREASE chances for a rate CUT and so, deliver updated / upgraded S&P targets — see Yardeni’s latest move just below), I’ll begin with a quick recap and follow with usual Global Wall linkApalooza.
First, how about the 10yr auction AND what happened yesterday …
ZH: Solid 10Y Auction Stops Though With Most Direct Bidders Since October
ZH: Stocks Panic-Bid Ahead Of CPI As Biden's Nomination Odds Re-Plunge
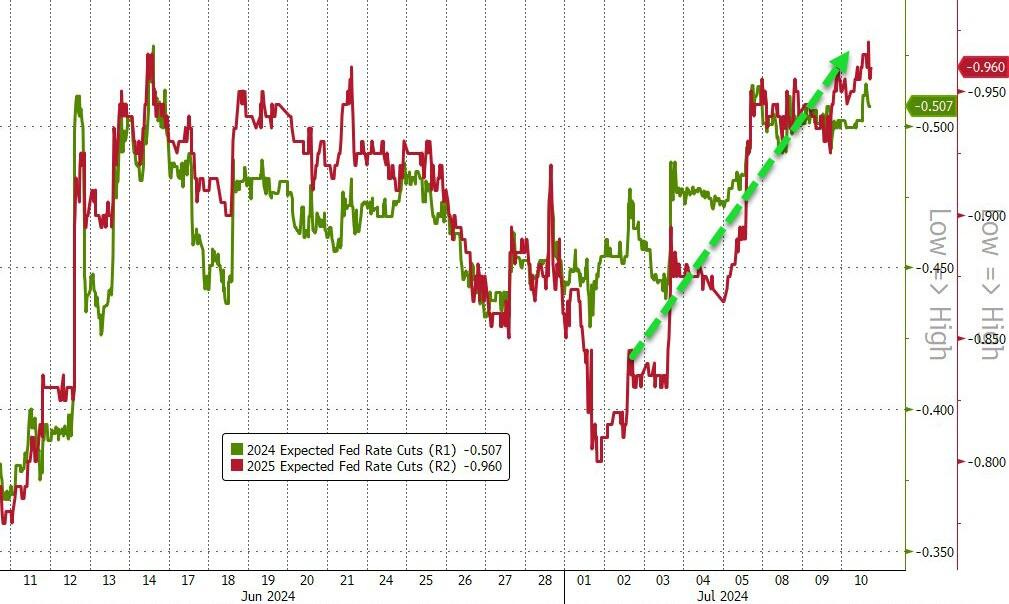
… Rate-cut expectations continue to rise as Powell said nothing hawkish... which is therefore dovish?
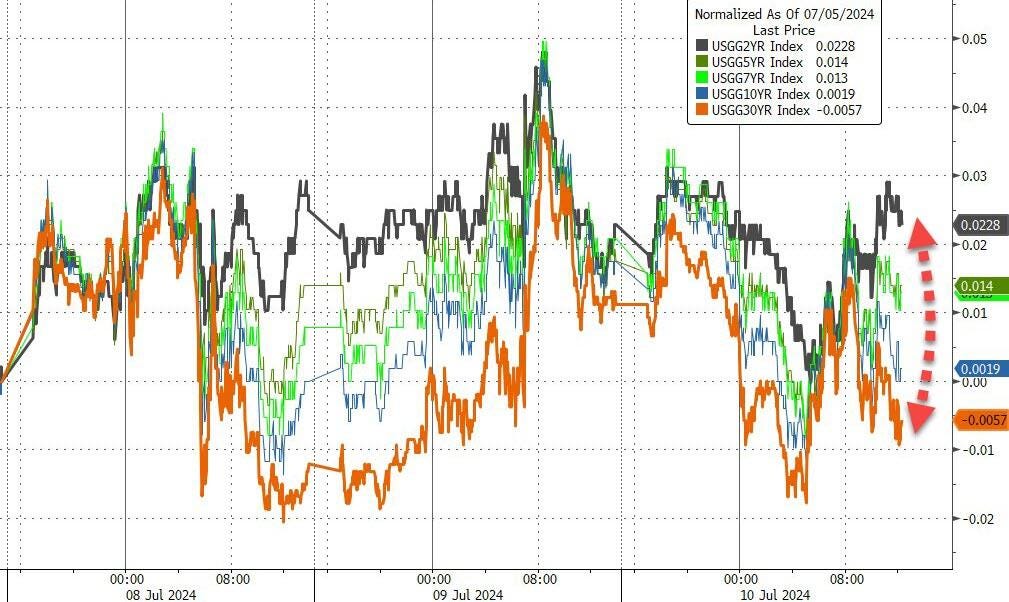
… Treasury yields are down very modestly on the day 1-2bps with a very modest long-end outperformance...
… and from THAT to what seems to be a pre-orchestrated CPI report, at least as far as those who WRITE for Bloomberg …
Bloomberg: US Inflation Data to Bolster Case for Fed Interest-Rate Cut in September
Core gauge seen posting smallest two-month rise since August
Rents, used cars and auto insurance are key items to watch
… The figures, to be published Thursday by the Bureau of Labor Statistics, will probably show a key gauge of prices excluding food and energy advanced just 0.2% in June for the second month in a row, according to the median estimate in a Bloomberg survey. The broader consumer price index is seen posting a smaller 0.1% increase, thanks in part to lower gas prices.
Bloomberg: Big Bet on Treasuries Needs Benign Inflation Data to Survive
Fed chief has said rate cuts are contingent on price pressures
Traders have been building up bullish wagers in bond market
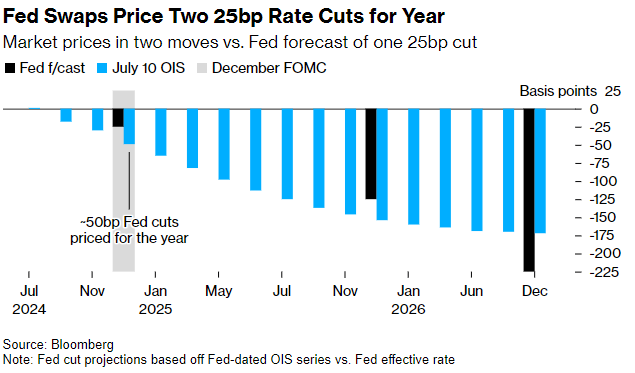
… Last month, soft May CPI data set off one of the biggest Treasury rallies of the year when it bolstered expectations for lower borrowing costs in 2024. Markets are pricing in two quarter-point Fed rate cuts this year, and roughly 60% odds of the first one at the Sept. 18 policy meeting.
“If the data comes in in-line or better than expectations, the certainty of September becomes even stronger,” said Nathan Thooft, a senior portfolio manager at Manulife Investment Management in Boston.
… and beyond today’s CPI and tomorrows PPI (input that is critical TO PCE), fact remains we’ll have couple more inflation AND jobs reports before September meeting.
Achieving lower inflation without a significant slowdown is ‘the No. 1 thing’ keeping the Fed chair up at night
… But when Powell returned to Capitol Hill this week, he began laying the groundwork for rate cuts on what could prove to be a stronger footing. He pointed to how a cooling labor market means a potential source of ongoing, high inflation has diminished. And he suggested that any further softening in the job market might be unnecessary and unwelcome.
… here is a snapshot OF USTs as of 627a:
… and for some MORE of the news you might be able to use…
NEWSQUAWK: US Market Open: European bourses advance, DXY slightly lower & USTs flat ahead of key US CPI; Fed's Bostic & Musalem due … Bonds are flat/lower, with Treasuries standing pat as focus remains on US CPI, Gilts marginally underperform … USTs are flat in a very narrow 3+ tick range ahead of US CPI. A data point that will be scrutinised to see if it favours a September cut; within Wednesday's 110-10 to 110-20 parameters, a hawkish CPI print could bring into play the WTD 110-07 base.
Finviz (for everything else I might have overlooked …)
Moving from some of the news to some of THE VIEWS you might be able to use… here’s SOME of what Global Wall St is sayin’ …
BARCAP: US elections: Fork in the road (YOGI … when you get to the fork in the road, TAKE IT)
We look at the implications of the upcoming US elections for the level of yields, the shape of the curve, interest rate volatility and swap spreads, highlighting the interaction between fiscal, monetary and bank regulatory policies. We believe rates markets are complacent and consensus views will likely be challenged.
Key takeaways
We believe rates investors will view the US election outcome through the lens of the monetary and fiscal policy implications. For the former, changes to trade and immigration policies, which can be enacted via executive action, will be key to watch. Hence, a unified government is not a prerequisite for major market moves and the presidential election outcome itself would matter greatly for rates markets, in our view.
We believe that inflationary and/or expansionary fiscal policies would likely lead to higher rates, with the shape of the curve dependent on which factor dominates. More of the former with less of the latter would result in a flatter curve. Vol markets suggest that there is complacency about the potential for widely different policies following the elections. While swap spreads have tightened significantly, the embedded deficit outlook still seems benign.
In a Republican sweep, investors would likely focus on the extension of Trump tax cuts, the risk of higher across-the-board tariffs, and tighter immigration policy. On balance, the resulting higher nominal growth expectation would likely lead to higher yields. The yield curve would move in parallel in this scenario, with the markets paring back the depth of the easing cycle as well. Long-end swap spreads would likely tighten the most and we think rate vol would rise across the surface.
In a Republican presidency with a divided Congress, investors would still likely be concerned about the inflationary effects of potentially higher tariffs and tighter immigration policy, but with less of a boost to growth from easier fiscal policy, as some tax cuts would likely expire. Short-term rates would likely rise, but long-term rates not so much. The yield curve would flatten, swap spreads would likely move sideways, and rate vol would rise somewhat.
In a Democratic presidency with a divided Congress, investors would likely expect limited deficit expansion. Trade and immigration policies would likely see minimal changes. This scenario is the most bullish for USTs, as the market would price out the risk of an inflationary shock and a significant deficit expansion in a Republican sweep. The yield curve would be somewhat steeper, swap spreads would widen the most, and rate vol would fall across the surface, in our view.
In a Democratic sweep, Biden's proposed FY25 budget suggests that fiscal policy could be deficit-neutral, but with significantly higher taxes and spending, increasing uncertainty about the net effect. This would still lead to a decline in yields, as the market would likely price out the risk of an inflationary shock and massive fiscal expansion. In this case, the yield curve would steepen, swap spreads would widen, but less so, as bank regulatory policy would come into focus, and vol would rise on Fed-sensitive parts of the surface…
We close our tactical SFRZ4Z5 flattener entered on 28 June at -90bp and take 6bp profit.
Lack of asymmetry, CPI forecast favors taking profits: Ahead of the June nonfarm payrolls report, we entered a SFRZ4Z5 flattener due to the historical asymmetry of the reaction to payrolls in the calendar spread evident over the past year (see US rates: Front-end asymmetry returns into payrolls, dated 28 June.) …
… Finally, front-end yields are trading at three-month lows and likely need continued softer economic data to justify current valuations or provide an impetus for a further rally (Figure 2). Therefore, we take profits on our tactical trade that has worked as intended…
Market fixings are currently pricing June CPI at 3.08% vs 3.1% consensus YoY, 3.10% consensus Index NSA and 3.13% DBecon. Assuming seasonal factors are the same as last year implies CPI fixings headline CPI SA at 0.05% MoM vs consensus 0.1% and 0.09% DBecon.
Given consensus distribution around headline and core CPI MoM (0.1% and 0.2% MoM), CPI fixings are likely positioned for a weak 0.2% MoM on core CPI. Using our economists' forecasts as well as our market-implied energy modelling also suggests markets have likely converged below 0.20% and somewhere in line with previous month (0.16% MoM).
Therefore, given also the May core CPI breakdown and subcomponents dynamics, we would focus on the following variables: OER & primary rents, motor vehicle insurance, used cars and airline fares (as also flagged by our economists).
Our analysis continue to point towards continued rent disinflation in the medium-term, with potentially some residual stickiness risks in the short-term, while our economists flagged OER downside risks related to May Northeastern spike. Downside risks on used cars (suggested by wholesale prices and seasonal factors) could offset potential payback from motor vehicle insurance (both could be worth ~5bps of downside/upside). Finally, fuel prices suggest another weak airline fares print is possible. Overall, risks appear balanced relative to market pricing a core CPI print similar to May.
Market-wise, we maintain our long 5y5y CPI. 10y CPI remains broadly fair relative to model-implied estimates, with upside risks to our fair-value stemming from shipping costs. 5s10s still trades too flat relative to the level of front-end BEI and macro data, while 5y5y CPI remains fundamentally low relative to measures of long-term inflation expectations and inflation uncertainty. As for tomorrow, evidence suggests surprises relative to CPI fixings pricing should not impact our recommended trade.
DB CoTD: The Kuiper Belt.. (interesting look at unprecedented times…)
… Looking at the impact of the inversion another way, today’s CoTD updated from our “Charts to make you go WOW!” pack (link here) shows 100 plus years of the yield gap between 30yr BBB yields and US 3m T-Bills. Although it’s nearly a year since the 2s10s and the 2s30s was at its most inverted, with both steepening c.80-90bps since, this long-dated credit vs T-Bill curve is much closer to its flattest of the cycle given the compression of spreads offsetting the government bond steepening.
In fact, prior to this cycle, only 1% of observations in 123 years have seen this curve as flat as it currently is. So you're being paid close to the smallest amount in history to take both credit and duration risk relative to cash kept in safe assets at the front end.
So how does this all usually end historically?
In short, a recession. However, in this cycle, pretty much the whole investment world now thinks this will slowly and benignly steepen via rates cuts and without a recession…
DB: Early Morning Reid - Macro Strategy (CPI important but also tomorrows PPI…)
… In terms of today, our US economists are expecting that both headline and core will be a bit firmer than last month, with headline at a monthly +0.09%, and core at +0.25%. In turn, that would push the year-on-year measure down to 3.1% for headline CPI, although the core CPI measure would tick up a tenth to 3.5%. When it comes to the Fed, it’ll also be worth keeping an eye on tomorrow’s PPI report as well, since several components in that feed into the PCE measure of inflation that they officially target. So over the next couple of days we’ll get a better idea of where that’s likely to land and if the Fed have the space to cut rates. Our US economists point out that the median forecast for core PCE in the June SEP was at +2.8% on a Q4/Q4 basis, so to achieve that we need to see monthly core PCE at an average pace of 20bps a month for the rest of the year. So for them, that’s the primary test for whether the Fed can cut earlier than their baseline, which sees a first cut in December. For more details on their CPI forecast and how to sign up for their subsequent webinar, click here.
UBS: Disinflationary details (could NOT disagree MORE with Paul here … JPOW himself redirected attention away FROM CPI and TO PCE … and yet … well …)
We have US June consumer price inflation data. Federal Reserve Chair Powell thinks this matters, because politicians think this matters, and Powell thinks politicians are important. Economists, who are actually important, tend to regard headline US consumer price data as a rather poor quality statistic.
The details offer insight. Excluding the fantasy owners’ equivalent rent gives a better idea of middle class US households’ spending power. Focusing on the real world, genuine service prices give some sense of cost pressures. Durable goods price deflation (prices are 5.3% below their highs) has been more pronounced. Regional data, showing almost every sector in deflation somewhere in the US, argues strongly against inflation stickiness…
Wells Fargo: Still Unstoppable? The U.S. Consumer in Five Charts
Summary Betting against the U.S. consumer has not been a winning strategy in recent years. Sustained spending has upended recession calls and kept up sufficient demand in the service sector to prevent prices there from falling quickly enough to justify rate cuts from the Federal Reserve. In five charts we highlight the top themes that will impact the macro consumer outlook in the second half of 2024 and beyond.
1. A Better Recession Gauge? The Discretion Rule In more than 60 years, there has never been a recession without real discretionary spending falling on a year-over-year basis. What about false positives? Turns out, they are rare. It has only happened twice, both were short trips across the zero lineand the most recent was more than 35 years ago in 1987 (the other was 1967). Household spending habits these days reveal a more choosey consumer as purchasing power fades. Real non-discretionary spending has outpaced discretionary purchases on trend in recent months, consistent with a moderation in broader consumption. Real discretionary spending growth has been awfully close to breaking through the zero line this year.
… 4. Hiding in Plain Sight: Clear Signs of Consumer Stress The financial situation of the household sector is still broadly healthy, but households are not in as strong of a position as they were previously and delinquencies have trended higher, particularly for credit card and auto loans. Notably, the still-relatively low level of mortgage delinquency provides some cushion for the broad household balance sheet today.
Yardeni: Meltup! (when the market moves, so too do the goalposts … another tgt being marked to market … value?)
We are raising our yearend target for the S&P 500 to 5800 from 5400. We are still targeting 8000 by the end of the decade. The stock market seems to be discounting our Roaring 2020s scenario faster than we expected. We've been among the most bullish investment strategists since November 2022, but not bullish enough. The bull market might continue to achieve our targets ahead of schedule.
… And from Global Wall Street inbox TO the WWW,
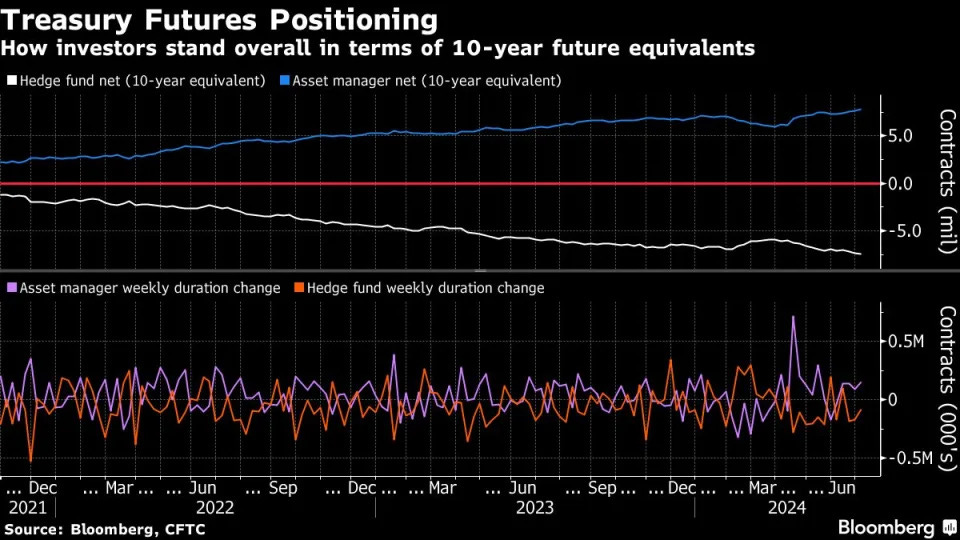
Bloomberg: Bond Traders Built Bets on a Treasury Rally Each Day in July
Build up in open interest signals traders added new long bets
JPMorgan survey shows bullish bets rising to most in two weeks
…Asset Managers Net Duration Long Builds Real money accounts continue to build out net duration longs in futures by adding an additional 156,000 10-year note futures equivalents in the week leading up to July 2, according to Commodity Futures Trading Commission data. Hedge funds extended net short position by roughly 87,000 10-year note futures equivalents. The biggest net positioning add among asset managers over the week was seen in 10-year and ultra 10-year note futures for a combined $10.7m/DV01 in risk.
Bloomberg: Here’s why the Dean of MMT says the deficit is out of control
It may come as a shock to those who have pilloried Modern Monetary Theory as an economic school of thought dedicated to government largesse and deficit spending. But Warren Mosler, the godfather of MMT, is making what would seem like unlikely common cause with fiscal hawks by arguing that the deficit is too large — with negative implications for inflation and bond yields, potentially for years to come.
The takeaway raises several issues, which I will dive into below:
This is good for savers but bad for private equity
MMT is not about jacking up deficit spending
Inflation is the result of real resources constraint
When does the next downturn downturn occur?
What happens in the next downturn and afterwards?
How to think about Treasuries in all of this
It’s unclear what the implications are for equities
… Still, investors cannot simply surrender to their entropic destiny. Time may be running out, but time is still money as the original saying goes. How can you make some?
Position for continued inflation: the end stage of a supernova credit explosion is likely to produce more inflation than growth, and more chances of inflation as opposed to deflation. In bonds, buy inflation protection via TIPS; shorten maturities and durations; don’t fight central banks and their sovereign treasuries; own short maturities; look as well for offshore sovereign bonds with positive real interest rates (Mexico and France for example).
Get used to slower real growth: QEs and zero-based interest rates have negative consequences because of the Fed’s tardy response.
Invest in global equities with stable cash flows that should provide historically lower but relatively attractive returns.
Transition from financial to real assets if possible at the margin: buy something you can sink your teeth into – gold, other commodities, anything that can’t be reproduced as fast as credit.
Be cognizant of property rights and confiscatory policies in all governments. Expect deficits in the U.S. of 5% of GDP or more.
Appreciate the supernova characterization of our current credit system. At some point it will transition to something else.
We may be running out of time, but time will always be money.
Signs of weakness in the US economy have been building in recent weeks and months. Last week was a case in point. The ISM manufacturing report was disappointing; Wednesday’s ADP employment and ISM services were both weaker than expected; and, while Friday’s payrolls beat expectations (by 16k), there were significant downward revisions in May (-54k) and April (-57k). Of note the unemployment rate for June ticked higher (by more than expected: 4.1% vs. consensus of 4.0%).
Linked to that, the US 10 year Treasury yield has been trending lower (i.e. making lower highs and lower lows since late April). Last Friday it closed below its 200 day moving average and at around its highs from 2022 (i.e. at 4.28%, see FIG 1). The key question, therefore, is: Will the evidence for a ‘soft patch’ in the US economy continue to build? Or is this theme mostly (if not fully) priced in? Put another way: How much more headroom is there in this bond market (i.e. for a rally in Treasury prices)?
From a models’ and positioning perspective, there’s potential for further upside in coming weeks. In particular, US Treasuries are not yet technically over-bought (albeit they are getting close, see FIG 2); measured sentiment readings are broadly mid-range; and net speculative positioning is NEUTRAL* (see FIG 3). All eyes, therefore, will be on this week’s US CPI June data release (due Thursday).
FIG 1: US 10 year Treasury yield (%) shown with 50 & 200 day moving averages
… FIG 3: 10 year USTs net speculative LONG/SHORT positions
PIMCO: Macro Signposts | 3 Macro Drivers of a Potentially Steeper Yield Curve
… The next monetary easing cycle First, cyclical economic momentum is building for the Federal Reserve to begin a series of interest rate cuts. Historically, both markets and forecasters have tended to underestimate easing cycles, causing the yield curve to steepen more than implied by the market forwards as the central bank cuts. Our analysis of central bank policy cycles since the 1960s found that across developed economies, even nonrecessionary easing cycles historically averaged around 200 bps to 250 bps of cuts – something markets are not currently pricing.
Furthermore, after stalling, U.S. inflation progress appears poised to resume in the second half of 2024 as rental inflation finally starts to cool. This along with a further easing in labor markets (the ratio of job vacancies to the unemployment rate is now back to pre-pandemic levels after a similar stall in the first quarter) should increase Fed officials’ confidence that inflation settles in the “two-point-something” range, if not all the way back to 2%.
Rental inflation has been surprisingly resilient, even accelerating in some of the largest cities. An underappreciated driver of this resilience has likely been the large immigration flows over the last few years. However, with slower immigration in 2024, we believe this factor should fade (see our 25 June 2024 Macro Signposts).
Over time, immigration is likely neutral for inflation, since immigrants raise both demand (by consuming) and supply (by working). However, in the short run, relatively inelastic housing supply, especially in cities that struggle with affordable housing, has meant that immigration has likely driven higher shelter inflation – a key focus for the Fed – even though it may have also contributed to faster wage disinflation in certain sectors, such as leisure and construction.
Immigration affects more than just inflation. It also likely boosted real GDP growth in 2023, which appears poised to moderate as lower inflows of asylum-seeking immigrants, coupled with moderating post-pandemic excess savings and government stimulus, weigh on growth.
Growing fiscal policy uncertainty A second factor that could support a steeper U.S. yield curve is the evolving outlook for fiscal policy. The U.S. presidential election, as it draws closer, could refocus markets on the challenging longer-term outlook for U.S. government debt, as we’ve discussed in our secular outlooks. As Libby Cantrill, PIMCO’s head of public policy, phrased it in this recent video, the U.S. budget deficit is likely to be the biggest loser of this election – regardless of which party wins.
Markets now also have to consider further potential economic implications of a second Trump term as the challenges facing the Biden campaign increase the odds of another Trump presidency (see our 2 July 2024 Macro Signposts).
If we take former President Trump literally on his stated preferred policy goals (and if Congress is supportive), we may see an aggressive mix of tax cuts and tariffs that could very well be stagflationary and expand the deficit. In a May 2024 paper,1 researchers at the Peterson Institute estimated that levying 60% tariffs on Chinese imports and 10% tariffs on all other trading partners, as Trump has proposed, coupled with a full extension of the Tax Cuts and Jobs Act provisions that expire in 2025, would likely cost the U.S. government an additional $2 trillion to $2.5 trillion over the next 10 years. That would add perhaps 5 to 7 percentage points to the debt-to-GDP ratio that the Congressional Budget Office forecasts could rise to 200% over the next several decades if current policies are maintained.
Furthermore, the magnitude and scope of Trump’s tariff strategy would likely hinder U.S. (and global) economic activity while pressuring inflation higher (see our 20 June 2024 Macro Signposts).
Overall, it’s a policy mix that could steepen the yield curve as markets contend with higher inflation, a growing deficit, and recession risks.
… Lastly, we also observe that across history, there have been environments that, on the one hand, have been conducive for evaluating bond alpha and on the other, have favored being long bond beta. The major takeaway is that our fundamental principles for trading bonds have been persistent and pervasive across both these economic regimes as well as different geographies.
Overall, the US continues to experience elevated nominal GDP with neutral growth and inflation measures. Additionally, labor markets and inflation pressures suggest the Federal Reserve will maintain current policy rates. Despite this, US short-term interest rate markets are pricing in six rate cuts. We see a modest alpha opportunity here: while rate cuts may occur, we do not expect hikes, making bond shorts less attractive. Our strategies are now underweight bonds but no longer short. By applying these views across seven countries, we find significant alpha versus passive bond exposure. Historically and globally, the US remains an underweight. Until next time.
More AFTER CPI but for now, good luck as you plan your CPI / Long BOND trades and TRADE your CPI / Long BOND plans … THAT is all for now. Off to the day job…