while we slept (block party continued); curve and swaptions diverge; S&P target reduced and UST volatility persists and INCREASED to levels last spotted in ...
May 19, 2022
Good morning …
Stocks sold off and clearly money went into 20s (ok, maybe not but…) it was, as ZH notes, a
Solid, 20Y Auction Stops Through As Yields Tumble
With that in mind, it would appear to be a rough start to the morning as markets attempt to come to grips with the idea the Fed never loses. Meaning whatever it is they want (ie tighter financial conditions — lower stocks, higher consumer rates or some combo of the two), they get.
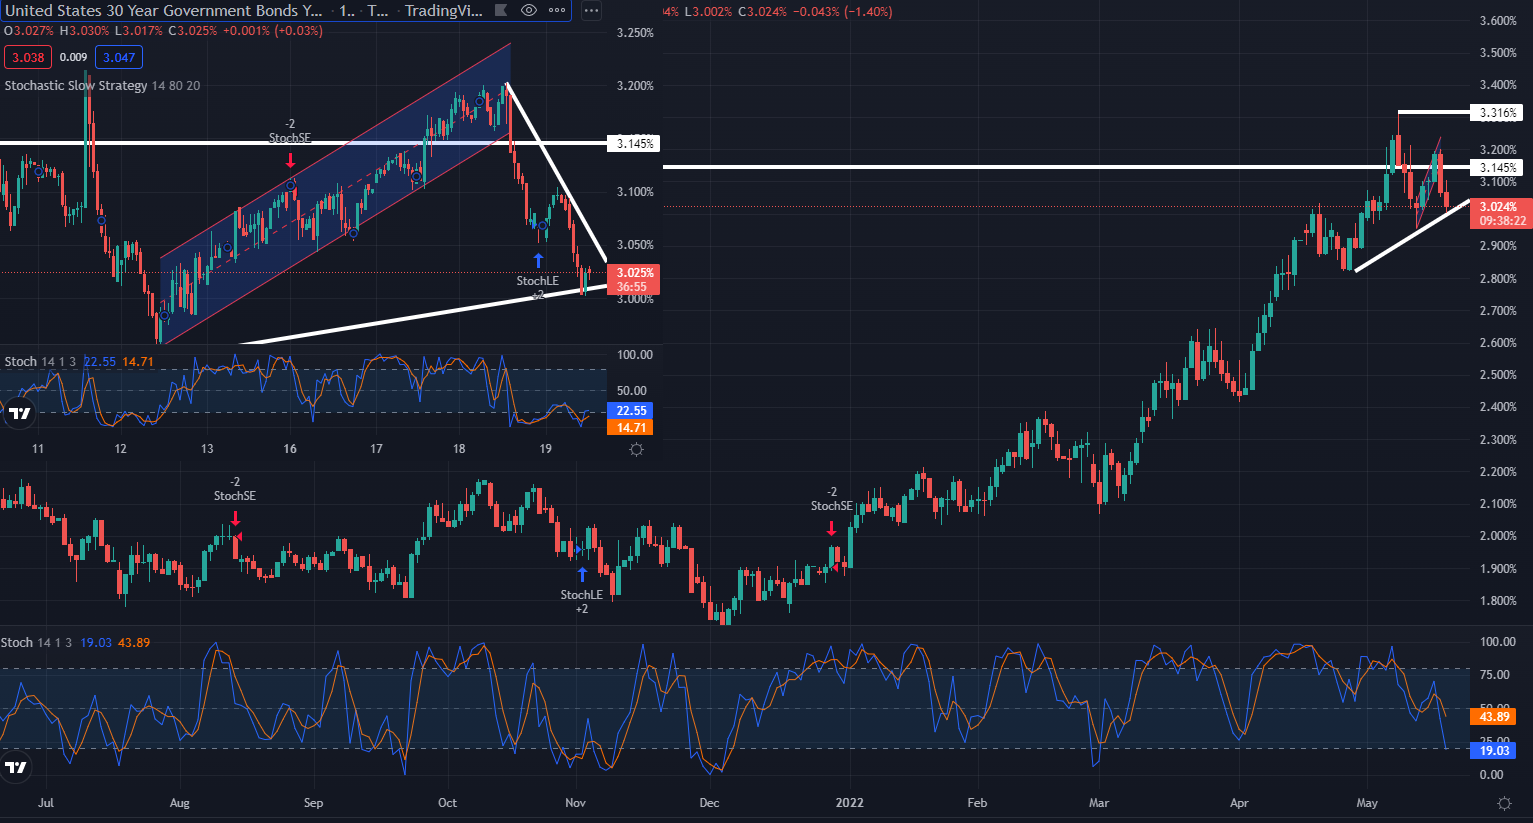
Turning attention from FCI and from 20s to bonds (which, they say, have more fun). Here’s DAILY 30yy chart with an HOURLY (inset) from TradingView.com
And back TO some overnight flows and news … this from CitiFXs Spratt,
For a second session, we have seen footprints of Treasury selling program via a series of identical block trades in futures. Unlike in Wednesday’s session, despite the persistence of these sales, the broader risk off-type move in rates has seen the duration shedding easily absorbed though the flow may could have helped slow the rally. According to CME data, we have so far registered:
FV 5,000 at 113-00+. $235k/bp seller (08:38 BST) FV 5,000 at 113-02. $235k/bp, seller (08:56 BST) FV 5,000 at 113-02¾. $235k/bp, seller (09:35 BST) FV 5,000 at 113-03+. $235k/bp, seller (10:06 BST) FV 5,000 at 113-04. $235k/bp, seller. (10:35 BST)
A combined $1.175mn/bp, and as you can see, the blocks are trading at incrementally higher prices…We note that bond markets remain vulnerable to another rethink on Fed tightening. Citi US Economics noted that Chair Powell's comments earlier this week, further raises the probability that 50bp rate hikes will continue until policy rates move above 3.5% (their base case terminal rate is 3.5%-3.75%), with the market implications clear, higher front-end interest rates, elevated recession risk in 2023-2024 and a very negative environment for risk assets.
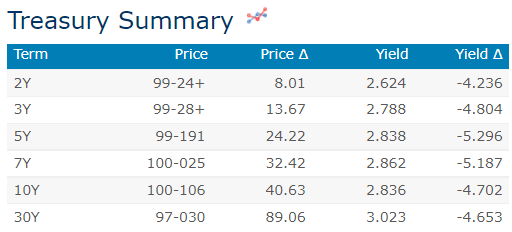
Overnight Flows Treasuries rallied further overnight in a solid risk-off move that continues to benefit safe haven assets. Overnight volumes were elevated with cash trading at 113% of the 10-day moving-average. 10s were the most active issue (an infrequent occurrence) taking a 34% marketshare while 5s were second at 31%. 2s and 3s combined to take 19% at 13% and 6%, respectively. 7s managed 8%, 20s an impressive 3%, and 30s 5%. We’ve seen two-way flows in 10s and buying in 30s.
… and for some MORE of the news you can use » IGMs Press Picks for today (19 May) to help weed thru the noise (some of which can be found over here at Finviz).
On this ‘day after’ with what looks to be another one on tap (thankfully it’s real early), a few words from our sponsors.
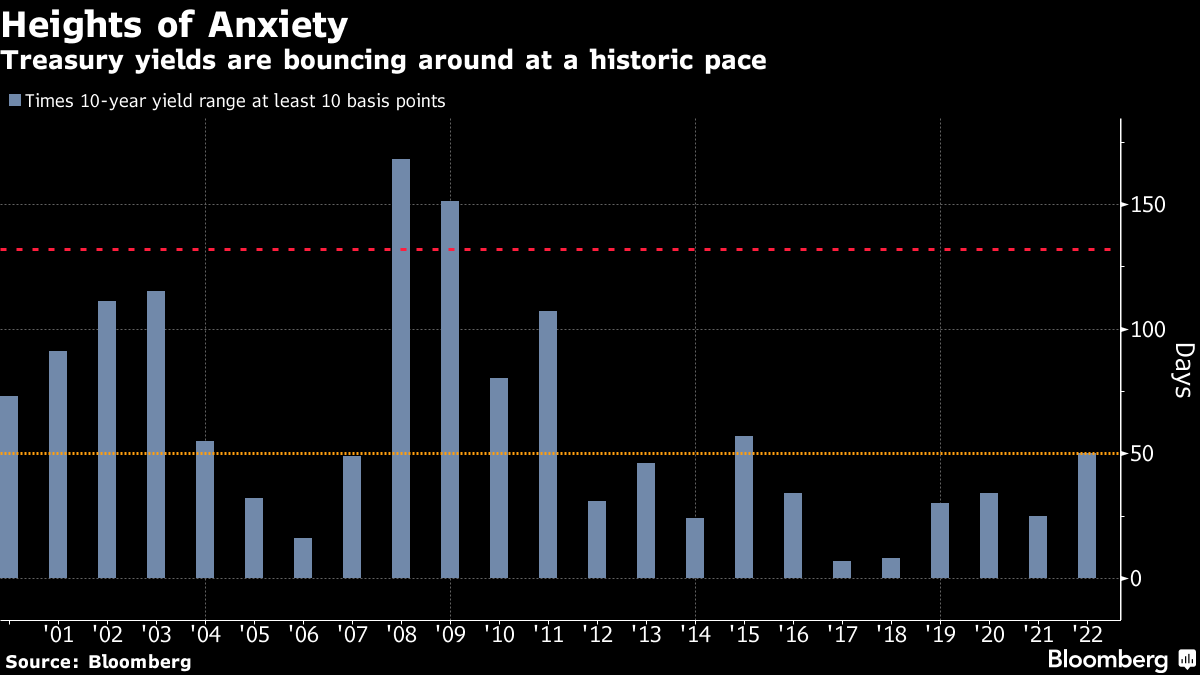
First is a visual from BBG noting UST yields over past 2d saw 10yy jump 10bps then drop 10bps. While this may SEEM normal (50th day this year with 10bps (or more) range on 10yy) it’s more than any full year since 2015.
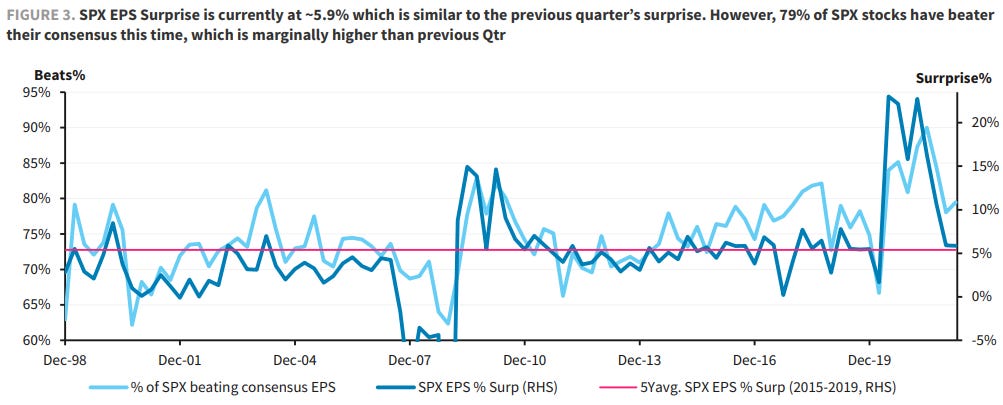
Our worries about margin pressures are materializing with negative guidance from large cap retail stocks leading to a sharp equity selloff. Earnings were decidedly mediocre and YTD earnings revision for SPX ex Energy have turned negative and zero growth in Goods consumption is a major headwind. Downside risks remain.
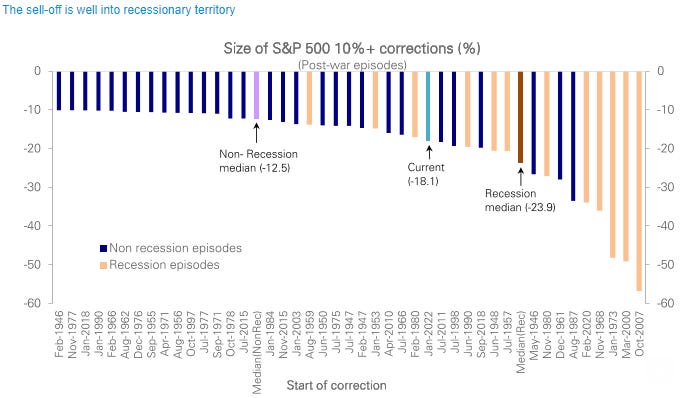
We noted in our outlook for this year, with the cycle late and valuations historically high, the range of possible outcomes for equities was wider and subject to a larger degree of uncertainty than usual. In the event, with the S&P 500 now far along (-18% at the recent low) in pricing an average recession decline (-24%), the equity market is at a crossroads with the path depending on whether or not we tip into one imminently.
Near term, with the cycle late, the pandemic-induced MCG & Tech valuation premium deflating and giving way to earnings concerns, and the Fed’s guidance to a rate hiking cycle that has ended in recession most (73%) of the time, we look for the market to price in a full average recession decline of -24% (S&P 500 3650).
Then things look relatively binary:
In the event we do slide into recession, we see the market sell-off going well above average, i.e., into the upper half of the historical range given elevated initial overvaluation, -35% to -40% or S&P 500 3000.
In the event we do not and growth and the labor market hold up, we expect the market to rally back to 4700-4800 by year-end as equity positioning rebounds from very low levels. A continuation of the rally is predicated on an orderly peaking in inflation concerns which allows the Fed to become less hawkish and the cycle continues.
Our baseline view, in line with our current house economics view, is for no recession imminently, with a relief rally recouping the prior peak by year-end. We maintain our S&P 500 EPS targets of $230 in 2022 and $245 in 2023, but lower our price target to 4750 (previously 5250) for this year end. The risk is that a protracted sell-off this late in the cycle prompts a slide into a self-fulfilling recession.
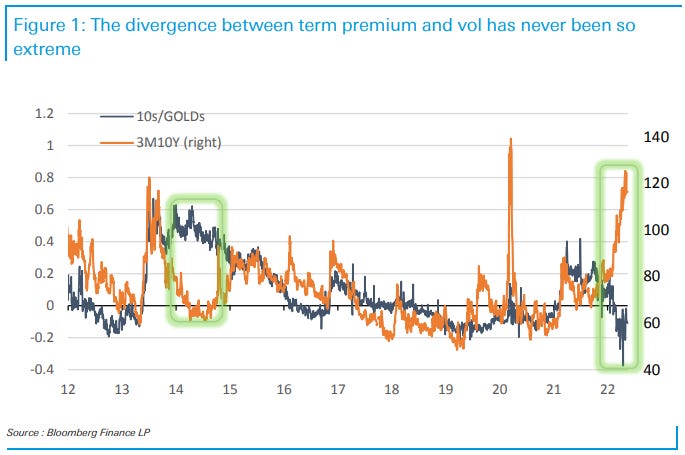
… The accompanying figure shows the history of the 10s/GOLDs spread overlaid with 3M10Y vol. This relationship was much tighter before the 2008 GFC, when active convexity hedgers reinforced it through arbitrage of mortgage carry. However, although the correlation has subsequently declined, the two have retained a common trend from which they rarely deviate for extended periods of time: when one of them goes up or down, the other usually follows (sometimes with a delay or with variable intensity, but almost always in the same general direction). This is a sign that different markets have the same interpretation of reality. Until this year, the only exception had been the post-taper-tantrum year, when the curve risk premium remained elevated in anticipation of imminent rate hikes, but vol collapsed as rates continued to trade in a tight range inside the 3M10Y breakevens for over a year, and caught up with the risk premium once rates began to move outside of the range.
In the context of the history and the logic that links the two measures of interest rate risk, the recent divergence is a sign of a structural break, which highlights the underlying inconsistencies of the rates manifold. While vol shot up in the most dramatic way, the term premium of the curve continued to compress to its historical extremes. On the one hand, rates volatility has been taking off due to both realized moves and on the back of growing uncertainties regarding the long end of the curve and the rising protection against it; on the other hand, the market’s abdication on the long-term outlook, beyond the near-term Fed action, has kept the curve anomalously flat. This divergence in the direction of two measures of (the same) rates uncertainty, together with their magnitudes, underscores the tensions and inconsistencies buried in the current shape of the yield curve.
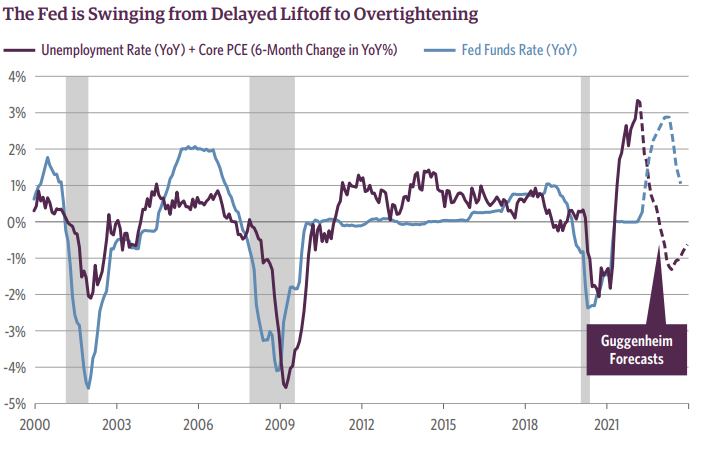
… At the same time, however, inflation is now decelerating and the pace of decline in the unemployment rate is slowing. Had the Fed followed the historical pattern in the chart above, the fed funds rate would be around 2.5 percent now and the Fed would be able to start pulling back on rate hikes as the economy cooled. Instead, the Fed looks poised to hike to around 3.5 percent into next year, when inflation will have slowed further and the unemployment rate will have largely leveled off. With the passage of time as the Fed continues to hike, we will likely find ourselves experiencing the effects of increasingly restrictive monetary policy. Well before it reaches this terminal rate the Fed will increase the risk of overshooting, causing a financial accident, and starting a recession. Such an asynchronously tight monetary stance should exacerbate the cyclical slowing of the economy and cause a recession as early as the second half of next year. Given this collision course between the Fed and the cooling economy, long term interest rates are likely near a peak.
As Scrooge asked in Charles Dickens’ A Christmas Carol, “Are these the shadows of the things that Will be, or are they shadows of the things that May be only?” Only time will tell.
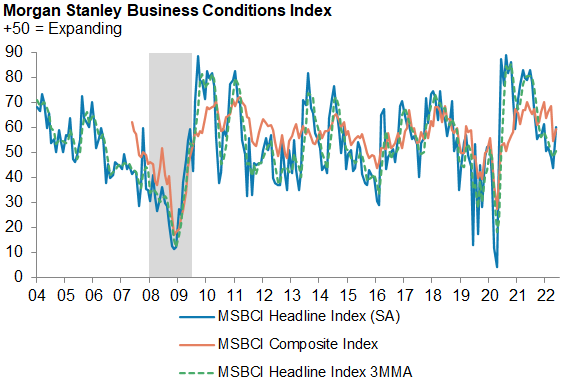
The MSBCI bounced back in May after hitting a two-year low in April, with mixed underlying details pointing to a pullback in capex plans, while hiring remains broadly intact. Price pressures remain very elevated as analysts report little improvement in supply conditions.
This is likely my last ‘hit’ for the week and never too late for YOU to donate TO Nate The Great’s cause ahead of HIS big day this weekend (HERE for more). And thank you for slowing down to take a look (and generosity) … THAT is all for now. Off to the day job…