while WE slept: ; ... and 10 reasons Fed likely to start easing again (Jimmy P), more on 899 and an interesting twist on the '64k question' ... think NFP?
Good morning … bond markets are calm and some of this due to a decent JGB auction several hours ago …
June 3, 2025 at 2:49 AM EDT Bloomberg: Japan’s Bonds Pass 10-Year Supply Test as 30-Year Sale Looms
… That PLUS some … OECD news helping steady bond market (as equities sell off a bit) and in this steady / calm bond market, much was made yesterday of 20s push below that of 30s so …
20yy: support at / near 4.95, 5.00 and then ABOVE, 5.086% …
… reason I mention SUPPORT is due to momentum (stochastics, bottom panel) are suggesting overBOUGHT conditions and while I realize we’re talkin’ 20s … Just some food for thought … keep your friends close and your stops closer, whatever you make of charts …
… and with that little said and in mind, and as the day that was (wasn’t, really without much in the way of drama and / or VOLUMES as I understand) … data was countered by Trump / China headlines …
ZH: Bullion, Big-Tech, & Black Gold Boom To Start June; Dollar Gloom Continues
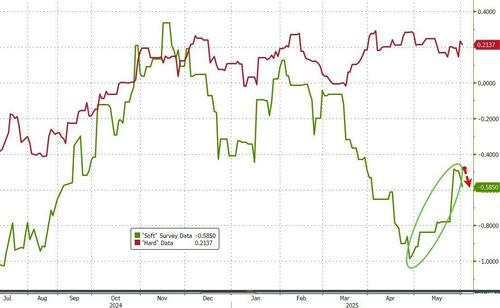
… A weak ISM print (and high inflation sub-index) reversed the recent trend of positive soft data...
...prompted some early selling pressure in stocks at the open - having barely recovered back to unchanged from overnight weakness.
Stocks turned back up on this HL around 1030ET- *TRUMP AND XI LIKELY TO SPEAK THIS WEEK: CNBC
And extended gains on the day as positive (if you lean that weigh) headlines hit around Iran: *US NUCLEAR DEAL OFFER ALLOWS IRAN TO ENRICH URANIUM: AXIOS
Nasdaq outperformed on the day with The Dow just making it back into the green by the close (interestingly, there was selling pressure at the Asia open, EU open and US opens)...
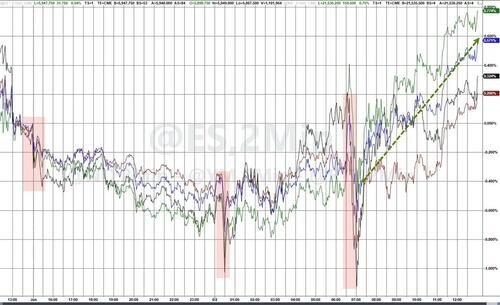
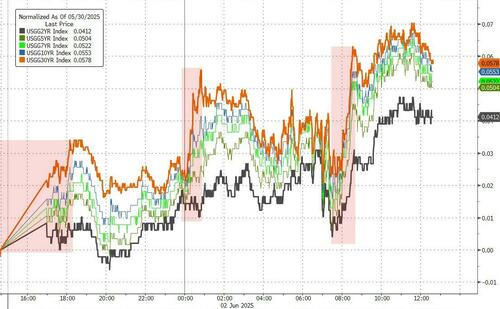
… Treasury yields were higher on the day led by the long-end with selling at the Asia open, the European open, and the US open...
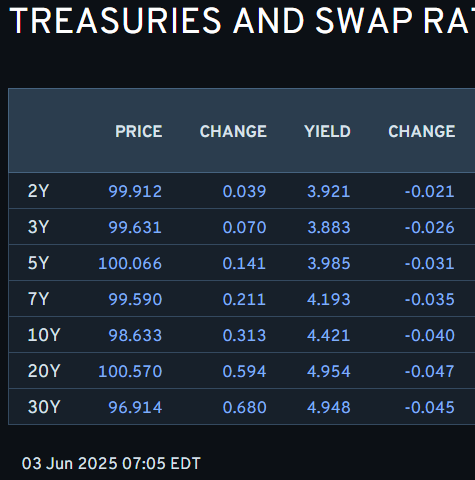
… and with THAT a note — Might NOT be anything early tomorrow due to plans to be in the Bronx this evening as NYY take on the Cleveland Indians (sorry, not sorry) and so … away we go but first …here is a snapshot OF USTs as of 705a:
… for somewhat MORE of the news you might be able to use … a few more curated links for your dining and dancing pleasure …
NEWSQUAWK US Market Open: DXY is firmer ahead of JOLTS & Fed speak, EUR pressured post-HICP … Japan’s 10yr sale was met with strong demand overnight and a very small price tail, a well-received outing that sparked immediate upside in JGBs and weighed on yields. Japanese paper was unreactive to BoJ Governor Ueda comments overnight … As above, USTs picked up on the Japanese auction and has continued to grind higher since. As high as 110-25, but so far at least has stalled ahead of a double-top at 110-30 from the two sessions prior. Ahead, the docket features JOLTS, Factory Orders, RCM/TIPP, the latest Discount Rate Minutes and remarks from Fed’s Cook (voter), Goolsbee (2025) and Logan (2026)…
Finviz (for everything else I might have overlooked …)
Moving from some of the news to some of THE VIEWS you might be able to use… here’s some of what Global Wall St is sayin’ …
Is this IT (THE slowdown)…
2 June 2025 Barclays: ISM manufacturing: Crosswinds shifting to headwinds
May's ISM manufacturing PMI slid another 0.2pts, to 48.5, with activity indicators remaining weak and factories moving quickly to pare inventories following pre-tariff stockbuilding. Details point to plunging trade volumes and gradually intensifying cost pressures from tightening supply chains.
Section 899 increases tax on various types of income for countries that impose "unfair" taxes, including on foreign investors that might otherwise be US tax exempt.
The main problem with Section 899 is that it comes in the context of existing investor concern about US policymaking and the long-term ability and willingness of the federal government to repay its large debts in real value.
We think the backdrop remains conducive to global investors reducing the degree to which they are overweight unhedged US assets.
Germany on the world, an early morning read AND a note on stonks …
02 June 2025 DB: World Outlook - The Limitations of Liberation...
The signs suggest the world may be on a turbulent but sustained path toward trade de-escalation. The fallout from the US 'Liberation Day' policies — from falling approval ratings to a sell-off in US government bonds — forced a rethink in Washington. While recent court rulings could pave the way for an even more benign trade regime, they also prolong uncertainty.
US growth is holding up better than feared, but we still expect a notable slowdown in H2. Real GDP is forecast at 1.0% (Q4/Q4) in 2025 and 2.0% in 2026 — or 1.6% and 1.7% on an annual average basis. Core PCE inflation is projected to hit 3.5% this year, allowing us to retain our call that the Fed will have to wait until December to cut again.
The broader structural story is that US economic exceptionalism is fading as the burden of twin deficits grows heavier. We remain structurally bearish on the dollar and see upward pressure on term premia.
In contrast, the Euro Area is stabilising. Our 2025 growth forecast is now 0.8%, back to where it was in November. Inflation is gradually easing, and a wave of fiscal stimulus — particularly in defence and industrial policy — may lay the groundwork for European “exceptionalism.” Germany is set for a stronger growth rebound from 2026.
China’s outlook has modestly improved (4.7% growth in 2025), while UK growth is picking up alongside falling inflation. Japan’s momentum has softened, and India remains resilient with growth expected to be at 6.5% for this year and next.
We forecast 10Y UST yields at 4.5% and Bunds at 3.0% by year-end, so a larger move for German yields. The dollar’s dominance is waning; valuation and capital flow dynamics are taking over. In credit, we prefer euro over dollar exposure. In equities, we remain overweight US and Europe.
The key theme: the slow erosion of US dominance is opening space for others. Europe, in particular, may find its moment. Carpe diem?
…United States: Easy come, easy go, little high, little low Summary: Our updated US economic forecast represents only a modest revision from that outlined in our last forecast update note on 14 April. Revisions since that time are generally towards a more optimistic view on the US economy, with growth revised modestly higher, unemployment and inflation slightly lower, and our perceptions of recession risks downgraded as well. The key innovation has been a quicker de-escalation in trade tensions, particularly with China.
…Fed on hold for now. A more modest rise in the unemployment rate and sticky inflation over the course of this year reinforces our view that the Fed is on hold for the time being. We maintain our existing view that the next Fed rate cut does not come until December. Our baseline then sees two more 25bp reductions in Q1 2026, bringing the fed funds rate to the 3.5-3.75% range at that time, consistent with our long-held view of an elevated neutral rate.
Risks to our Fed view are now two sided, rather than skewed to earlier and more aggressive reductions. A sharper weakening in the labor market is needed to push the Fed to cut earlier; this risk is still present but has diminished with the Trump administration’s relent. Conversely, economic resilience and higher-thananticipated inflation would keep the Fed on hold for longer and/or lead to more gradual reductions. Rate hikes could even come into view if fiscal policy sparks concerns around demand-driven inflation and especially if inflation expectations show broader signals of unanchoring.
Risks to this economic forecast are two sided and larger than normal. Continued de-escalation in trade tensions that quickly lowers average tariff rates below 15%, e.g., if recent court rulings are sustained without a complete replacement through other tools, would be taken positively by markets and strengthen the growth outlook. Larger tax cuts / less spending cuts would also support near-term growth momentum, though this outcome would also raise the risks of higher long-term bonds yields. On the downside, if the Trump administration is emboldened by the rebound in markets and ratchets up tariffs and uncertainty, more negative growth outcomes would become more likely and we could not fully rule out a recession.
… When it comes to the last 24 hours, June has got off to a mixed start amidst the latest trade tensions and an underwhelming ISM manufacturing print. To be fair markets have been more resilient than sentiment with the S&P 500 managing to recover from a weak open to close +0.41% higher, even if futures have given up these gains this morning. Bonds saw a renewed sell off, with the 30yr Treasury yield (+3.4bps) moving up to 4.97% before rallying back a basis point this morning. Matters also weren’t helped by a fresh rise in oil prices, as OPEC+ only increased supply in line with expectations for July over the weekend. Brent crude was up +2.95% to $64.63/bbl, which in turn led to a renewed bout of concern about inflationary pressures. So although there wasn’t a single story driving markets, the incremental newsflow predominantly leaned in a more negative direction …
… That backdrop was a pretty tough one for markets, and the various developments meant the dollar index (-0.63%) continued to slide, moving very close to its post-Liberation Day low back in late-April. In bond markets, there was another round of déjà vu as the 30yr Treasury yield bounced off the 5% mark again. That’s proved something of a resistance level in this cycle, and by the end of the session, it was up +3.5bps to 4.97% (4.96% in Asia). That move in yields was echoed across the curve, with the 10yr yield (+3.9bps) up to 4.44%, whilst the 2yr yield (+3.7bps) was up to 3.94%. Meanwhile in Europe, yields on 10yr bunds (+2.4bps), OATs (+2.8bps) and BTPs (+1.9bps) all moved higher as well. And the Italian-German 10yr spread fell to its tightest level since September 2021, at just 97.5bps.
Our base case was for a significant rally in equities on a credible relent on trade policies (Tariffs and Equities, April 23 2025). In the event, the administration relented earlier than we had anticipated, driven primarily by market reaction, and before the emergence of any legal barriers or economic or political pain. This reinforces the view that if negative impacts of tariffs do materialize, we will get further relents.
Relative to mid-April, we estimate the direct and indirect drags from tariffs on earnings have shrunk significantly, from at least in the mid-teens, to at most in the mid-single digits, and we mark-to-policy our 2025 EPS estimates higher from $240 to $267. We remind that prior to the outsized tariff escalation, the cycle showed plenty of legs with various aspects just beginning to kick in to the upside.
We see plenty of room for equity positioning to rise with discretionary investors at neutral and systematic strategies still underweight and expect buybacks will remain solid with no signs of companies going into the bunker. Our demand-supply framework, which combines changes in positioning with buybacks and inflows, points to a little over 10% upside for the S&P 500 by year end, taking it to around 6550. We do though expect the rally to be punctuated by sharp pullbacks on repeated cycles of escalation and de-escalation on trade policy.
This next one is good news, I think …
June 2, 2025 First Trust: Monday Morning Outlook GDP Up, Inflation Down
Conventional wisdom was that the tariffs imposed by the Trump Administration would cause higher inflation and slower growth – stagflation as far as the eye could see. But this past week brought economic news that defied this prediction…
… We like to focus on “Core GDP” which is real GDP excluding government purchases, inventories, and international trade, each of which is volatile from quarter to quarter. Core GDP grew at a 2.5% annual rate in Q1, faster than the average annual rate of 2.2% in the past twenty years…
…Inflation data show a quiet past three months, with PCE prices up a mere 0.1% in April. They are now up only 2.1% from a year ago, a much slower increase versus last year.
None of this means we are out of the woods on recession risk or that the inflation dragon has been slain. If the Fed were to dramatically loosen monetary policy, inflation could come back quickly. What it does mean is that investors need to be wary of getting caught up in news about the economy that often has a partisan political angle.
A global macro recap, an 899 catchup AND a note ahead of Friday’s jobs report …
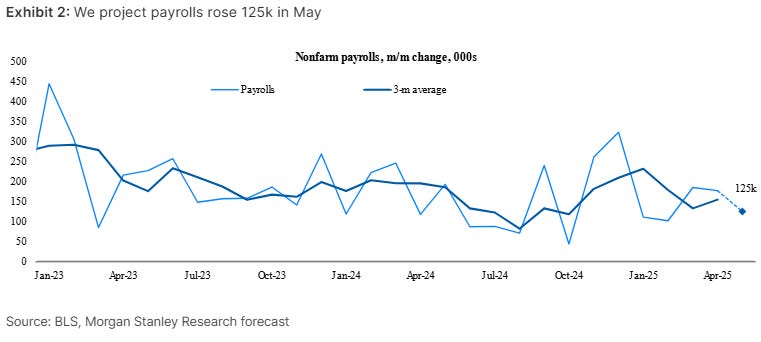
June 2, 2025 MS: Employment Report Preview: A downshift in hiring
Payrolls rise 125k in May, with slowing in labor demand, payback for April, and a drag from federal gov’t layoffs. Unemployment is unchanged at 4.2%. AHE rises 0.3% m/m and slips a tenth to 3.7% y/y.
The fiscal package now moving from the House to the Senate for consideration includes Section 899, whereby taxes are increased on foreign entities under certain conditions. Uncertainty about assets in scope has led investors to consider possible extra costs for holding US fixed income and, hence, unintended but wide-ranging impacts for fixed income markets. There's good reason to think the Senate will clarify language, mitigating potential fixed income impacts, but we outline considerations for Treasuries, the US dollar, corporate credit, securitized products, and cross-asset strategy.
Key takeaways
While the key sponsors of the provision and language in draft legislation do not suggest an intent to increase tax costs on fixed income assets for non-US holders, there's uncertainty among experts on this point.
Hence, there's reason to believe the Senate will clarify the scope, potentially mitigating risks. But if not...
If USTs fall in scope, we'd expect further US yield curve steepness and USD weakness, with private investors to act more quickly than central banks.
If US corporate bonds are in scope, we'd expect volatility from liquidity pressures (non-US holdings are ~25%). Further risk is realized if Treasuries are not in scope but corporate bonds are, reducing their tax-adjusted valuation.
The most meaningful implication for securitized products could be on demand for underlying assets where CRE (5-10%) has more exposure to foreign buyers than resi (<2%).
Switzerland SHOULD be center stage during talks of ANY sort … they are staying LONG 10s and ‘bout said TALKS …
2 June 2025 UBS: Global Rates Strategy Rates Map - R-Stars aligned for steeper curves
US - Underpriced growth risks and uncertainty We stay long US 10y, a US 5-30s steepener, and a SOFR Z5Z6 flattener. We think that underpriced risks of a growth slowdown and relatively benign US CPI prints in May/June will support 10s. Household measures of inflation expectations have risen, but have not been reflected in wage demands, as Fed Governor Waller also emphasized. Potential adjustments to the House's "Big Beautiful Bill" towards more spending cuts in the US Senate would also likely alleviate concerns about deficit spending. The US Senate could also clarify concerns on the implications of Section 899 in the House reconciliation bill. Nevertheless, we think 10s will likely struggle to trade below 4% in the next months.
1US equities gained ~6% as US 10y rates rose ~20 bps in May. The relationship between US equities and rates remains a focal point in client discussions after US treasuries sold off with stocks in April. Nevertheless, Figure 2 shows that markets have been slowly shifting back into the pre-Covid regime where bonds provide a hedge for equity weakness.
High frequency labour market indicators are worsening, but UBS is above consensus on NFP at 155k for reasons of May technicals. An above consensus print should help our SOFR Z5Z6 flattener to perform.
We have been arguing that the back-end steepening theme will persist, as indicated by a new cycle high of 97 bps on US 5-30s . We remain cautious on outright 30y longs as we expect investors will need some time to digest US budget developments and the sharp back-end steepening in Japan. It may be early days to judge the impact of higher JGB yields for global bond markets, but Figure 3 shows that foreign fixed income has become significantly less attractive for Japanese investors on a 2 fx-hedged basis. In Japan, we have been paying 2y1y OIS since our November outlook, which remains more than 100 bps below further forward rates.
Reports in Washington suggest US President Trump may talk directly with China’s President Xi later this week (after several days of more heated rhetoric between the US and China over trade). As Trump has been anxious for the call, and China has not, this may hint at more US retreats over trade taxes as a concession to bring China to the telephone.
A China manufacturing sentiment poll showed some weakness. Sentiment data everywhere is plagued with reliability problems, although the specific challenge of political partisanship is less likely in numbers from China. The US offers April factory and durable goods orders, with investors looking for damage from policy uncertainty.
The US job openings data is due—based off a survey with so low a response rate that one might question whether the numbers should be published. Again, investor focus is on whether policy uncertainty is causing companies to delay hiring (although this data does not reliably demonstrate that)…
… a couple from covered wagon folk …
June 2, 2025 Wells Fargo: Construction Spending Drops in April Heightened Uncertainty and High Interest Rates Spur Broad-based Decline
Summary Residential and Nonresidential Outlays Fall in April Total construction spending declined 0.4% in April, the third straight monthly drop. The pullback in total overall outlays largely reflects the high interest rate environment, which continues to cut into residential demand and stand in the way of new nonresidential projects getting underway. Uncertainty regarding changes to trade policy and the potential economic impacts also weighed on total spending. There is now more visibility in regard to tariffs, and concerns of an acute contraction in economic activity have lessened, which should help bolster the project pipeline in the months ahead. That said, the improved outlook means the Federal Reserve will not be in a hurry to reduce the federal funds target rate. As such, elevated financing costs should remain a constraint on activity moving forward.
June 2, 2025 Wells Fargo: ISM Manufacturing Index Signals Waning Activity in May
Summary The May ISM showed tariff pressure is beginning to bite for manufacturers who are seeing slowing activity, longer lead times and declining inventories. International demand is also drying up, with manufacturers reporting the lowest level of import orders since 2009.
… finally, all told, yesterdays data offered NO clear signals …
So is the economy slowing or speeding up? Yes, it is doing both according to today's batch of economic indicators. No wonder that neither stocks nor bonds did much today. The calm in the stock market was notable given that President Donald Trump was Tariff Man again on Friday, blasting China for not abiding by the temporary and partial tariff truce with the US and doubling the tariff on steel and aluminum from 25% to 50%. The gold market went up on that news as well as on reports that Ukraine destroyed a third of Russia's strategic bomber fleet with drones. The Ukrainians are coming!
In any event, there was no slowdown in today's Atlanta Fed GDPNow tracking model, which now shows Q2 real GDP up a whopping 4.6% (saar), up from the previous estimate of 3.8%. Consumer spending was revised up from 3.8% to 4.6%, while capital equipment spending was revised up from 5.1% to 8.8%. The most widely anticipated recession of all times remains a no-show, as it has for the past three and a half years. (Some of Q2's strength is reversing Q1's weakness (-0.2% real GDP), which was attributable to unusually cold weather and front-running Trump's tariffs.)
Why is the economy so resilient? Let's put a positive spin on today's other indicators, which were weak:
… In the past, the M-PMI was a reasonably good coincident monthly indicator of the y/y growth rate in quarterly real GDP of goods (chart). Over the past couple of years, the latter has been much stronger than suggested by the M-PMI. So the M-PMI has been a misleading indicator of the goods sector. That might be attributable to the rapid growth of information technology hardware and software, which may not be properly reflected in the M-PMI. Software is included in capital spending and treated as a GDP good.
The weakest components of the M-PMI during May, not surprisingly, were new export orders and imports (chart). They clearly are reflecting the impact of Trump's Tariff Turmoil.
… And from the Global Wall Street inbox TO the intertubes, a few curated links …
The consensus is forecasting a sharp slowdown in nonfarm payrolls over the coming quarters, see chart below.
A Terminal dot com VIEW which has a catchy title ‘bout bonds but goes on to be all ‘bout USD and STONKS …
June 3, 2025 at 4:00 AM UTC Bloomberg: 899 — The Three Numbers Alarming the Bond Market Taxing foreign capital could be another nail in the coffin of American exceptionalism. Emerging markets could benefit.
… Three numbers are sending a spasm of concern through Wall Street: 899. That’s the clause of the One Big Beautiful Bill Act currently before the Senate that gives the Treasury secretary the power to levy retaliatory taxes on the US investments of foreign countries that have levied “unfair taxes” on US companies. This isn’t a legal column, but you might try useful explainers from Baker McKenzie, or Skadden Arps, or McDermott Will & Emery.
The upshot is that the Treasury must tell Congress each quarter which countries apply “extraterritorial and discriminatory” taxes (the EU’s digital services tax is a prime example), and can then levy a 5% tax surcharge on their investments in the US, which could rise in stages to 20%.This matters because:
It gives the US a new weapon for negotiations (or to shoot itself in the foot);
Once passed by Congress, it has stronger legal grounding than tariffs;
It’s really likely to happen; and
Future Democratic administrations might well leave it in place.
Financially, the chief effects would be to weaken the dollar, a key administration aim, and to help foreign markets outperform the US. That’s because the tax would make US holdings more expensive, while the way the bill is structured would permanently add a new risk, as the unfair taxers list would be revised every three months. If American stocks and bonds are made riskier and more expensive, it behooves foreign investors to take money home.
Stephen Miran, chairman of the Council of Economic Advisers, argued in his widely read User’s Guide to Restructuring the Global Trading System that: “Demand for reserve assets leads to significant currency overvaluation with real economic consequences.” Reducing demand for those assets should thus weaken the dollar…
CHARTS … especially in light of recent MONTHLY closes … are always a good thing especially for those of us visual learners … here’s couple that caught my attention …
2 JUN 2025 Hedgopia: US Equity Indices At Crucial Juncture, Inability To Gain Traction Can Quickly Result In Momentum Reversal
… This tariff/earnings uncertainty is what led to a 21.3-percent tumble in the S&P 500 between 19 February when it reached a new intraday high of 6143 and 7 April when it bottomed at 4835. The recovery since has been no less impressive (Chart 3). From that low through 19 May when the large cap index hit 5969, it shot back up 23.2 percent. Subsequently, the index came under slight pressure to successfully test the 200-day (currently 5785). It has closed above the average for 14 consecutive sessions now…
…Bulls are also facing stiff resistance in the small-cap arena.
Last week, dual resistance at 2100 continued to repel rally attempts; on both Tuesday and Wednesday, the Russell 2000 traded in the 2090s intraday but failed to break out. In the end, it rallied 1.3 percent for the week to 2066.
The significance of 2100 goes back to January 2021 (Chart 5). Most recently, the horizontal support was breached nearly three months ago, in early March. Just above 2100 also lies trendline resistance from 25 November last year when a new all-time high of 2466 edged past the prior high of 2459 from November 2021.
In essence, 2100 represents a make-or-break moment for the Russell 2000. If it cannot break out, then the bears will be eyeing a rising trendline from April’s low, which is just a stone’s throw away. Last Tuesday’s intraday low of 2058 just about tested this support. It is a must-save for the bulls.
Jimmy P with something we can share and read …
Jun 02, 2025 Paulsen Perspectives: A Pictorial of Fed Easing Pressures Numerous market and economic indicators are suggesting the Fed should be continuing to ease interest rates. See the pictorial below.
While the Federal Reserve is waiting to see if the Trump Tariffs lead to problematic inflation, the traditional signs that it is time for the Fed to ease continue to multiply. What follows is a pictorial of economic relationships relative to the Federal Funds rate which are indicating the Fed normally would never have paused its easing cycle.
1. The Unemployment Rate has been Rising
During at least the last 40 years, the Fed has seldom been in tightening mode when the unemployment rate was rising (chart 1). Since 1985, the Fed has lowered the Funds rate 74% of the time during months when the unemployment rate rose. The unemployment rate (shown in red on the inverted right-side scale) bottomed in April 2023 at 3.4% and during the last two years has risen to 4.2%. It would not likely take much of a rise in the unemployment rate from here to bring considerable pressure on the Fed to start easing again.
2. Consumer Confidence has Collapsed
As demonstrated in chart 2, it’s highly irregular for the Fed not to be easing after consumer confidence just crashed close to post-war lows. Essentially, consumers are communicating they feel worse today about the economy than they did at the bottom of the 1990 recession, after the dotcom stock market collapse in the early-2000s, about as bad as they did at the worst of the 2020 pandemic recession, and worse than they did at any point during the 2008-09 Great Recession. If confidence remains this depressed, it will be unprecedented if the Fed doesn’t soon help by easing interest rates.
3. Employment Growth Grinding to a Halt
Annual nonfarm payroll employment growth just slowed to below 1.2% in April (chart 3). During the last 50 years, when the annual growth in job creation has become this sluggish, it has led to either an actual recession or at least a growth recession. At its current annual pace, job growth is less than it was when the Fed first began easing interest rates in 1989, 1995, 2000, 2007, and in 2019. How long can the Fed stand pat as job growth grinds to a halt?
4. Annual CPI inflation at a Recovery Low of only 2.3%
I know the Fed is worried about where inflation may be headed in the balance of this year as tariffs work through the economy. Perhaps the Fed will be proved correct and will be raising interest rates to fight tariff-related inflation pressures in the coming months. However, as shown in chart 4, if tariffs unexpectedly don’t cause much inflationary fallout, the Fed is likely to find itself behind the curve in terms of easing relative to diminishing inflationary pressures. The CPI annual inflation rate just declined to its lowest level of the recovery, and at least so far, shows no signs of becoming problematic. What inflation rate would force the Fed to give up worrying about an inflation ghost and ease? Should economic growth continue slowing, inflation may surprise and decline further than most anticipate, despite tariffs.
5. Job Openings no Longer Exceed Unemployment
In 2022, there were more than two job openings for every unemployed person (chart 5). Today, however, the number of job openings are about equal to the number of unemployed. This is yet another jobs market indicator suggesting the employment market is far weaker today than it has been at any point in this recovery. During the last 25 years, there has been a very close relationship between the ratio of job openings to the unemployed, and the Federal Funds rate. As shown in chart 5, typically when the openings/unemployment ratio has declined, so too has the Fed funds rate. Therefore, it is rather odd the Fed continues standing pat while this ratio regularly makes new recovery lows.
6. Real GDP growth sits near the 2% Stall Speed
Annual real GDP growth slowed to just 2.1% in the first quarter (chart 6). Historically, the 2% area has been considered the “stall speed” where recoveries often slip into a recession. Regardless, as shown in chart 6, since 1985, there has been a close relationship between real GDP growth and the Fed funds rate. When annual real GDP has neared the stall speed of 2%, the Fed has almost always been in easing mode.
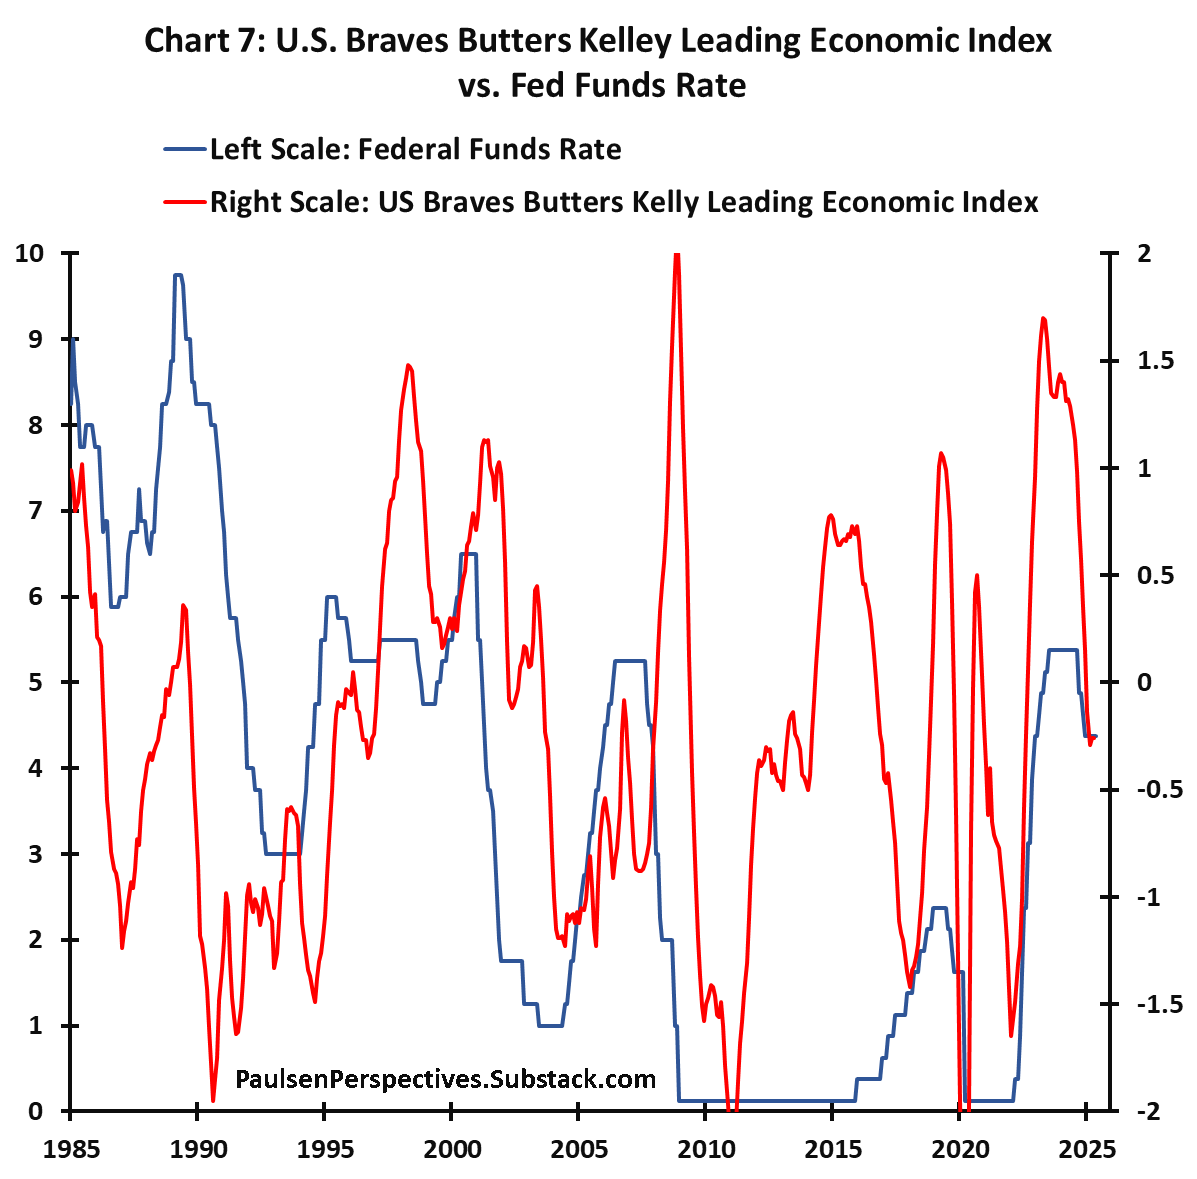
7. US Leading Economic Indicator Flashing Red
The Federal Reserve of Chicago has developed a U.S. leading economic indicator based on dynamic factor analysis of 500 monthly measures of real economic activity – the Braves Butters Kelley Leading Index shown in chart 7. Since at least 1985, this leading index has closely traced movements in the Fed funds rate. Early this year, the index declined below zero for the first time since 2022. Since 1985, usually when this index was declining and was below zero, the Fed was easing interest rates. How long will the Fed be able to ignore leading indications about the health of the economy?
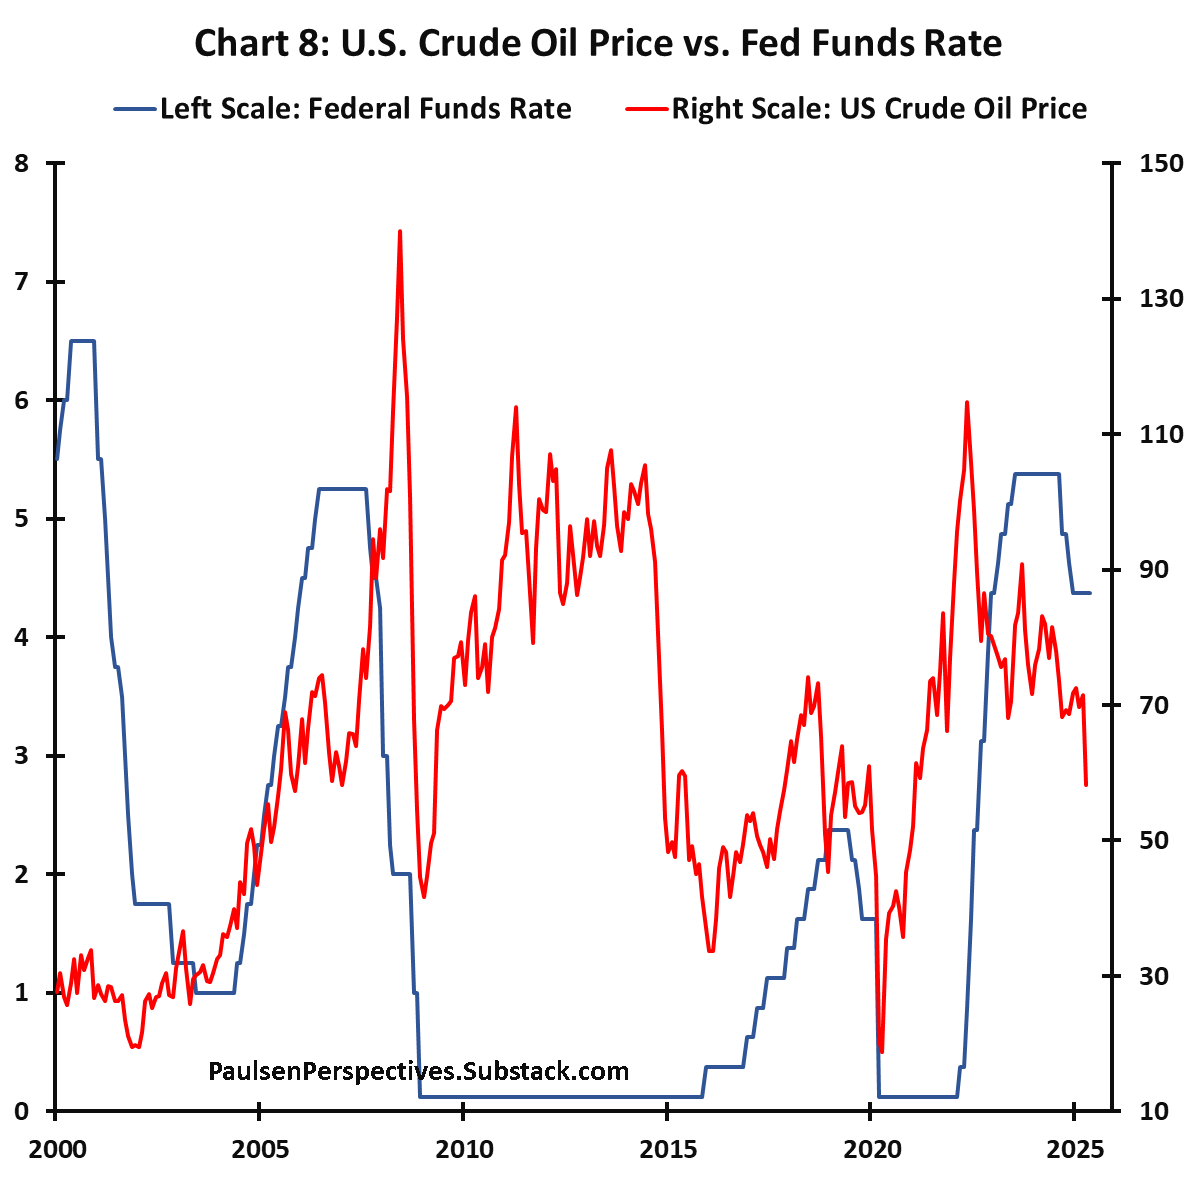
8. Fed Funds Usually Follows Crude Oil Prices
Although not a perfect relationship, as demonstrated in chart 8, the Fed funds rate has typically moved in line with crude oil prices. During the last 25 years, every major decline in the price of crude oil has been associated with either a zero Funds rate or a declining Funds rate. Since the Fed paused its easing campaign in mid-December, the price of crude oil has dropped by about 20% to more than a four-year low. And still, the Fed continues to stand pat!
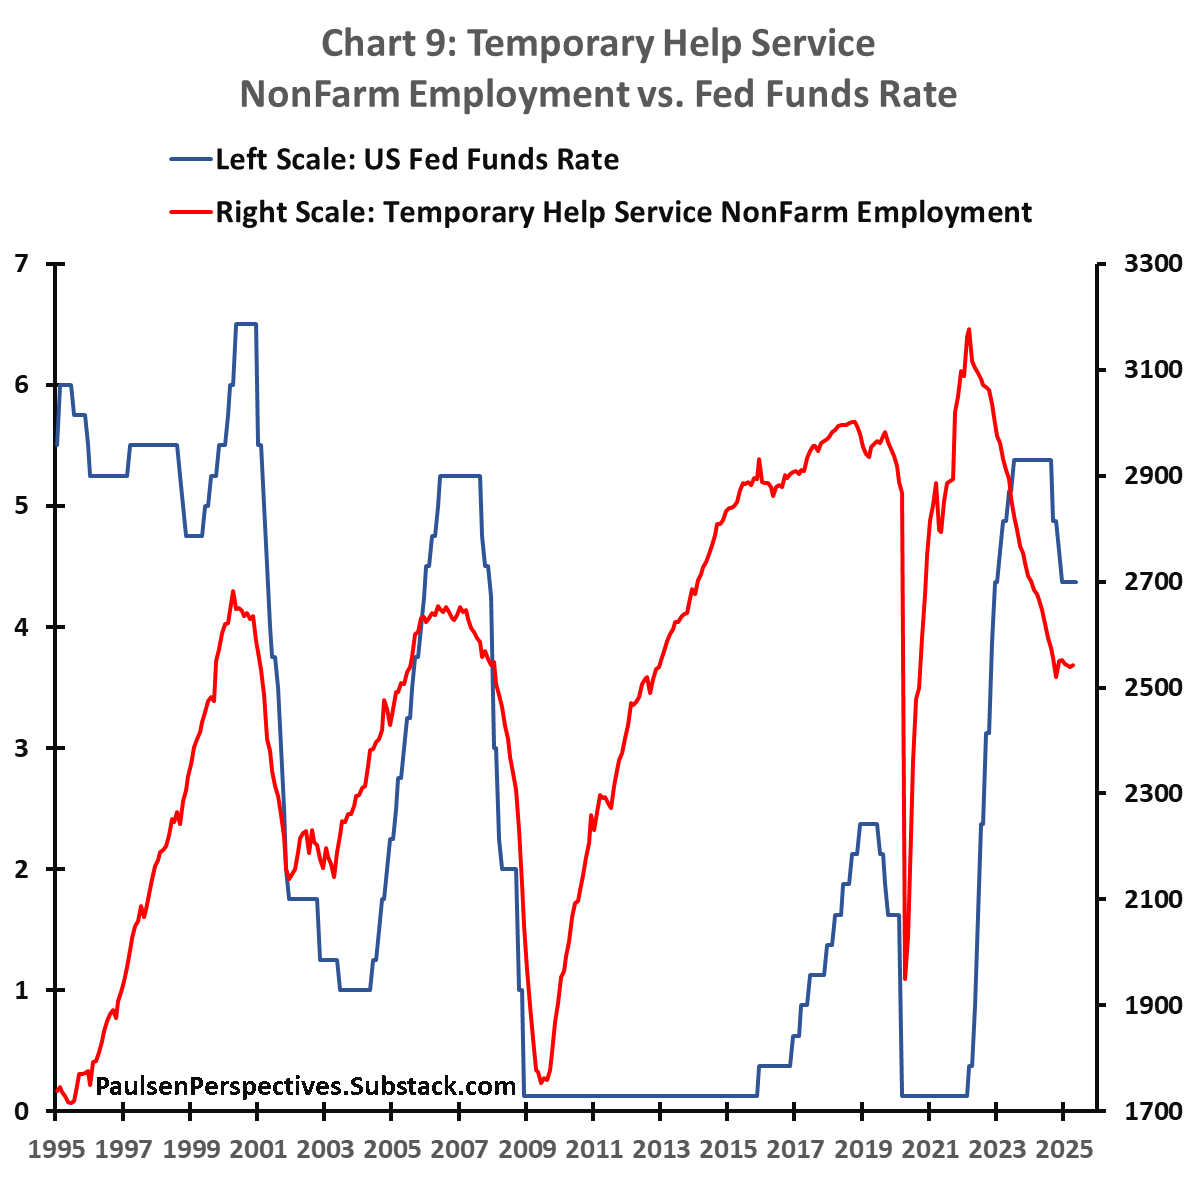
9. Temporary Jobs Signal Economic Weakness
Traditionally, temporary jobs tend to rise during strong economic times and are the first to be cut as the economy slows. For the last 30 years, chart 9 overlays the level of temporary jobs with the Fed Funds rate. Clearly, the Funds rate has historically responded to the strength or weakness in temp jobs. Not only has the Funds rate normally peaked when temp jobs peak, but the Funds rate typically declines as temp jobs decline. Although temp jobs have flattened since late last year, they did decline substantially during the last couple years. Should temporary jobs start declining again, the Fed will likely face additional pressure to ease interest rates.
10. Investors Signaling Weak Growth, Not Inflation as the Primary Worry
Chart 10 overlays the trailing 1-year correlation between the weekly percent changes in the S&P 500 index and weekly changes in the 10-year U.S. Treasury yield (red line shown on an INVERTED right-side scale). This correlation has proved to be an excellent indicator as to whether investors are primarily worried about inflation (when the correlation is negative) or a recession (when the correlation is positive). As shown, during the last 30 years, there has been an extremely close relationship between this correlation and the Fed Funds rate. Currently, while the Fed remains concerned about inflation risk, the financial markets are clearly suggesting that recession, not inflation, is the real risk. The fact that investors fear a recession and show little concern about inflation stands in sharp contrast to the Fed’s contemporary obsession with inflation. Indeed, the current stock-bond yield correlation at about +0.2 suggests the Fed Funds rate should perhaps already be less than 3%.
Final Comments
As the Fed continues to “wait & see”, both the economy and the financial markets maintain pressure on the Fed to again ease interest rates. I don’t know whether inflation will worsen substantially in the months ahead due to tariffs (but my guess is inflation worries will likely prove greatly exaggerated) nor do I know how long the Fed can stand pat with interest rates. But, with the economy already regularly throwing off signs of stress, it probably won’t take much to convince the Fed it should soon again start easing.


https://www.zerohedge.com/markets/its-treasury-vs-fed-fed-sidelined-bessent-unleashes-record-10-billion-bond-buyback
The Mystery Buyer was the US Treasury, not the Fed