while WE slept: adult swim, NIKKEI's no good very bad day; FOMCs 7 cuts behind (and other rules...); The Labor Market Cracks - What's Next? (EPB Macro)
Good ADULT SWIM morning … from no landing to soft to an extremely hard-landing accompanied by an intra-meeting rate CUT.
Yield forecasts being LOWERED (this past weekend HERE) and forecasted rate cuts being updated (ie marked to markets ‘predictions’) still today (see WFC just below) …
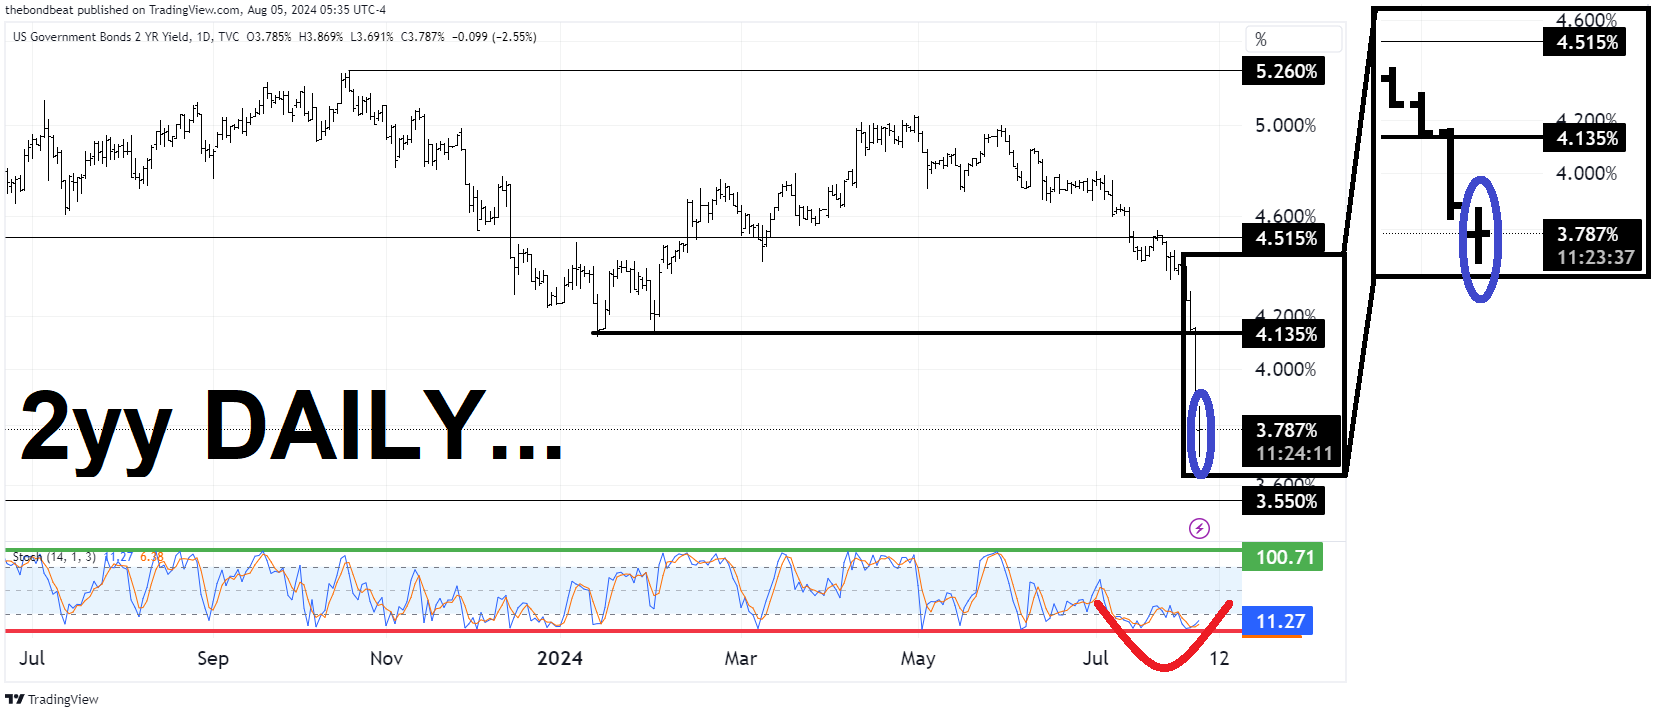
2yy: aggressively UNCH but DOWN ~10bps from Friday close!
… not sure highlighting of techs / stochastics (bearishness bottom panel) worthwhile as we know in times like these where there’s geopolitical and economic concerns here, there and everywhere, well … USTs are where all the cool kids hang out and wait for the storms to pass …
Friday’s data = the butterfly flapping its wings and causing more risk off buying of USTs …
WSJ: Japan’s Nikkei Posts Biggest Single-Day Fall Since 1987 After Weak U.S. Data Yen rises to around 142 to dollar as U.S.-Japan interest-rate gap narrows
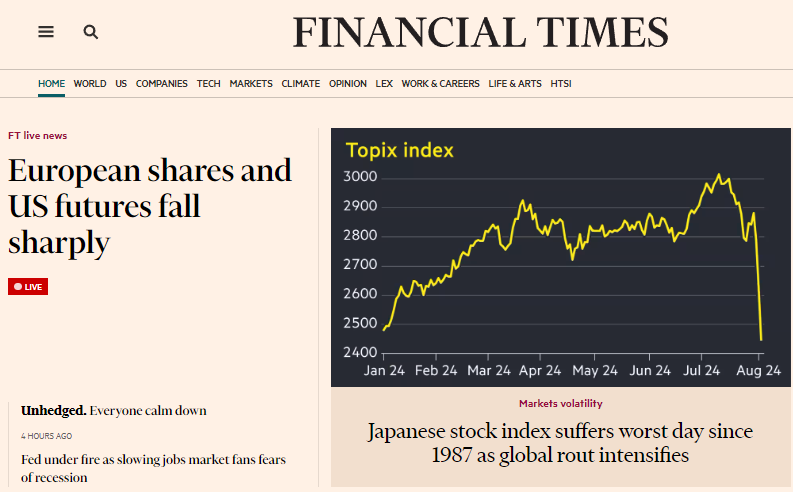
… It was the biggest single-day percentage drop in the Nikkei since it fell 14.9% on Oct. 20, 1987, after the “Black Monday” crash on Wall Street.
Other stock indexes in Asia also fell, with South Korea’s benchmark Kospi down 8%.
U.S. jobs growth slowed sharply in July and the unemployment rate rose to its highest level since 2021, the U.S. Labor Department reported Friday. The yen strengthened against the dollar as a result…
FT: Japanese stock index suffers worst day since 1987 as global rout intensifies
… and so it goes after it came and went Friday here … The Sahm rule being offered up as one reason why US expectations being revamped, and going global, and I feel obligated to remind myself … this rule is no better / worse / different than, say, the yield curve prediction one and ITS capabilities …
at charliebilello
The longest yield curve inversion in history (758 days) is close to ending today w/ the 10-year Treasury yield now only 0.08% lower than the 2-Year Treasury yield. Historically, the flip back to a positive sloping curve after a long inversion has occurred near a recession.
… and so it goes, and the narrative shape shifts before our very eyes. FROM a curve inversion = recession (to look at some other curve(s) and … 758d and counting, later … well NOW, those out looking for II polling votes are once again, in concert, s I told ya so … victory lapping about this all, the SAHM rule (this past weekend HERE). Please lets remember this?
A few items to help as the band-aid was ripped off Friday morning at 830a and the powers that be, have yet to find and place a tourniquet on so as to stem some of the bleeding …
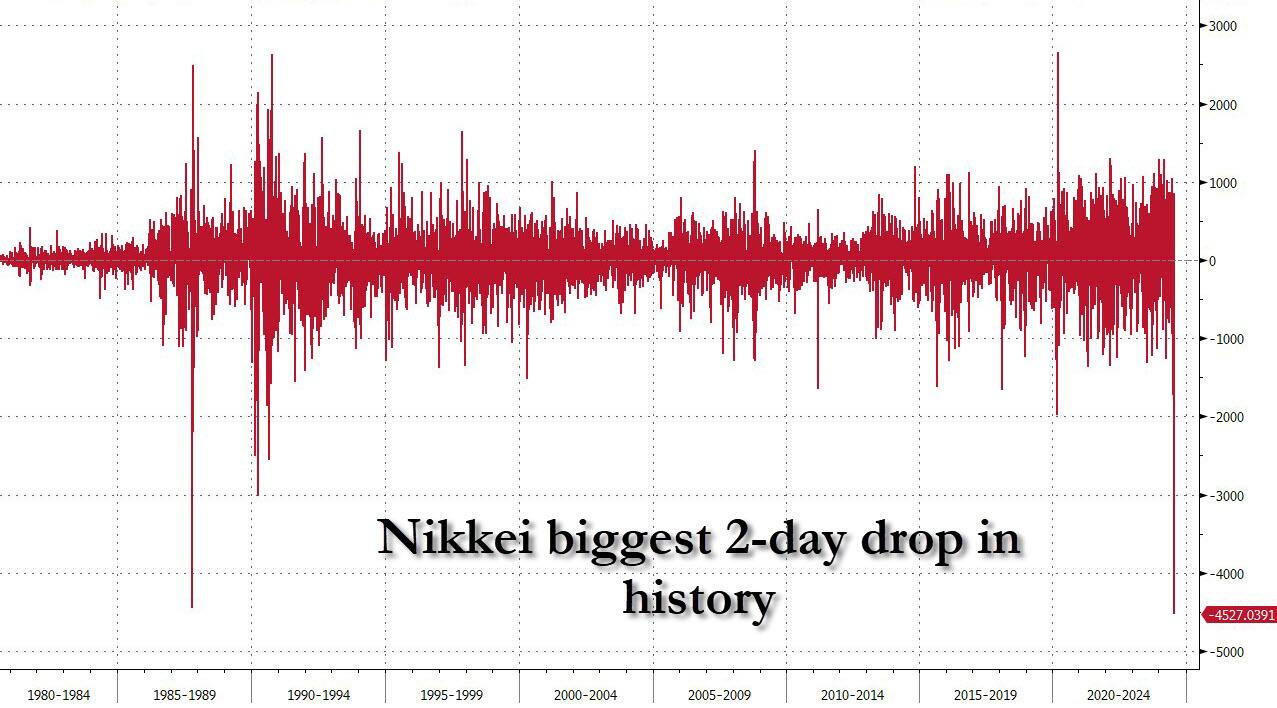
ZH: Japanic Monday: Japanese Bonds, Stocks Halted After Plunging Into Bear Market As Everything Crashes Everywhere
… which has also just suffered its biggest two-day drop in history, surpassing Black Monday...
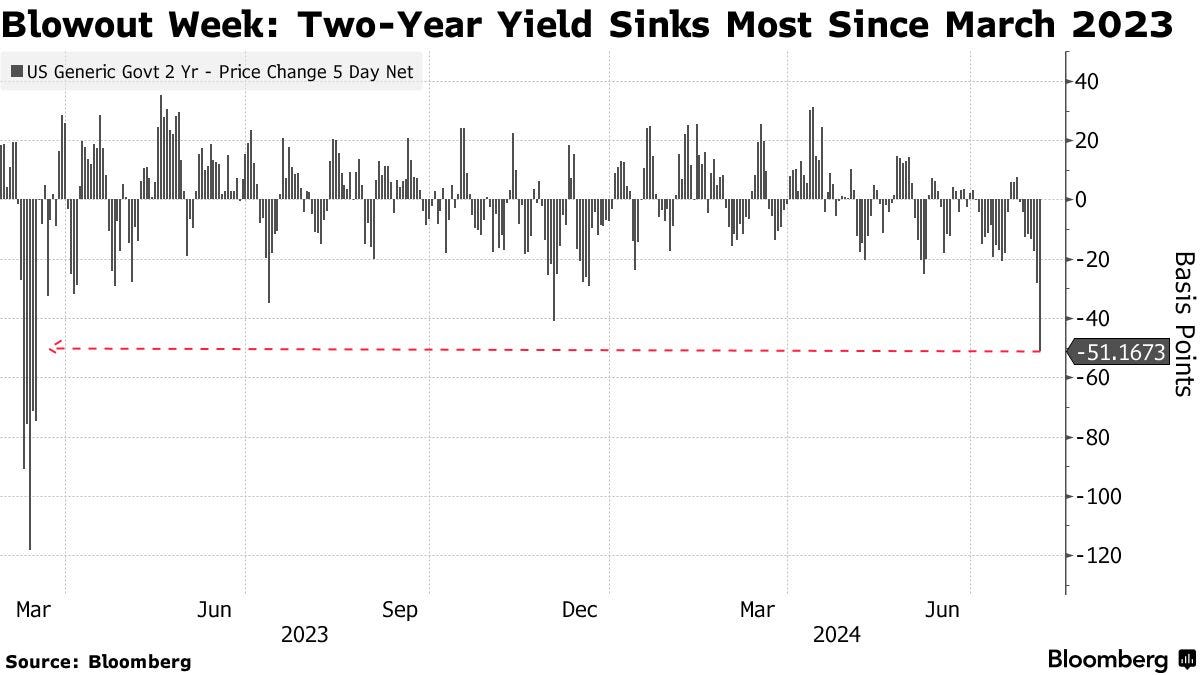
Bloomberg: Treasuries Surge as Traders Bet Big on a Fed Rescue Move
Jobs data stokes worries the central bank has waited too long
Traders price in a series of deep cuts through end of year
… “The market concern is that the Fed is lagging and that we are morphing from a soft landing to a hard landing,” said Tracy Chen, a portfolio manager at Brandywine Global Investment Management. “Treasuries are a good buy here because I do think the economy will continue to slow.”
Bond traders have repeatedly misjudged where interest rates have been headed since the end of the pandemic, however, at times overshooting in both directions and caught off guard when the economy bucked recession calls or inflation defied expectations. At the end of 2023, bond prices also surged on conviction that the Fed was poised to start easing policy, only to give back those gains when the economy kept exhibiting surprising strength…
… The economy continues to look “fine overall,” there are no major financial imbalances and the Fed has a lot of room to cut rates and can do so quickly if needed, the economists said.
Futures traders are pricing in roughly the equivalent of five quarter-point cuts through the end of the year, indicating expectations for unusually large half-point moves over the course of its last three meetings. Downward moves of that scale haven’t been enacted since the pandemic or the credit crisis…
Bloomberg (via Yahoo): Global Bonds Erase This Year’s Loss as US Economic Outlook Sours
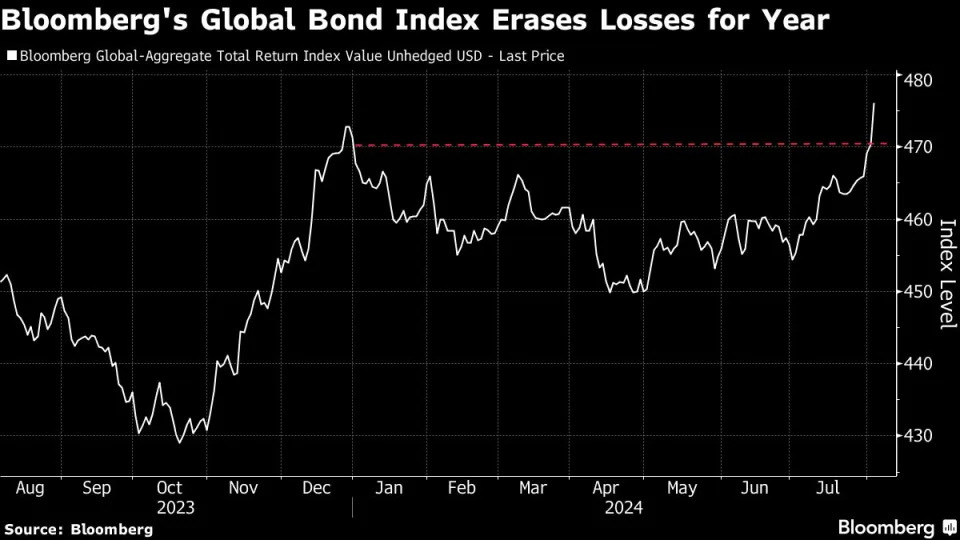
Global bonds have erased their losses for the year as concern the US economic outlook is rapidly worsening spurs demand for fixed-income assets.
Bloomberg’s index of global sovereign and corporate debt has now gained 1% for 2024 after being down as much as 4.6% in the middle of April. The gauge surged 2.3% last week alone. Bond markets took another jump Friday when monthly US payroll data showed hiring slowed and the jobless rate climbed to a three-year high.
ZH: Jittery Israel Braces For 'Five Front' War As Officials Predict Iran To Attack Monday
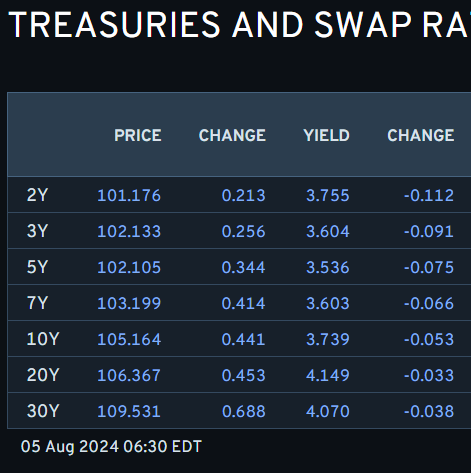
… AND while this all likely to change shortly AFTER hitting send and realizing I’m only BARELY scratching the surface as you sit down and try to make sense of it all and plan your trades and TRADE your plans, well … here is a snapshot OF USTs as of 630a:
… and for some MORE of the news you might be able to use…
NEWSQUAWK: US Market Open: Sell off continues, circuit breakers triggered in APAC trade; odds of Fed cuts soar … Fixed benchmarks bid with the odds of Central Bank easing ramping up; implied odds of a 25bp Fed cut this week as high as 60% … USTs at highs, yields lower across the curve with just the 20yr & 30yr remaining above 4.0% at lows of 4.08% and 4.01% respectively.
Finviz (for everything else I might have overlooked …)
The FOMC has set the stage for a September rate cut, while market sensitivity is much higher towards further cooling of labour data. The broad-based weakness in non-farm payroll data last week has showcased this rising sensitivity across asset classes.
The tailwind from lower core rates to risk assets is now fading, with escalating macroeconomic risks. US equities show a fragile technical picture, in our view.
Rate-sensitive FX continues to outperform. We refrain from buying the dips in USDJPY, especially due to the current technical picture that is still exposed to further unwinding of longs and to a slippery gamma profile below the current spot level.
… As a result, we continue to like receivers in the belly of the US curve and our favourite expressions are 3m5y receiver spreads and 5s30s UST steepeners (dated 11 July). But this hard-landing narrative suggests more aggressive versions of steepeners like 2s10s are becoming attractive as well, with front-loaded rate cuts getting priced in. US exceptionalism has been gradually priced out since May and the weaker ISM and NFP data should add further momentum to this recent trend. Hence, we continue to like convergence between US and EUR rates via our long US10y SOFR vs short EUR 10y ESTR trade idea (dated 12 June)….
DB: Early Morning Reid (as good a place to start sorting out overnight price action as any …)
Tough to know where to start this morning as markets are melting down in Asia after a bond market melt up on Friday…overnight losses are huge for some assets. The Japanese TOPIX (-8.98%) and Nikkei (-8.23%) are slumping, not helped by the +2.27% rise in the Yen in what looks to be a huge position squaring exercise. The Nikkei has gone past a -20% correction from its July 11th highs. The KOSPI (-7.66%) is also very weak. Elsewhere, the S&P/ASX 200 (-3.33%) is also notably lower with the Hang Seng (-0.26%), the CSI (+0.24%) and the Shanghai Composite (+0.07%) massively outperforming as China’s services PMI improved (more below). S&P 500 (-1.67%) and NASDAQ 100 (-3.18%) futures are having a very bad session for this time in the day. Meanwhile, the brutal rally in US treasuries from Friday is moderating. Yields on 10yr USTs are -4.1bps lower trading at a 1-year low of 3.75% after touching a low of 3.72% earlier in the session, while 2yr yields are -7.7bps lower at 3.80%, versus -11bps earlier this morning when trading opened in Tokyo. 10yr JGBs are -11bps lower this morning. Bitcoin is -14.5% lower in what appears to be a huge deleveraging trade. Coming back to China, the Caixin services PMI climbed to 52.1 (v/s 51.5 expected) from a level of 51.2 in June…
…So it doesn't feel like a great report but it probably wasn't as bad as the market pricing that we detail below would suggest. Indeed, the number of Fed cuts by year-end jumped a stunning +30.5bps on Friday to 116bps (+48.1bps on the week), bringing the expected rate for December to its lowest since early February. And more than 200bps of cuts are now priced over the next 12 months which has only really been seen before in a recession. This fuelled sharp gains for bonds, as 2yr yields sank -26.8bps on Friday (and -50.2bps over the week) to 3.88%, their lowest level in over a year. 10yr yields fell -18.6bps on Friday to 3.79%, with their -40.4bps weekly decline being the sharpest since 2008. This also led to a major steepening in the 2s10s curve, which rose +9.8bps (and +8.3bps on Friday), to its least inverted level since July 2022 (@-9.35bps). The rally was slightly more moderate in Europe, as 10yr bund yields fell -23.4bps (and -7.0bps on Friday)…
MS: Sunday Start | What's Next in Global Macro: How Weak Is the Consumer? (written by Mike Wilson the stock jockey SO … just a guess .. folks ‘gonna be talkin’ about this one … )
Over the past few months, our discussions with clients have centered on the slowdown in consumer spending and the leading indicators which suggest it may continue. After all, it was the consumer that buoyed growth last year and fended off the hard landing that many feared. Therefore, if household consumption is now fading more than expected, does that mean investors need to start worrying again? Given the ramp in valuations and expectations around earnings growth, just a growth disappointment would likely lead to further underperformance of consumer-related and other cyclical stocks as it is reflected in the economy more broadly.
From a macro standpoint, the data remain mixed…
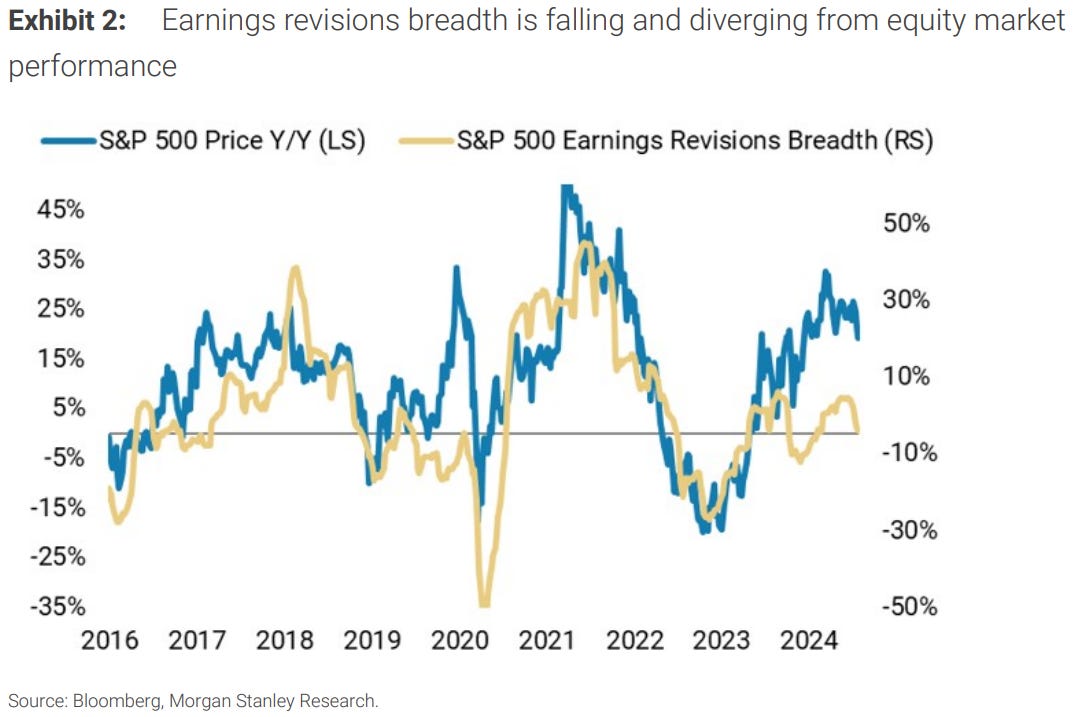
…The other variable weighing on stocks over the last month has been valuation, which remains in the top decile of the past 20 years. It’s worth noting that valuations are sensitive to earnings revisions breadth, which turned negative last month. The last time S&P 500 earnings revisions breadth rolled over into negative territory was last fall. Between July and October 2023, the market multiple declined from 20x to 17x. Two weeks ago, the P/E was 22x, and it is now at 20x. If earnings revisions continue to fade, as the seasonal trends suggest they will, it’s likely these valuations have further to fall. With our 12-month base case target multiple at 19x, the risk/reward for equities broadly remains unfavorable. Under the surface of the market, we continue to recommend a quality + defensive (rather than growth) bias. This syncs nicely with our rates strategy team's ongoing recommendation for a bull steepener. See our note tomorrow for more details on the consumer and our view on the implications of Fed rate cuts for US equities.
The BoJ hiked, the BoE cut and the Fed emphasized the risks to the dual mandate. The narrative now shifts to where the central banks go from here.
… Now that the cycle is turning, there will be a temptation to extrapolate, with expectations being dragged by fears of a material growth slowdown or inflation undershooting. Thus far, the major central banks have shown patience as inflation ran above target, we should similarly be cautious in over interpreting policy decisions as central banks are likely to continue to be patient and, more importantly vis-a-vis rate expectations, measured. They are aware, as we have noted regularly, this cycle is unusual…
UBS: Markets and fundamentals (looking increasingly correct regarding the policy error, at least from an all-important MARKETS POV)
The Federal Reserve has been late in cutting rates, but that has been true for some time.The policy error is making things worse for lower income households. Middle income households are the critical group for economic activity, and are less negatively affected by the delay in rate cuts. Last Friday’s employment report (seemingly weather impacted) does not change that; indeed, unemployment for college graduates declined.
Does the drop in equity markets have an economic impact? The S&P index is at levels last seen in June, which might create some negative wealth effect. While loss aversion exaggerates the importance of equity declines relative to equity increases, this is not the sort of change that is likely to alter investors’ behavior as consumers…
Wells Fargo: Updating Our Fed Funds Forecast (one part NFP recap 2.0 and another updated f’cast being marked to market …)
Summary
The FOMC has largely succeeded in its mission to return inflation to its target of 2%. However, recent data suggest the risks to the "full employment" part of the Fed's dual mandate are rising. Payroll growth has slowed and unemployment is rising.
As measured by the real fed funds rate, the stance of monetary policy is quite restrictive at present. In our view, the FOMC needs to get back to a "neutral" stance of policy quickly or else it risks a vicious circle of labor market weakness leading to sluggish spending, leading to further labor market weakness, etc.
We now look for the FOMC to cut rates by 50 bps at its meeting on September 18 with another 50 bps rate cut on November 7. We forecast the Committee will reduce its target range for the federal funds rate to 3.25–3.50% by the middle of next year, which is in the vicinity of what many observers, including us and numerous members of the FOMC, consider to be neutral.
We continue to forecast that the economic expansion, which has been in place since mid-2020, will remain intact due, at least in part, to aggressive Fed easing. We will be releasing a full forecast update later this week in our August U.S. Monthly Outlook.
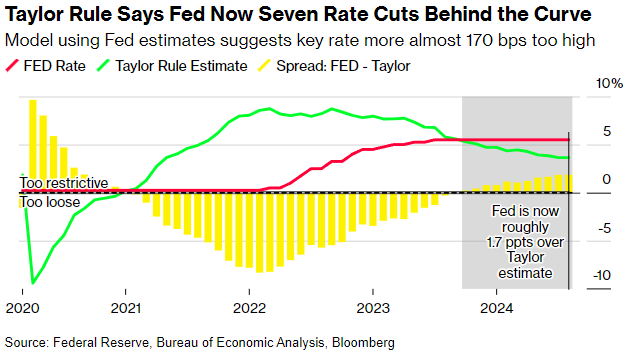
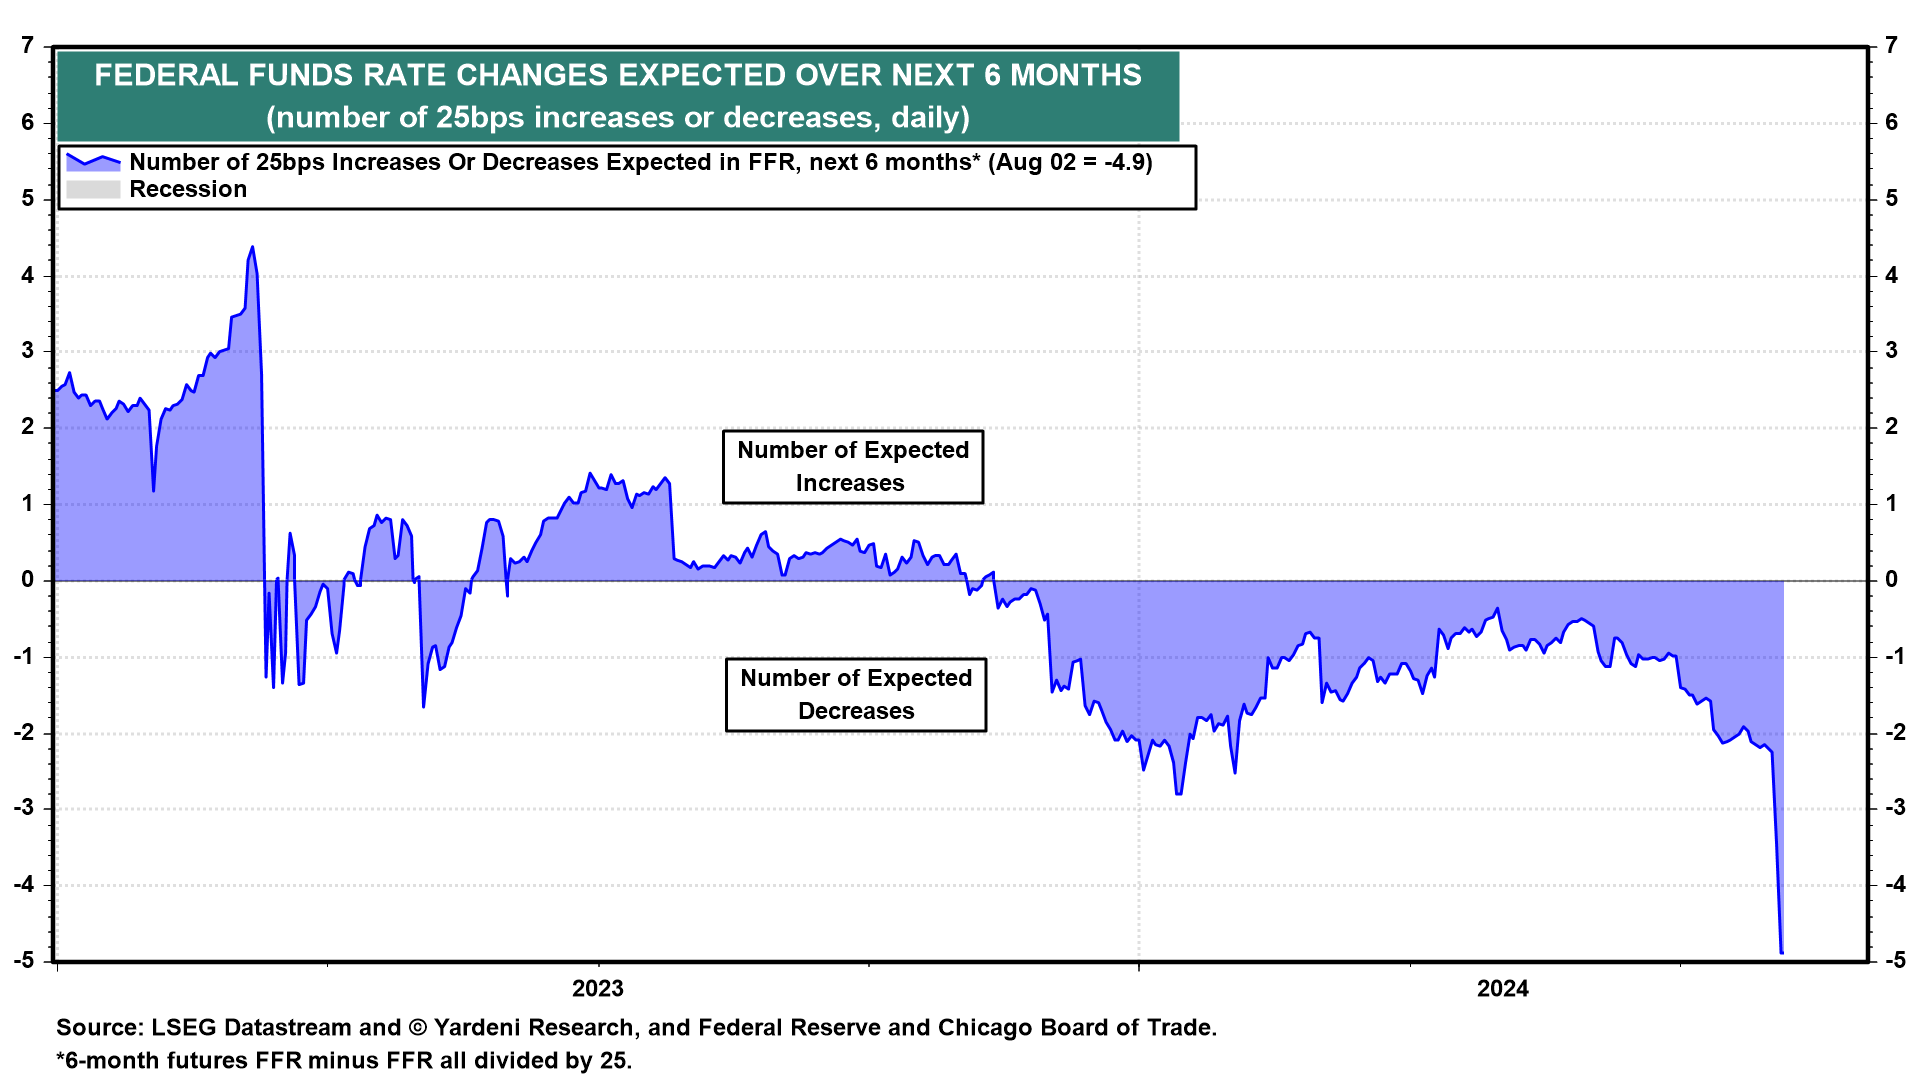
Why did the stock market fall on Friday if July's weaker-than-expected employment report is now widely expected to force the Fed to cut the federal funds rate (FFR) five times over the next six months to avert an employment-led recession (chart)? Indeed, the market now believes that a 50bps cut might even be on the table for September.
In the past, the Fed only began to cut rates when recessions just started. That is likely to happen again now say the diehard hard-landers. We've observed that in the past, the Fed started to lower the FFR when tight monetary policy triggered a financial crisis that turned into an economy-wide credit crunch and a recession (chart). This time, there has been no credit crunch and no recession, so far.
Friday's stock market selloff in equities and buying panic in the fixed income markets was triggered by the following events:
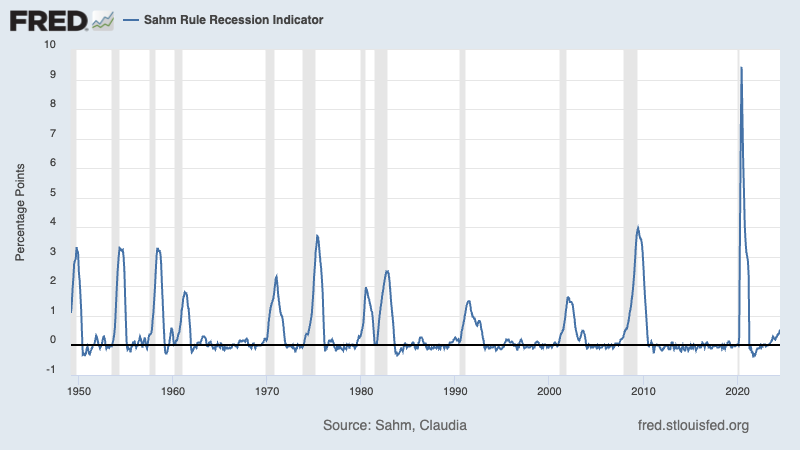
(1) Recession scare. July's employment report was weak. The increase in the unemployment rate to 4.3% triggered the Sahm Rule, which predicts that the unemployment will spike in coming months causing an employment-led recession. Claudia Sahm warns that her rule might not work this time, though she has been leading the charge of the Fed easing brigade. We blame inclement weather for July's labor market weakness, especially the drop in average weekly hours. By the way, announced layoffs fell sharply in July to 25,900 (chart). During employment-led recessions, this series spikes up, not down.
Furthermore, we agree with Fed Chair Jerome Powell that the Sahm Rule is a "statistical regularity." Driving it in the past has been that the tightening of monetary did cause the jobless rate to rise slowly and then to spike when rising interest rates triggered a financial crisis that turned into a credit crunch and a recession (chart). That sequence hasn't happened so far…
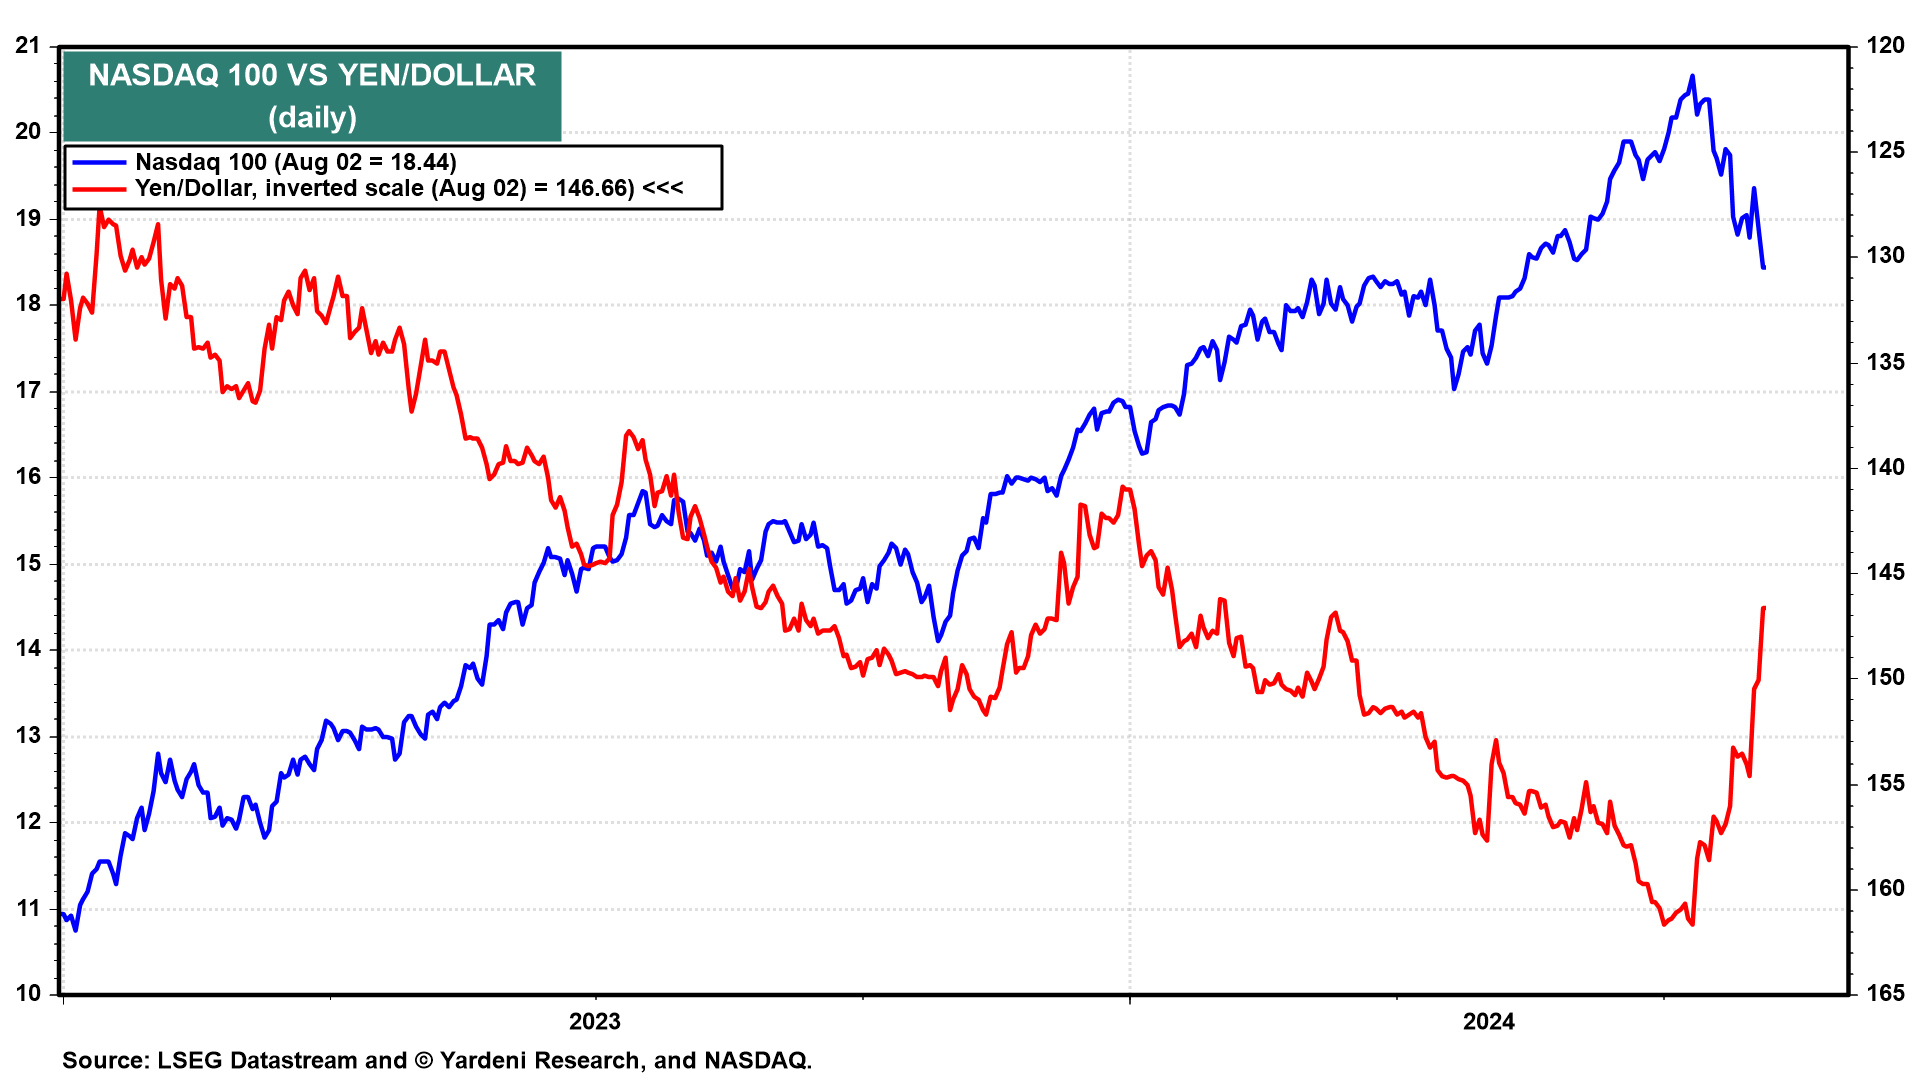
… 2) Covering the carry trade. Also on Friday, the yen continued to soar in response to the Bank of Japan's recent tightening moves. Since 2023 (at least), speculators borrowed money in Japan at near-zero interest rates. They converted their borrowed yen into dollars, and bought the Nasdaq 100. That drove the yen further down and the Nasdaq 100 further up. This "carry trade" has been unraveling in recent weeks and might have crescendoed on Friday. Of course, the carry traders played their game in other currencies and other asset markets around the world.
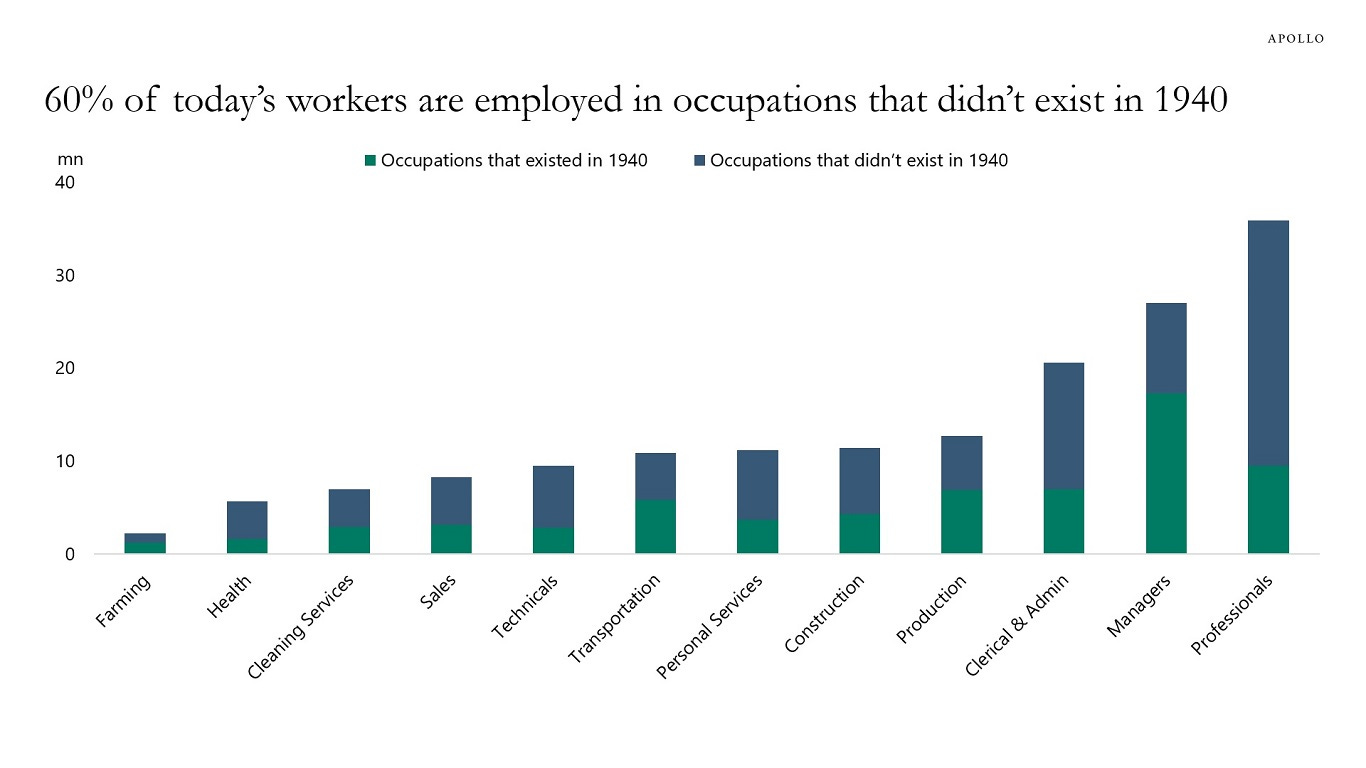
Research by David Autor from MIT shows that 60% of today’s workers are employed in occupations that didn’t exist in 1940, see chart below.
This is important when discussing what impact AI may have on the labor market.
Bloomberg: Buffett's butterfly turns into terror over Tokyo (Authers’ OpED) So did US employment data, the Fed’s delays on rates cuts, and a flock of evidence that makes investors see recession.
… Not Made Only in Japan
Friday brought quite a selloff in Tokyo. At the time of writing, Monday morning is delivering an extraordinary sequel. Only last week, the Bank of Japan announced that it would be halving its purchases of bonds. The discontinued policy of Yield Curve Control, which had latterly kept the 10-year JGB yield below 1%, was well and truly over. Yet since the market opened Friday, we’ve witnessed the biggest two-day fall in JGB yields this century:
To demonstrate how this was sequenced, here is the 10-year JGB yield since the beginning of last week. The three rings are, in order, the BOJ meeting, the Japanese market’s first opportunity to respond to the FOMC meeting, and the first chance to respond to the US unemployment data. This doesn’t mean that the BOJ didn’t contribute to the accident, but it does mean that other forces were at work:
The Employment Situation report disappointed consensus expectations across the board. The 3M average of total nonfarm payroll gains continues to trend lower, and the unemployment rate jumped strongly to 4.3%, now 90bps off the low point of the cycle.
There is an open question as to whether the hurricane in Texas impacted the monthly job numbers, and this is possible, but what’s more important is the trend that’s been developing for the last 12-18 months.
A trend is a trend, and it should be taken seriously when sufficiently forecasted by the Leading Employment data, as it has been since late 2022.
As always, we take our collective reading on the labor market report from a basket of indicators rather than any single data point.
Nonfarm payrolls, the employment level, aggregate weekly hours, the unemployment rate, and the insured unemployment rate are aggregated into our Coincident Employment Index, which showed a monthly decline in July.
More importantly, the growth rate of the Coincident Employment Index has been “below trend” since the early part of 2023 and slipped into fractional contraction for the first time since the 2020 recession.
On a longer-term basis, there has never been a time in modern history when the Coincident Employment Index registered a sustained negative growth rate without the economy being inside a Business Cycle Recession.
A -0.1% growth rate is certainly not clear cut and could come with revisions, so we have to see more data to make a firm declaration, but again, the trends across the Leading Employment Indexes over the last 18 months, now being confirmed in the Coincident Employment Indictors is a very significant Business Cycle signal.
We frequently reference the growth rate of the EPB Coincident Employment Index and nonfarm payrolls. Nonfarm payrolls is one of the components held within the Coincident Employment Index, but traditionally, the most lagging of the metrics…
… Labor demand has slipped below labor supply, which will bring dramatically lower wage pressure.
If the Federal Reserve wants to freeze labor market trends exactly where they stand today, the policy rate should be set at “neutral.”
Sam Ro from TKer: There are 'rules' and then there are 'statistical regularities' Plus a charted review of the macro crosscurrents
The “Sahm rule” has had a consistent track record of predicting recessions, and it was triggered on Friday. (Source: FRED)
📉 Stocks fell last week, with the S&P 500 shedding 2% to end at 5,346.56. The index is now up 12.1% year to date and up 49.5% from its October 12, 2022 closing low of 3,577.03. For more on stock market moves, read: Keep your stock market seat belts fastened🎢 …
Just because something happened a bunch of times in the past doesn’t mean it must happen again in the future…
… Meanwhile, we also got that drop in inflation.
The Fed’s preferred measure of inflation has come down significantly from crisis levels. (Source: BEA via FRED)
This is not to say that the Sahm rule, the Beveridge curve, and the Phllips curve are all useless…
ZH: "Suddenly Recession Is On The Tip Of Everyone's Tongue... Wow, Did That Happen Fast!"
… Just a quick note on “revisions."
“2-month total revisions” should have the most updated information as it provides more time for survey responses to arrive. According to the BLS Survey Response Rates, the response rates remain low (I was focused on employment, though CPI housing also caught my eye). Again, what is the “fudge factor” and how good is the BLS at it?
When looking at 2-month net revisions (a bit overstated, I think due to double counting), we’ve had 14 of the last 18 months revised downward. That seems statistically unlikely. It also shows a rather significant number of total downward revisions. Where I am coming out on the jobs data:
Initial, headline numbers – American Exceptionalism.
Looking into details, examining trends on revisions, data “plugs,” and estimations – American “meh-ism.”
In the U.S. you don’t convict someone of a crime if there is a “reasonable doubt” so why would we make policy on data that, at least for me, also creates a “reasonable doubt”?
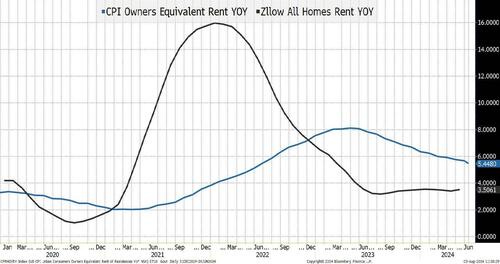
Speaking of crimes, which data set do you believe? The CPI Owners’ Equivalent Rent or Zillow’s?
This chart seems to highlight a few things:
The Fed was slow to hike because they were using data that was not capturing the move in rents! It is almost impossible to believe that anyone reading this report didn’t face this issue directly, or with family or friends! Rents were skyrocketing in 2021 while we were still embarked on QE.
The “pain” the average person felt around inflation, which seems to show up in sentiment surveys, seems to reflect the Zillow pattern better than the OER pattern. Across the board, people seemed to experience a much higher level of inflation compared to what actually made it into the official data.
Now, the OER is “catching up,” and we seem (at least to some extent) to be letting what is likely a number higher than reality affect CPI - and in turn policy.
Why we talk about CPI, where shelter has a relative importance of 36%, with such obvious flaws, is beyond me! Supposedly, OER, at one time made sense, and was the best we could do (we also used to have to lace up sneakers), but does it make any sense today?
At Academy, we often discuss the risk of fighting the last war, and not only does the Fed seem to be fighting the last war, but they are also fighting it with bad intel!
… Bottom Line
The Fed will be more “plodding” than what the market has priced in.
U.S. 2s vs 10s is the least inverted since June 2022. Continue to look for “normalization” as the Fed can control the front end, but not much on the back end.
While we had been looking for weaker economic data, I was shocked (painfully) by how quickly 10s moved and got below 3.8% to finish the week. I’m incredibly bearish, at least for a trade here, as I cannot find a reason (in anything I look at) to bring my range below 4% - 4.2%. I will have to adjust to the case that while we’ve been comfortable thinking about a slowing economy and lower inflation, it was not as widely held as we thought.
Stocks. We continue to think that we have not seen the bottom and that we will be lower at some point in August than we are today (cannot discount a possible bounce again from here, but am waiting for lower levels to buy this market). On the Nasdaq 100 the current target is 17,500. Just below the 200-day moving average, where we would expect support, though that is still above the April 19th low of 17,000. If anything, the risk of breaching that remains high. The S&P 500 is a bit trickier as it is still above the 100-day moving average, but 5,000 seems like a good target (the 200-day moving average and the April lows).
Buy energy here on the recent weakness. Yes, the economy is slowing. There are more and more questions about whether AI, Data Centers, etc., and everything associated with it (power for example) got ahead of itself, but geopolitical risk is extremely high and anything we see on that front will lead to supply shocks for energy.
Credit. Should outperform, but it will start moving much more in line with equities as the equity move is starting to reflect more than just valuation concerns. Credit spreads were well protected against valuation concerns but will not be as protected as we move into “bumpy” landing concerns. Lower Treasury yields won’t help spreads, and we should see a much larger than expected August calendar develop to take advantage of the move in all-in yields.
Holy recession, Batman! We’ve been on the side more concerned about the economy for some time now. It felt like we were swimming upstream at times, and Wednesday’s stock surge felt like we were swimming in a baby pool “closed for maintenance.” Then suddenly recession is on the tip of everyone’s tongue! Deservedly so, but wow, did that happen fast!
Good luck, as this summer is turning more turbulent rather than less turbulent!
… AND a live look in as Global Wall heads TO work …
Freaking EXCELLLENT! Being on the road Hotspoting had to set up in Starbucks to up my data plan cause when IT'S hitting the fan I need my Bond Beat Man!
-DMB's been banging her shoe awhile now that the recession will be backdated to Oct 23. Think I subscribe to the Rosie thesis-a mild and very extended recession, w/a slice of CHS (Charles Hugh Smith), that the usual QE & ZIRP tricks won't have their previous effectiveness.
-Any thoughts on the thesis that BoJ's inadvertently popped the Yen Carry Trade & Everything Bubble? I'd say Lets Hope So, but we're probably getting ahead of ourselves there.


Just a Fantastic newsletter !!!
"Adult Swim"......cracking me up....
Wish I could get into my Schwab and ThinkorSwim open and I'd buy a little...
Schwab fails again.....just when you need them the most
Anyone else having this trouble ???
My Quick Take:
This is not 1987......I was there in the market, back then...
Even after 1987, the market recovered nicely
This is a Hedge Fund Panic and it's overdone...
Sure the NFP was weak, partly due to the hurricane in TX....
Patience......
Take a walk......turn off the screen.....well, I can't turn mine on..
I am able to look at my watchlist on CNBC, so I see what's happening...
This is not totally unexpected....
Hang in there.....
Some day the Fed will start cutting...
Some day the election will be over.....
The sky is still blue....
Freaking EXCELLLENT! Being on the road Hotspoting had to set up in Starbucks to up my data plan cause when IT'S hitting the fan I need my Bond Beat Man!
-DMB's been banging her shoe awhile now that the recession will be backdated to Oct 23. Think I subscribe to the Rosie thesis-a mild and very extended recession, w/a slice of CHS (Charles Hugh Smith), that the usual QE & ZIRP tricks won't have their previous effectiveness.
-Any thoughts on the thesis that BoJ's inadvertently popped the Yen Carry Trade & Everything Bubble? I'd say Lets Hope So, but we're probably getting ahead of ourselves there.
-Again awesome many thanks!