Good morning…build it (concession) and they came and there is a growing interest in one of the worst asset classes — many still view bonds as uninvestible or tradeable — and this even BEFORE the latest quarterly from HOISINGTON drops.
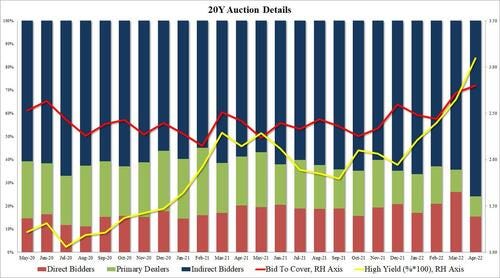
Yesterdays liquidity event went off without a hitch and demand was, by the metrics the pros follow, at a RECORD. ZH:
Blockbuster 20Y Auction: Record Bid To Cover, Record Indirects; Record Stop Through … The bid to cover jumped to 2.80, up from 2.72 in March, and also a record high. The internals were also record, with Indirects taking down a whopping 75.9%, up a whopping 11.5% from March's 64.4%, and the most on record, not to mention well above the six-auction average of 63.9.%. And with Directs awarded 15.3%, modestly below the recent average, Dealers were leff holding just 8.7%, also the lowest on record!
Okie dokie. Makes ME think to NEXT TICs report after the most recent Good Friday edition (when almost nobody was lookin, DB noted it HERE)
… here is a snapshot OF USTs as of 706a:
… HEREis what another shop says be behind the price action, you know,
WHILE YOU SLEPT Treasuries are lower while the curve is mixed ahead of TIPS supply and Powell's IMF presentation at the same time (1pm). DXY is lower (-0.37%) while front WTI futures are +0.75%. Asian stocks were mixed (SHCOMP -2.3%, markets outside China mostly higher), EU and UK share markets are all higher (SX5E +1.4%, France's CAC 40 +1.75%) while ES futures are +0.8% here at 7am. Our overnight US rates flows saw more post-Bullard (we may need to go 75bp) flattening via blocks (FV/UXY). Despite that, our cash flows were a counter with real$ a better seller in 10's and the long-end during Asian hours, lifting the curve off its Asian lows into the London open. Overnight Treasury volume was about AVERAGE overall with the highest relative average turnover seen in 2's (150%).
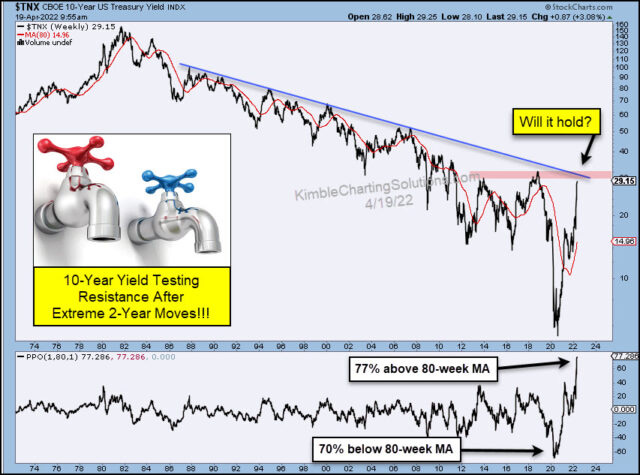
… Treasury 10yrs, monthly: In prior bond market sell-offs, investors have seen handsome payoffs after buying 10's at 3.00% and just above. So yesterday's bull-rush into the long-end might not seem so out-of-order in that light. However, our next attachment drops a warning that this time could be different, over time...
Treasury 10yrs, quarterly: This chart zooms out enough to see the entirety of the secular bull channel , now broken. Quarterly momentum (lower panel) strongly hints that a new macro bear phase is in motion and probably on rails for at least the next ~12 months as a guess? Indeed, that cluster of 2009-2010 quarterly highs at ~4.00% looks like a legit topside support/target given the momentum set- up …
Some food for thought as bulls and bears CONTINUE to fight this one out
… and for some MORE of the news you can use » IGMs Press Picks for today (21 April) to help weed thru the noise (some of which can be found over here at Finviz).
Now in as far as a few things which Global Wall Street is sayin / sellin that caught my eyes, BAML isn’t the only one out there ‘leanin long’ 10s (out with an update just yesterday, “Going long US 10y notes”
NWM: US Rates: Peak Hawkishness The goalpost for Fed hawkishness was shifted last week after Bullard mentioned 75bps. We do not see that materializing and think the message for this FOMC meeting has been clearly communicated – expect a 50bp hike and an announcement of QT. With markets pricing in 3.25% in terminal rate and long rates comfortably above our forecasts, we think markets have reached peak hawkishness and do not expect Powell to out-hawk markets. Due to the volatile environment in rates, we suggest scaling into longs in 10s and will look to add more if yields jump to the 3.20% area, just below the 2018 yield highs.
… We acknowledge the difficulty of entering an outright long position, and recognize the risk of doing this ahead of Powell’s speech as well as the meeting itself, thus we only recommend 50% of normal risk, with room to add into and after these events if yields move back higher…
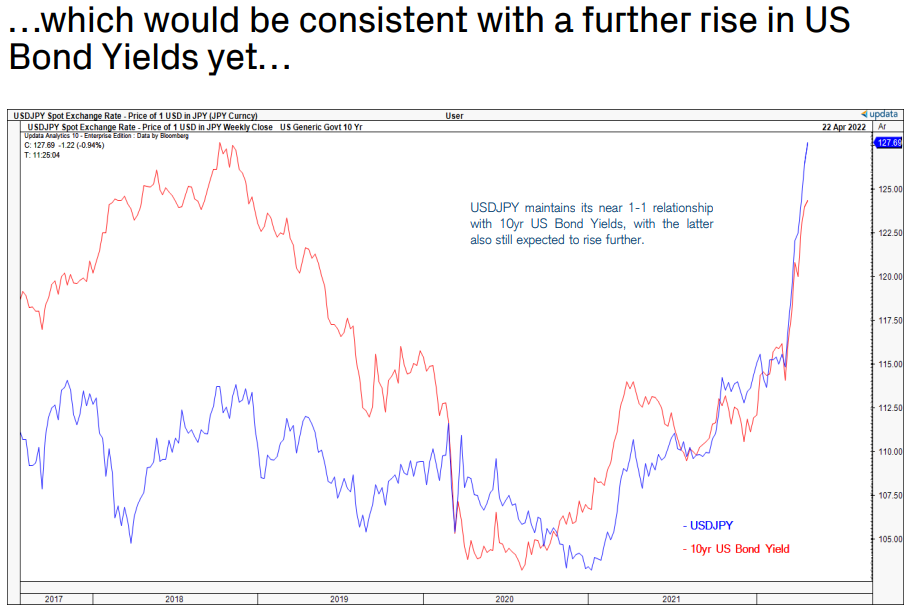
And for the other side of the coin — 1stBOS weekly macro charts which this week focus on USD, specifically related in this way,
* The dramatic strength in USDJPY looks to be finally stalling near term at 130 but although we see risk for finally a pause in the rally and some consolidation the bigger picture outlook stays seen constructive and a sustained move above “neckline” resistance at 127.33 would suggest we are seeing the completion of an even larger multi-year secular base…
* … reinforced by the recent long-term breakouts in both US 10yr and 30yr Bond Yields, which suggests yields will continue to move higher over the medium-term. We still look for a move to 3.21/26% in the US 10yr Bond Yield.
Perhaps they are both saying the very same thing with ultimate focus then on a DEEPER SELL OFF taking 10yy up nearer 3.20%?
Or perhaps we’ve seen enough and the selloff will hold here and now.
I personally think the chance is the pendulum KEEPS swinging until such a time something — perhaps not something we’re expecting (housing, consumer, stocks, repo market) BREAKS.
Financial conditions are still a bit too easy and global central banking community seems to be on a mission and feel as though they can get away with all of this without consequence? Yesterday’s mortgage applications data? Detailed HERE by Prof Sanders
Finally, what I believe is going on whenever JPOW picks up the phone to talk offline with Lagarde,