Good morning and welcome to THE longest day of the year. The LONG bond appears to be up marginally on the day but relatively CALM
‘Posting’ and flow of informational updates / links will be light this week. Family in town celebrating ‘Thing 2’ graduating from HS and, well, summer.
… here is a snapshot OF USTs as of 724a:
… HEREis what another shop says be behind the price action, you know,
WHILE YOU SLEPT Treasuries are lower with the curve steeper out to 20yrs with Treasuries underperforming their little-changed German (bunds were weak yesterday) and UK peers after yesterday's US holiday. DXY is lower (-0.5%) while front WTI futures are higher (+1.6%). Asian stocks were largely in the green overnight (NKY +1.85%), EU and UK share markets are all higher (SX5E +1%, SX7E +1.95%) while ES futures are showing +1.8% here at 7am. Our overnight US rates flows saw better real$ selling in 10yrs during Asian hours- during a pretty quiet overall session there. During London's AM hours, volumes remain subdued with decent 2-way activity in the front end of the curve noted (banks and EU asset managers) with more outright selling in intermediates from Asian real$. Fast$ names added steepeners (10s30s, 5s30s) too. Overnight Treasury volume was ~70% of average overall though 20yrs (115%) saw some relatively elevated turnover ahead of the 20y auction this week.
… US news: Stocks historically don't bottom until the Fed eases WSJ Small businesses struggle with hiring as inflation takes a toll WSJ Construction companies stymied by labor shortages as $1tln infrastructure spending kicks in WSJBullard: I hope US economy repeats 1994's soft landing RTRSMester: Inflation will not fall to 2% target for two years RTRSBostic: Policy needs to be more 'muscular' to battle high inflation RTRS Summers: US needs 5% unemployment for 5 years to ease inflation BBG Bank stress test results are due in on Thursday RTRS Despite another Covid surge in the US , deaths stay low as most Americans carry some immune protection NYT
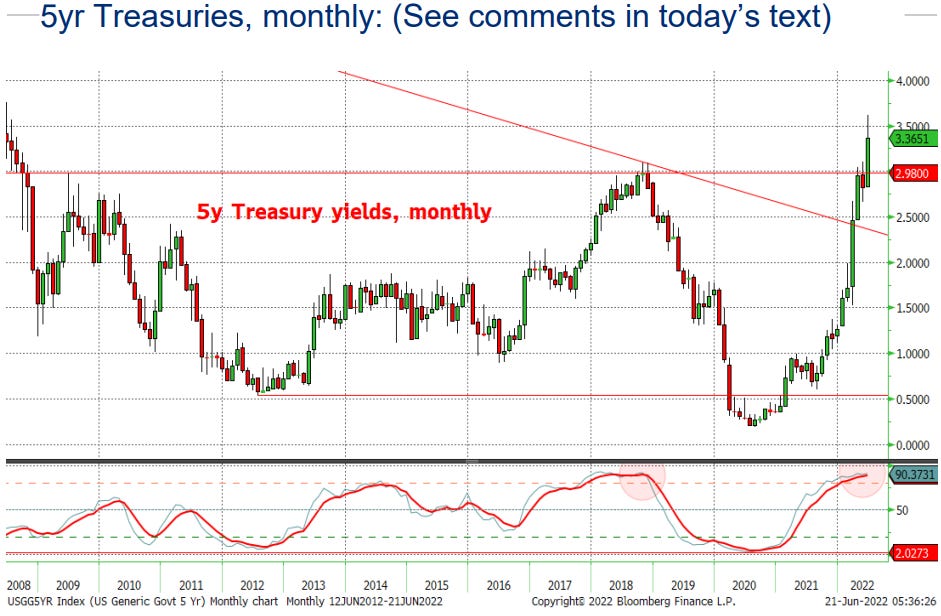
… UST 5yrs, monthly: 5's are now deeply 'oversold' on a long-term basis- which is what one might expect after the steady rise in yields off the pandemic-era lows. That said, the long-term momentum set-up today looks very much like it did near the end of Q1 2018, level-wise. Back then, rates still ground higher over the following ~6mo before reversing. There is no evidence of a trend reversal yet (as in late 2018) so we'd guess that the skew of rates risks remains on-balance bearish despite the 'oversold' condition.
… and for some MORE of the news you can use » IGMs Press Picks for today (21 June) to help weed thru the noise (some of which can be found over here at Finviz).
Here are a few items from the Global Wall Street Inbox which may help get you to and through this mornings data (sellside and some calendars HERE)
… We are downgrading our GDP forecast to reflect this additional drag. We continue to expect 2.8% growth in 2022Q2, but have downgraded 2022Q3-2023Q1 to 1.75%/0.75%/1%, which implies 2022Q4/Q4 growth of just 0.9% (vs. 1.3% previously) and 2023Q4/Q4 growth of 1.4% (vs. 1.6%). Following these changes, our real GDP growth forecasts are now even further below current consensus estimates for the next two years.
We now see recession risk as higher and more front-loaded. The main reasons are that our baseline growth path is now lower and that we are increasingly concerned that the Fed will feel compelled to respond forcefully to high headline inflation and consumer inflation expectations if energy prices rise further, even if activity slows sharply. We now see a 30% probability of entering a recession over the next year (vs. 15% previously) and a 25% conditional probability of entering a recession in the second year if we avoid one in the first year, implying a 48% cumulative probability at a two-year horizon (vs. 35% previously).
Why not even higher? The war and further commodity price shocks have admittedly made the echoes of the 1960s and 1970s ring louder. But we are skeptical that hot wage growth and high inflation expectations are as entrenched today as back then.
What might a recession look like? With no major imbalances to unwind, a recession caused by moderate overtightening would most likely be shallow, though even shallower recessions have seen the unemployment rate rise by about 2½pp on average. One additional concern this time is that the fiscal and monetary policy response might be more limited than usual.
There. THEY have said it and opened the door so NOW the administration can begin (continue) to admit it may actually be so? Said another way, as we watch this recession ‘conspiracy theory’ morph into …
More importantly, if / when realization sets in, how should we expect central bankers to react? Enter same firm — Goldilocks — on alleged FED (et al) PUT
With our view for lower multiples and earnings now more consensus, the markets are more fairly priced. However, it does not price the risk of a recession, in our view, which is 15-20% lower, or roughly 3000. The Bear market will not be over until recession arrives or the risk of one is extinguished.
Please refer then back TO Goldilocks in as far as potential CB PUT — suppose we’ll be HOPING for an ECB ‘sticksave’?
Since we’re talking about stocks and Mike Wilson of MS is at the center of everyone’s attention (haters gonna hate), HEREis one from BBG which puts it all quite simply
Where’s the bottom? That’s the question on a lot of minds as all manner of assets come tumbling down, but especially when it comes to equities. The stunning pandemic-era rally in US stocks sealed for many the concept that any dip should be bought because a fresh rally would inevitably break out. Now that inflation has soared and the ultra-accommodative Federal Reserve has turned uber-hawkish, the script has been well and truly flipped.
One possible line in the sand to keep an eye on would be the 3380-3390 level for the S&P 500 Index. That’s where the gauge topped out in February 2020 before Covid-19 struck, and where the post-stimulus rally wobbled in late 2020 before rocketing higher. The Fed’s 75-basis-point rate hike last week took its benchmark back to where it was before Covid, so it would be apt for stocks to go back to the start line. The worry is that the Fed plans to hike rates much further, so that line in the sand could get washed away.
More if/when available (or necessary) … for now, HEREis what was said and noted this weekend (observations, calendars, etc)