Good morning / afternoon / evening (please choose whichever one which best describes when ever it may be that YOU are stumbling across this weekends note…
I’ll begin with a visual ‘question’ …
#Got5s? Gotta squint to see an oversold belly (moment - stochastics - bottom panel) on the weekly but with another rate hike coming, well, it makes some amount of sense … Furthermore, I’ll note some others / discussion of this in a moment … far better visuals and the like with some different (belly vs wings)context but first, given Friday’s NFP, I must begin with a couple observations from the WWW.
Before I do, though … Just before the data I heard BBG refer TO one of Global Wall Streets fan fav analysts (Ben Emmons) who’s proprietary model suggested jobs report of nearly 750k.
Dunno of his models (but do know HIM) and I’d ask over coffee IF I had the chance, how’s that working out for him and IF / WHEN he might be revising or ditchin’ the model … AND
ZH: June Payrolls Tumble To 209K, Lowest Since 2020 And First Miss In 13 Months, But Wages Come In Hot
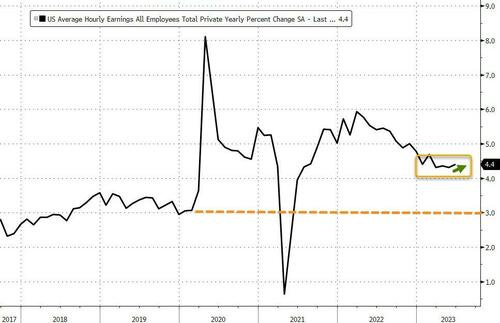
… And with the unemployment rate stubbornly hot, hourly earnings also came in hotter than expected, with average hourly earnings rising 0.4% in June, more than the 0.3% expected, and unchanged from last month's upward revised print. On an annual basis, hourly earnings were also flat, at 4.4%, and also came in hotter than the 4.2% exp.
Specifically, average hourly earnings for all employees on private nonfarm payrolls rose by 12 cents, or 0.4 percent, to $33.58. Over the past 12 months, average hourly earnings have increased by 4.4 percent. In June, average hourly earnings of private-sector production and nonsupervisory employees rose by 11 cents, or 0.4 percent, to $28.83.
There was a welcome change in the average weekly hours, which rose fractionally from 34.3 to 34.4, just above the expected 34.3 print. In manufacturing, the average workweek was unchanged at 40.1 hours, and overtime was unchanged at 3.0 hours. The average workweek for production and nonsupervisory employees on private nonfarm payrolls remained at 33.8 hours.
Looking at the composition, we find something bizarre: the biggest contributor to the 209K print was government…
AND then,
WolfStreet: The Long View of Job Growth by Industry: Some Gained Jobs; at Others, Jobs Got Crushed
Read more and ALL ‘bout it but … see whatever it is your PnL wants to see, I suppose.
Slowing growth AND / or HOT earnings — kindly let me know whenever you figure out IF this was GOOD news (and if then it was bad) … thank you.
In as far as those who I believe are paid by the word to figure all this out — creating daily, weekly, monthly and then yearly narratives — have plenty to say. Without further delay, on TO someweekly NARRATIVES where I’d highlight,
BNPnotes H2 starting with, “… backdrop of accelerating global liquidity CONTRACTION and a shift in rates market tone …” (visual) JPM — buybelly (5s) VS wings (3s10s) MSs Sunday Start: Battered and Bruised, Bonds Ready for a Comeback MS: Toward Inflation Deceleration … Go Long Duration – Buy 5s
INTERRUPTING here to mention / note MS offers 7 solid reasons for going long here and now — SEASONALITY and pension fund rebalancing demand are a couple of them — have a look / enjoy / and let me know YOUR thoughts …
June’s report was broadly consistent with a still strong jobs market that remains far too tight for most policymakers’ comfort level. While job growth slowed, it was hardly the slowdown that would have been anticipated from the massive efforts to cool wage growth and inflation pressures. One month does not make a trend, but it does breathe new life into longstanding debates over where exactly the U.S. economy and labor market are headed. Focus on the slowing trend, and there is hope that the worst is behind; focus on the levels, and it’s impossible not to conclude that the labor market is still too hot to handle.
AND from FirstTRUST,
Data Watch - Nonfarm Payrolls Increased 209,000 in June
… Implications: A hint of tepidness in the June labor market, but only a hint…Note that the birth/death model only added 26,000 to payrolls in June itself, well below the average of the past year. Ultimately, the Fed wants to see either a big drop in inflation or a substantial worsening in the labor market before it can relent. We don’t think the inflation figures will improve fast enough for the Fed, which means it will feel pressure to maintain a tight enough monetary policy until it sees unemployment heading up while payrolls are heading down.
The economy’s growth engine is still revving. So far this week, a string of strong data has sent bond yields soaring (the 10-year Treasury yield topped 4% again for the first time since March), and in turn, stocks have waffled.
The debate: Bears are questioning whether it’s all just too much of a good thing. The stronger the economy stays, the more the Federal Reserve may have to hike rates, and the greater the risk it could all come crashing down (even if it happens later). On the other hand, bulls might say it’s a good thing the economy is healthy, especially given that inflation is falling in the midst of it all and corporate earnings are still solid.
Our take: Building a thoughtful multi-asset portfolio means investing for the possibility of a range of scenarios. Taking what we know in balance, we believe stocks will come out from this period of uncertainty on top, bonds have an even better entry point today, and alternatives can offer both diversification and exposure to difficult-to-access trends
… …over 90% of bonds in Bloomberg’s U.S. Aggregate Bond Index are trading below par.
The index is also down almost 15% from its all-time highs. This offers a compelling entry point. What’s more, with yields this high, being embedded is a pretty good buffer against rates moving higher. For instance, a 10-year Treasury bond yield would need to rise another ~50 bps (to 4.55% from today’s 4.05%) to eat up your return over the next year…
LPL on correlations of H1, H2 and HISTORY (for those who wish NOT to repeat),
The second half is off to a relatively slow start as the S&P 500 battles overbought conditions and a backup in interest rates.
Economic resiliency and a tight labor market have kept Federal Reserve (Fed) rate hikes on the table, along with hopes for a soft landing scenario.
Correlation analysis comparing the first half of prior years to 2023 suggests history is on the market’s side. Of the 10 highest correlated first halves to 2023 (since 1950), the S&P 500 generated average and median gains of around 12% in the second half, with nine out of 10 periods producing positive returns.
The year 1995 stands out with a high correlation to 2023 and a relatively similar macro backdrop to now. During the first half of 1995, also a pre-election year, the Fed paused an aggressive rate hiking cycle after tackling higher inflation and avoided a recession. The soft landing helped drive the S&P 500 up 13.1% in the second half.
Of course, this observational data comes with the major asterisk of correlation does not imply causation. And while history may not repeat, it often rhymes, which would be a welcomed sign for the second half.
… SUMMARY Stocks have struggled out of the second half gate after facing headwinds from a backup in interest rates and overbought conditions. Correlation analysis comparing the first half of prior years to 2023 suggests history is on the market’s side. Of the 10 highest correlated first halves to 2023 (since 1950), the S&P 500 generated average and median gains of around 12% in the second half. One of those years is 1995, which was also a pre-election year with a similar macro backdrop to today. While the 13.1% second half gain in 1995 may be a little too optimistic for 2023, the analog at least provides some framework for the potential size and scope of a second half advance if the economy avoids a recession.
Here’s one for those looking at FF futures (wait, I thought those were no longer a thing … oh wait, nevermind, that was LIBOR)
At the beginning of this year we said that the Fed would move to 5% on the overnight rate and sit tight for the remainder of the year as we navigate the uncertainty of the economic environment. It’s been a bumpy road along the way with the bank failures and disinflation, but the more recent economic data points to the Fed remaining “higher for longer”. While our base case is a “muddle through” economy for the next few years the “higher for longer” case exacerbates the risks of some of the outlier scenarios because it forces more firms and households to adjust to the new high rate environment. For instance, firms with a low cost of capital are now being forced to renew contracts at these higher costs. And the longer this goes on the more this impacts more debt contracts. This is one of the primary reasons Monetary Policy has famous lags – it takes time for debt contracts to renew and rollover. Credit doesn’t tighten overnight because most debt contracts aren’t overnight contracts.
… The good news about higher for longer is that conservative investors are having a field day with cash. We haven’t seen 6 month T-Bills at 5.5% for 20 years. You can build a 3/6/9/12 month ladder of T-Bills right now with an average yield of 5.51% with no state taxes. This will beat virtually any conservative high yield savings account, especially after taxes and fees. And the really good news about “higher for longer” is that Fed Funds Futures are now forecasting little/no change in interest rates until almost halfway through 2024. In other words, if you build a T-Bill ladder today you have a very high probability of being able to lock-in 18 months of 5% returns with no principal risk. That’s one heckuva good deal if you need liquidity and certainty in the coming years.
If you’d like help building a T-Bill ladder of your own …
AND … sure, just reach out to THEM for help there if you wish.
Moving along and to something a bit more funTERtaining, a couple resources / links / visuals related TO the one, the only, the most hated portfolio construct idea … 60/40.
… Stocks and bonds have carried low to negative correlation most of last 25 years and have worked as portfolio diversifiers for each other. For that reason, the 60/40 portfolio has served investors as the foundation of a well-balanced and well-diversified portfolio that can benefit from each asset class’ strength and weather through different phases of economic and market cycle. That said, it’s worthwhile to note that was not the case in prior decades, and even during the last 25 years, there have been times when the correlation broke and both asset classes sold off at the same time. They have been triggered by different reasons – sometimes fear of economic and market health driven, like the 2008-2009 Great Financial Crisis or March 2020 Covid-19 outbreak when investors opted for cash above other financial instruments to safeguard their assets, some other times policy action driven, like the Fed’s rate hikes in 2022 where high inflation and rising interest rates put pressure on corporate profits and also drove bond prices down. Regardless of the reason, these time periods raised questions on what else could be added to the 60/40 portfolio to manage the potential downside and improve overall risk/return profile.
We believe alternative investment strategies can be a key answer for these questions…
AND from the now fading TWITTERsphere … cuz, you know, everyone’s moving to THREAD TIL THEY ARE DEAD (? not there yet … personally)
So you're overweight bonds and underweight stocks? Be aware that stocks relative to bonds made another new all-time high this week. No one knows when this will stop, but until it does, OW stocks makes a lot of sense to CARSON RESEARCH
For something related TO 60/40 but likely behind ‘paywall’,
Goldilocks: Disinflation reduces 60/40 portfolio frustration — Revisiting our ML model
The disinflationary momentum since Q4 last year has been a major reversal of last year’s ‘high and rising inflation’ regime, which triggered a large drawdown for 60/40 portfolios. Inflation has declined materially from elevated levels (nearly as much as during the GFC) but without much growth damage, creating something similar to ‘Goldilocks’ momentum for markets - this has been a key tailwind for 60/40 portfolios YTD.
Continued disinflation into 2H should lower the risk of further 60/40 drawdowns. Based on our new business cycle machine learning (ML) model the tail risk for 60/40 portfolios, both left and right, has eased. A material acceleration of inflation would be needed to increase 60/40 drawdown risk over the next 12 months - a soft landing with a gradual moderation in risk appetite from current elevated levels would increase 60/40 right tail risk.
With higher yields, continued disinflation momentum and slowing central bank tightening, bonds are getting more attractive - also they helped buffer equities during the US regional banks crisis. However, with the yield curve near peak inversion, cash remains a serious competitor for fixed income broadly - investors need to balance the yield that is sacrificed with allocations to longer duration bonds with the risk-reduction benefits in a portfolio context.
…Exhibit 4: The risk of 60/40 drawdowns has eased but could increase again with stickier inflation Random Forest probability estimate (dotted lines denote unconditional probabilities). The bar chart shows the decomposition of the current probability (latest score in brackets)
So with STOCKS — STILL and ALWAYS — for the long run in mind then you must know what to do, right?
… Buyers of TLT are living in the past. The world has changed, and TLT looks a good short.
With a long, winding road considering GOLD, SHALE and, well, you know what to do … OR NOT … (Got5s — MS above?)
To be sure, MS (and myself) not alone in considering some value or place in a portfolio FOR FI …
Commonwealth: 2023 Midyear Outlook: Fixed Income May Offer Compelling Options
… U.S. Treasuries Look Attractive Amid Fed Inflation Fight U.S. Treasury securities have been a popular choice for investors this year. A combination of higher short-term rates and the relative safety that comes with government-backed debt has helped spur demand.
Short-term rates have risen, in large part, because of additional rate hikes from the Fed, as the central bank tightened policy in the first half of the year to combat inflation. At the end of June, the upper target on the federal funds rate was 5.25 percent following three 25-basis-point hikes in February, March, and May. This slowdown in the Fed’s tightening cycle helped put pressure on inflation without causing market declines.
We’re seeing encouraging signs that the worst is likely behind us. After peaking at 9.1 percent last June, year-over-year consumer inflation came in at 4 percent in May. If we continue to see progress in the Fed’s fight again inflation, Treasuries at current yield levels would be an attractive choice for investors…
One last link / visual for your 60/40 consideration,
Chart of the Day: 60/40? -- S&P 500 vs T-Bonds How are U.S. Treasury bonds holding up?
Today’s chart answers that question by presenting the total return trend for both the S&P 500 and S&P U.S. Treasury Bond 20+ Year Index.
Today’s chart illustrates that, from 2000-2008, U.S. T-bonds (orange line) outperformed stocks (blue line) and with much less volatility.
Since 2009, however, stocks have outperformed.
Of note… T-bonds have gained a rather modest 27% since 2009.
ALWAYS and forever gotta be 2 sides to a single trade … buyers meet sellers be like LETTERMAN …
AND for any / all (still)interested in trying to plan your trades and trade your plans in / around FUNduhMENTALs, here are a couple economic calendars and LINKS I used when I was closer to and IN ‘the game’.
First, this from the best in the strategy biz is a LINKthru TO this calendar,


Great work as always