weekly observations (12.02.24) and a monthly chart; "Happy bonds = happy stocks in 2025" -BAML
Good morning / afternoon / evening - please choose whichever one which best describes when ever it may be that YOU are stumbling across this holiday LONG weekends note…
… a bullish MONTHLY development, for sure. Momentum (stochastics, bottom panel) don’t seem to be sending as much or ANY signal so we’ll pay attention to December risk events …
December 6: NFP
December 11: CPI
December 18: FOMC
I’m going to follow with a visual from the inbox Friday morning BEFORE holiday-thin trading got underway …
…US 30y yields
… weekly slow stochastics is on the verge of crossing lower from ‘overbought’ territory in 30y yields, highlighting weak momentum and a bias for lower yields. We are testing support at 4.38%-4.40% (55w MA, 200d MA). Subsequent support at 4.35% (55d MA), while ST resistance is at 4.68% (Nov high).
… make as much or as little as you’d like and investigate all the rest of the more bullishly skewed bond techAmentals below, from one of, if not THE best in the biz.
Given that note hit inbox b4 Friday’s abbreviated trading session got underway, well, now for the rest of the day / week and month-ending trading activity, we’ll head TO the intertubes and catch up on Friday …
ZH: Stocks, Bonds, & Crypto Rally As Rate-Cut Odds Rise On Worst Macro Week In 5 Months
'Bad' news was good news during this thinly traded holiday week...
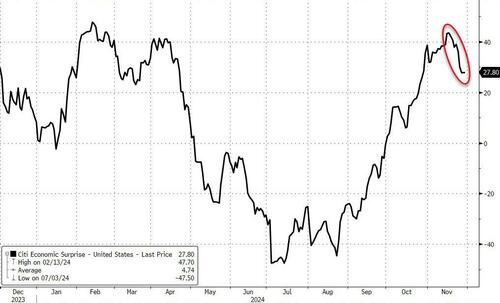
… This was the worst week for US Macro data since the first week of July...
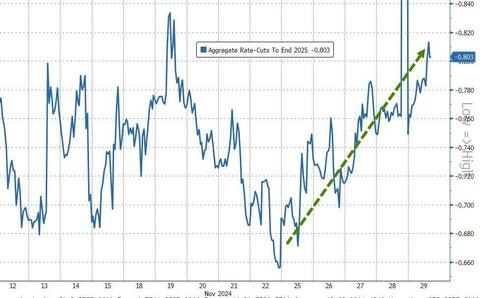
...and that 'bad' news prompted a renaissance in rate-cut odds bets (the market is now pricing just over 3 cuts into the end of 2025)...
Yahoo: Stock market today: Dow, S&P 500 close at record highs to cap winning month for US stocks
CNBC: Dow jumps nearly 200 points to record in short session, S&P 500 posts best month of 2024
The Dow Jones Industrial Average and S&P 500 rose to new heights on Friday amid a shortened trading day that will cap a strong month for equities.
The broad S&P 500 added 0.6%, while the Nasdaq Composite jumped 0.8%.The Dow Jones Industrial Average climbed 265 points, or 0.6%, also hitting a new all-time high.
Some of the upward momentum came from chip stocks, which popped after Bloomberg reported that the Biden administration was considering additional barriers on the sale of semiconductor equipment to China that weren’t as strong as previously expected. Lam Research rallied more than 3% while Applied Materials and Nvidia each jumped more than 2%. The iShares Semiconductor ETF (SOXX) added more than 1.5%.
To be sure, it was a broad advance that propelled the S&P 500 into uncharted territory. About 4 out of every 5 S&P 500 members, and all 11 of the sectors that comprise the benchmark, headed for gains in the session.
Those moves come as traders look to the end of a winning week and month. November trading largely centered on the postelection rally seen on the back of President-elect Donald Trump’s victory.
The Dow has added 1.6% week to date, bringing its gain for November above 7%. The S&P 500 and Nasdaq Composite have each advanced 1.2% on the week, and are now tracking to end 2024′s penultimate month higher by more than 5% and 6%, respectively. With those gains, the Dow and S&P 500 are both on pace to notch their best months of 2024.
… That said, a couple more recent hits for some funTERtainment …
Bloomberg: Trump Demands ‘Commitment’ From BRICS Nations on Using Dollar
Trump has said he wants US dollar to remain reserve currency
US president-elect reiterates threat to impose ‘100% tariffs’
Bloomberg: Black Friday Sales Accelerate With Online Spending a Bright Spot
Retail sales grew 3.4% while in-store purchases were up 0.7%
US consumers are seeking bargains after the bite of inflation
… Ok I’ll move on AND right TO the reason many / most are here … some WEEKLY NARRATIVES — SOME of THE VIEWS you might be able to use — THIS WEEKEND, a few things which stood out to ME from the inbox, presented without commentary, just a few links and relevant and of interest (to ME, anyways) excerpts …
BARCAP: Global Economics Weekly
Let the deals beginTrump fired a first salvo of tariff threats against Mexico, Canada and China, likely aimed at strengthening his negotiating hand. In Europe, France needs a budget deal to avoid a political crisis, while euro area inflation was a tad softer. Next week's US jobs report is crucial for the Fed.
…US Outlook
The return of the tariff: Warning shots fired
The president-elect gave an early demonstration of his intent to use tariffs as a tool for foreign policy objectives, signaling new levies on China, Canada, and Mexico linked to migration and drug enforcement. Amid policy and measurement uncertainty, the FOMC signaled its intent to ease graduallyBNP: US payrolls rebound, but no post-election bump
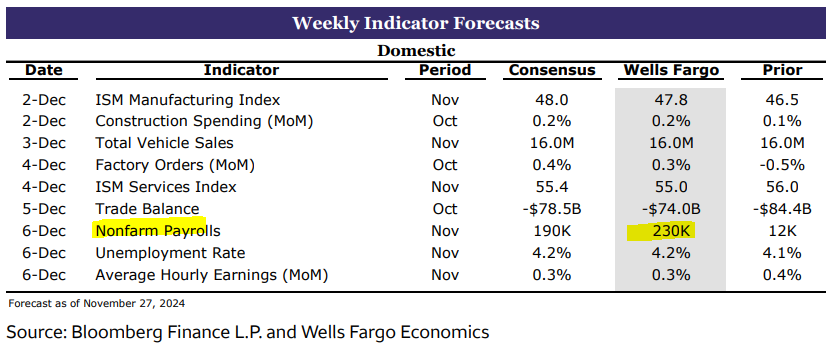
In the US, we expect a significant rebound in nonfarm payroll employment to 225k in November, with the unemployment rate edging up to 4.2%….
No additional post-election bump to November payrolls: We look for a rise in nonfarm payroll employment of 225k in November, rebounding from storm and strike effects in the previous month. For more, see US November jobs preview: Storming back, but clouds may linger, dated 27 November.
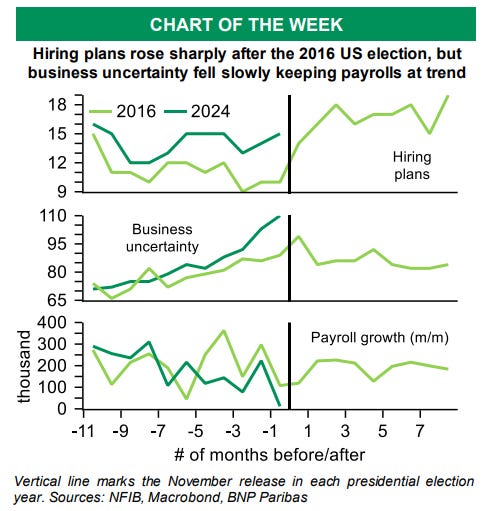
Although we suspect that pre-election uncertainty has played a role in restraining hiring of late, this report (due on 6 December) may be too early to reveal a clear unlocking of previously postponed hiring. Uncertainties about tariffs, immigration and fiscal policy remain.
The 2016 experience shows that, while it led to business plans for more hiring, a resolution of pre-election uncertainty can take time to show up in actual payroll statistics. In 2016, November payrolls printed at 178k in the original report, almost exactly equal to the average of 175k posted over the prior three months. Back then, payroll growth did not materially break out of that trend, clocking in at 180k on average in H1 2017 in the real-time data.
BofA: The Flow Show
Go BIG in 2025Scores on the Doors: crypto 82.0%, gold 27.4%, stocks 20.2%, HY bonds 8.0%, US dollar 4.7%, cash 4.8%, IG bonds 2.8%, commods 2.6%, govt bonds -1.9%, oil -4.1% YTD.
November “Winners” & “Losers”: Bitcoin 31%, speculative tech (ARKK) 23%, US banks 14%, US small cap 10% vs China -6%, gold miners -8%, renewables (TAN) -10%.
The Biggest Picture: big policies, big moves, big tails…investment backdrop heading into '25 one of big US-RoW economic decoupling between aggressive US growth/trade policies set to exacerbate US boom/global bust (Chart 2), 124 global policy rate cuts (Chart 3), a Fed easing with 3% inflation, 5% to 4% policy rate (Chart 4), coming policy panic in EU/China, all at a time of expensive corporate bond & equity prices; 25% asset overshoots/undershoots in '25 more likely than year of mean reversion.
BofA: The Thundering Word
Year Ahead 2025: Go BIG in ‘252025: The Year Ahead
Booms, Busts & Tails: big policies, big moves, big tails: investment backdrop heading into ’25 one of big US-RoW economic decoupling between aggressive US growth/trade policies set to exacerbate US boom/global bust (Chart 2), a Fed easing with 3% inflation, coming policy panic in EU/China, all at a time of expensive corporate bond & equity prices. 25% asset overshoots/undershoots in ’25 more likely than year of mean reversionGo BIG in ‘25: our playbook: long “US boom”, short “global bust” plays in Q1 = big US dollar & equity overshoot; buy International stocks in Q2 on Europe & Asia policy panic; inflation to surprise to upside…long gold & commodities; more hawkish Fed = US Treasuries big buy at 5%; “bubble” risks best hedged with crypto & China stocks; we forecast contrarian outperformance of Bonds, International stocks, Gold vs US exceptionalism consensus.
BofA in ‘25: BofA economists forecast global “goldilocks” (3¼% GDP growth, 2½% inflation), big budget deficits (6-7% in US), and 124 global interest rate cuts (Chart 3); BofA strategists forecast 4-4½% US Treasury yields, tight corporate bond spreads (US IG 80-100bps), global stocks up, S&P 500 at 6666, gold hitting $3000/oz.
…Buy 5% US Treasuries
The history of equity performance after rare event of two consecutive 20%+ gains in S&P 500 shows big decline in yields in ’25 needed to prevent big equity reversal (see 1929/30, 1937/38, 1956/57), and catalyze further big gains (as was seen in 1997/98 - Table 1); ‘long bonds’ understandingly unloved heading into new year (82% of investors predict a steeper yield curve & just 8% expect an economic hard landing); we think bonds big opportunity in 2025, would be big buyer of US Treasury yield overshoot to 5%, a level that would induce a. volatility & risk asset losses, b. peak “inflation boom,” c. innovative solutions to reduce US budget deficit (e.g. new Government Sponsored Enterprise to boost US home equity lending, increase tax revenues, reduce interest payments – Chart 4); disorderly rise in bond yields biggest threat to stocks but we believe Treasuries more likely to end-25 <4% than >5%...allowing H1 global equity volatility to morph into 5-10% gains in global equities by end-yearCitiFX: US yields are tilting lower
Yields are coming lower after testing strong resistance levels last week. We remind that we are seeing signs of momentum drifting lower. In US 2y yields, we also note a potential short-term double top formation which would suggest a ~16bps move lower. More below:
US 2y yields
Yields are turning lower after coming up against strong resistance at 4.40%-4.42% (200d MA, 55w MA). As we had noted before, we are seeing signs of trend exhaustion, with triple momentum divergence in daily slow stochastics. In weekly slow stochastics, we are also on the verge of crossing lower from 'overbought' territory.On top of this, we are testing the neckline of a double top formation at 4.21% (November 19 low, double top neckline). IF we close below this, the formation indicated target would be at 4.04%.
All of the above leaves a picture of lower yields. The subsequent layer of support is at 3.98-4.04% (55d MA, psychological level and formation indicated target). Medium term downside support is at 3.55% (March 2023 low).
US 10y yields
After testing very strong resistance at 4.47-4.49% (76.4% Fibonacci, July high), we are coming close to the 4.18-4.21% support (55w MA, 200d MA). Weekly slow stochastics is on the verge of crossing lower from ‘overbought’ territory, suggesting a bias for a move lower in yields. A weekly close below 4.47-4.49% would reinforce this picture of lower yieldsThis would open the door to a move towards 3.60% (2024 low). We see interim support before that at 4.09% (55d MA).
US 30y yields
Similarly, weekly slow stochastics is on the verge of crossing lower from ‘overbought’ territory in 30y yields, highlighting weak momentum and a bias for lower yields. We are testing support at 4.38%-4.40% (55w MA, 200d MA). Subsequent support at 4.35% (55d MA), while ST resistance is at 4.68% (Nov high).Credit Agricole: 2025-26 Outlook: mind consensus
…US rates:
Despite the Fed cutting rates, the best trade in 2024 was staying in cash (or T-bills), certainly on a risk adjusted basis.
The cyclical bull steepening we were expecting came through but a progrowth Republican policy mix points to a very shallow cutting cycle.
A clean sweep suggests a high probability of election pledges being enacted boosting nominal growth but destabilising global trade.
The UST curve should remain dis-inverted but very flat. With Fed policy rates likely dropping to 4% only, 10Y yields should hover around 4.5%.
While QT should end, net UST supply of USD2.1trn should weigh on longend ASW. The debt ceiling debacle should be manageable.
Significant, fiscal driven bear steepening is not on our radar. The Fed should remain driven by its existing remit.
Large deficits and (financial) deregulation augers for higher growth implying the potential for higher UST real yields.
DB: Chart Of The Day - Treasury supply duration and term premia
We revisit a COTD from August 2023, which highlighted the beginning of a new duration supply cycle and the associated change in Treasury term premia. As anticipated, since publication of that note, term premia rose in step with an increase in the duration of Treasury supply, which we express as the 10-year equivalent of net issuance of notes and bonds. The correlation between changes in term premia and the duration of Treasury supply has been consistent across four cycles (three rising and one falling) since 2018, as shown in today's chart.
Looking ahead to 2025, we expect term premia to continue rising toward their historical levels, although this probably won't be associated with another large increase in duration supply. While the fiscal outlook for the next four years is hugely uncertain, our baseline forecast for Treasury issuance entails a modest decline in the 10-year equivalent measure during the first half of 2025, primarily due to higher rates reducing the duration of newly issued long-dated securities. In the second half, we anticipate a gradual increase in the duration supply as the Treasury begins to raise auction coupon sizes again. These increases are expected to be smaller than those seen in 2023. Nevertheless, term premia remain meaningfully below their long-term average and depressed within a fair-value framework of volatility and free-float sovereign bonds, keeping us biased toward their higher levels.
MS: Where Are We Most Out of Consensus for 2025? Key Debates in Under 5 Minutes: November 2024
Q1: What's the path for US growth and inflation in 2025? It depends on policy sequencing
Q2: How much can the Fed cut in 2025? 75bp in 1H25
Q3: Will UST yields be driven higher next year from new policies? No, we see UST 10Y yields lower to 3.55% by end-2025
We expect UST yields to move lower over 2025, despite inflationary risks from tariffs. Our economists see the fed funds rate at 3.625% by May, which is ~60bp lower than markets currently price in. As the impact of tariffs hits the real economy in 2H25, we think that investors will continue to buy Treasuries because weaker growth should eventually more than offset tariff-induced inflation. These factors, combined with an improved carry profile, should help bonds to rally throughout our forecast horizon …
Q4: How can Japanese equities do well if we expect JPY to strengthen? Domestic demand and corporate reforms should provide support
Q5: Do tariffs on China mean a faster, bigger reflation package from Beijing is likely? It depends
UBS: Budgets and bonds
The French budget and bond yields are attracting attention, with the media ever eager to spot another Truss debacle. This weekend will (presumably) see some fevered politicking in Paris as politicians try to come up with a budget that will not scare markets, but will also not lead to a collapse of the government. France’s deficit is not sustainable, but the government is not actively seeking to make it dramatically worse; so Truss analogies are probably inappropriate for now…
UBS: Supply and demand, and inflation
The release of the October broad measure of consumer prices in the United States, the PCE deflator, showed inflation that was unsurprising and broadly stable. The numbers are distorted by fantasy housing price measures, but measuring prices that actually exist in the real economy are rising less than 2% y/y.
The price data is not especially alarming. However, a note of caution is struck in the detail. Currently, supply issues are more important than demand issues in driving inflation.
The San Francisco Federal Reserve breaks down price data into supply and demand driven price changes. Essentially, if prices and consumption both rise in an unexpected manner, demand is likely to be driving inflation. If prices rise, but consumption falls in an unexpected manner, supply constraints are likely to be driving inflation. Since June last year, supply constraints have been more important than strong demand in pushing up prices.
That today’s inflation is driven more by supply than demand is relevant as the US enters 2025. Several possible US policy measures have supply chain implications—notably the threatened tax on consumers of imports (including companies using imports in their supply chains), and large-scale deportations of workers. The extent of future supply chain disruption will assume greater importance for future inflation.
… Moving along and away FROM highly sought after and often paywalled and Global Wall Street narratives TO a few other things widely available and maybe as useful from the WWW …
Apollo: Inflation Is Low But Living Costs Are High
The Consumer Price Index is 22% higher than in January 2020, see chart below.
This means that the prices of all goods and services that consumers spend money on are up, on average, 22%.
For example, since January 2020, the price of cereal is 30% higher, household electricity is 32% higher, and car insurance is 52% higher.
The bottom line is that the Fed’s preferred measure of inflation, namely year-over-year inflation, may be back near 2%, but the living costs for households are still dramatically higher than four years ago.
BESPOKE: Record High Bulls
…If you didn't see it yet, below is a look at an eye-opening stat from Conference Board's monthly Consumer Confidence survey. Since 1987, they've been asking consumers for their views on the stock market in the form of a question about whether they expect higher or lower stock prices over the next year. As shown in the chart below, the percentage expecting higher stock prices in the next year hit a record high of 56.4% this month!
Bloomberg: Wall Street Macro Traders Head for Worst Year Since the Pandemic
G-10 rates, FX desk revenues set to be the lowest since 2021
Coalition says margin compression is behind performance drop
… “2024 has been a year of sitting and waiting on the sidelines,” said Angad Chhatwal, head of global macro markets at Coalition Greenwich. “Hedge funds have come into the market sporadically around data points and events but they’ve not been as active on a continuous basis compared to previous years.”
Macro trading revenues have also been hit by tighter margins this year, Chhatwal said, as increasing industry competition and advancements in electronic trading weigh on prices…
the (LONG)View from London: Overweight & Nervous -> Complacency Abounds
Evidence the Bull Market is Tiring“Deutsche Bank on Monday set 7,000 points as the target for the S&P 500 index by the end of 2025, saying it expects robust earnings growth to continue into the next year, among other factors.
Earlier in the day, Barclays raised its 2025 forecast for the index (SPX) to 6,600 from 6,500, on the back of a resilient U.S. economy, [a] gradual decrease in inflation and robust potential earnings growth of mega-cap technology companies.”
Source: Reuters
As always when the next calendar year looms, Wall Street Strategists are falling over themselves to be bullish. Earlier this week, Deutsche bank’s strategist set a target of 7,000 for the S&P500 by the end of 2025. If that happened, it would mark a strong 3rd consecutive year in a row of double digit gains (i.e. 2023 = 24.2% return; 2024 on track for 26% at current prices; with then another 17% on top to reach 7,000 from current levels).
Moreover, it will mean that 6 out of the 7 years (up to end 2025) would have delivered double digit S&P500 returns (with most of them over 20%). As FIG 1 shows, that clustering of multiple years of strong gains is very rare (going back 70 years on this chart). Perhaps not surprisingly, the only similar looking cluster of strong years of SPX gains occurs just prior to the TMT bubble peak.
FIG 1: S&P500 annual returns (%) – past 70 years
McClellan: Credit Spreads Tell A Story - Chart In Focus
November 29, 2024
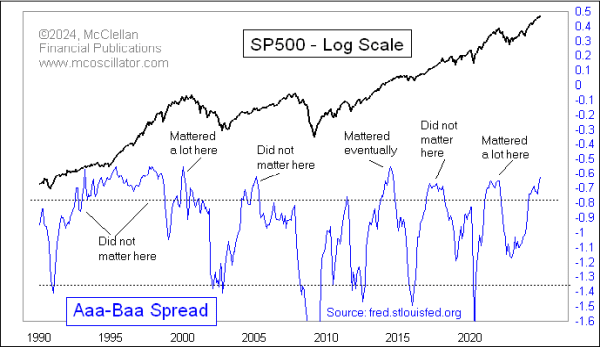
… Where the fun insight comes in is from looking at the spread between these two, known as a "credit spread". The amount of the difference between high quality and lesser quality bond yields tends to vary over time, depending on liquidity conditions and other supply/demand factors. This next chart looks at that spread.
A couple of points are worth explaining before I get to the analysis. I am portraying the spread here as the raw percentage point spread between Aaa and Baa yields. This math presumes that the difference between 10% and 11% is the same as the difference between 4% and 5% yields, and that presumption is arguably problematic. But trying to find a better way to portray such differences is also problematic…
…The key lesson, therefore, is that just because you see a tight credit spread (like what we are seeing now), and just because that means there is a lot of investor complacency, that does not mean it has to result in a big stock market decline right away. It can mean that, but it does not have to mean that.
So what good is looking at this relationship if it does not work consistently? Good question. First, it does work consistently for marking stock market bottoms when the credit spreads get really wide. And second, it is important for us to know that sometimes indications are not reliable. If someone tells you, "Credit spreads are narrow, and that means _____," what I want to achieve is for you to be skeptical of that assertion, and for you to go ask the data if it really does mean that.
NORDEA: Macro & Markets: System overload
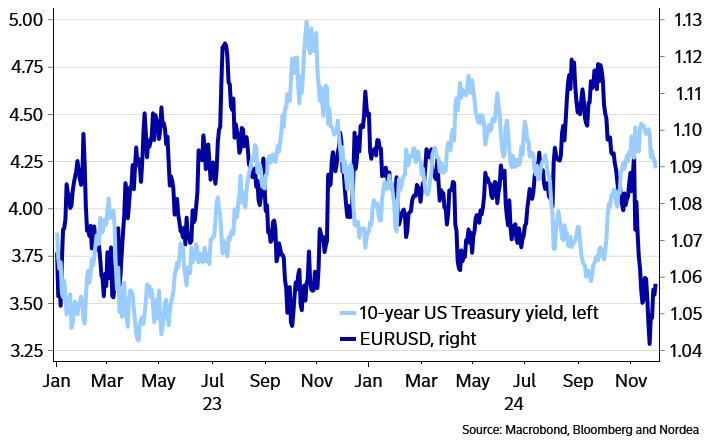
The Trump trade has taken a breather, while the ECB does not seem to be in a big hurry to accelerate its rate cuts. The amount of bonds hitting the market will be huge going forward, which could mean large spread and yield moves ahead.…US 10-year yield retreated while the EUR/USD rebounded
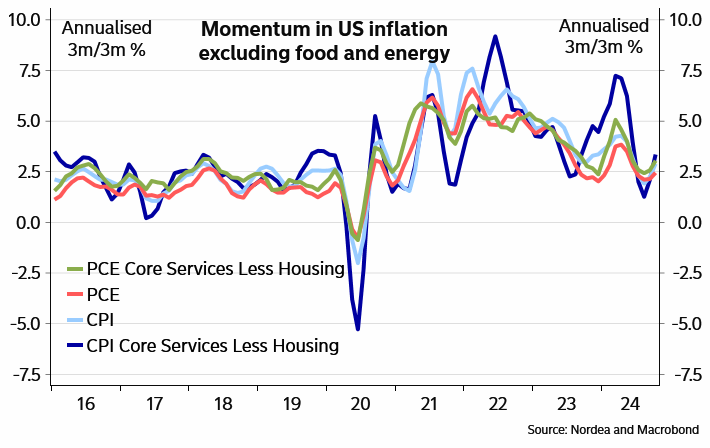
US inflation momentum was on the rise already before the election
…Bond market challenges will only increase going forward …
SurplusProductivity: Falling Flat}
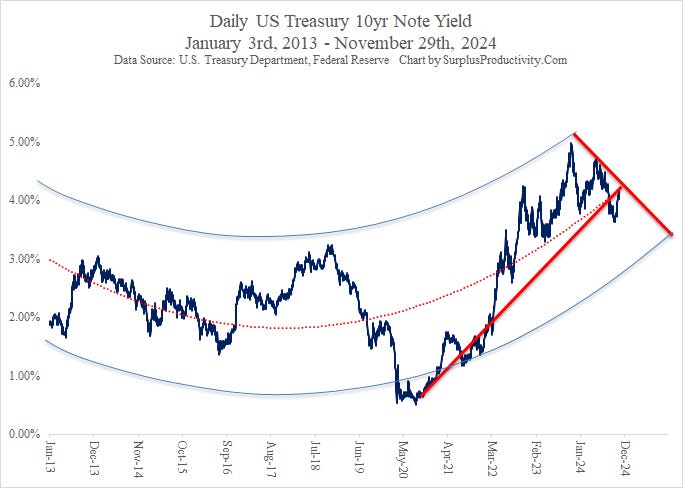
UST 10yr (& Others) Looking Lower
Upward push on 10yr note yield faltering fast and now going how low?
Flatter figuratively forever
Inflation expectations expect lower inflation
A lot has been unfortunately written about the yield on the U.S. Treasury Note rising since the Federal Reserve began cutting rates back in September. This, however, has been a disingenuous narrative - as most headline baiting story lines are - as the actual yield on the aforementioned Treasury Note has actually fallen 77 basis points from its peak of 4.95 percent back on October 25th of 2023 to yesterday’s close of 4.18 percent. More so, it is apparent that taking a longer look at its performance, the yield on the 10yr UST has been facing some very significant resistance over the past year. This past week alone has been especially telling as despite the holiday-shortened trading days, the yield has collapsed 23 basis points alone. While short-term narratives play out well in the short-term, the longer-term economic fundamentals driving the change are much more important, no matter the fact it takes more than a byline to explain them. In this case, the headlines aren’t the only thing falling flat these days.
at TimmerFidelity
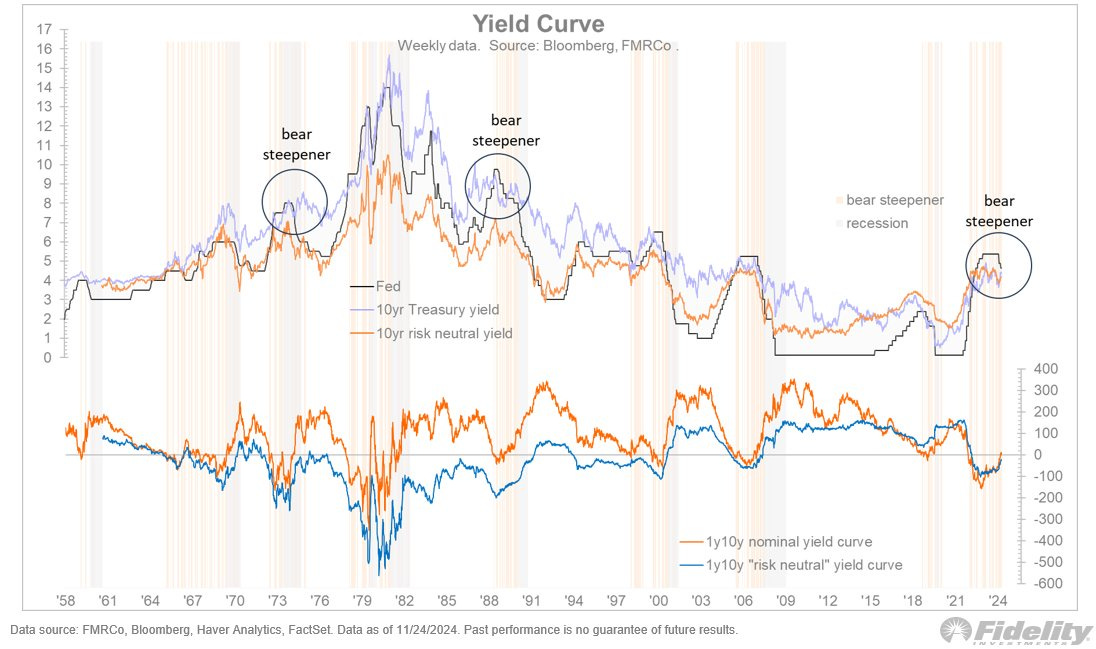
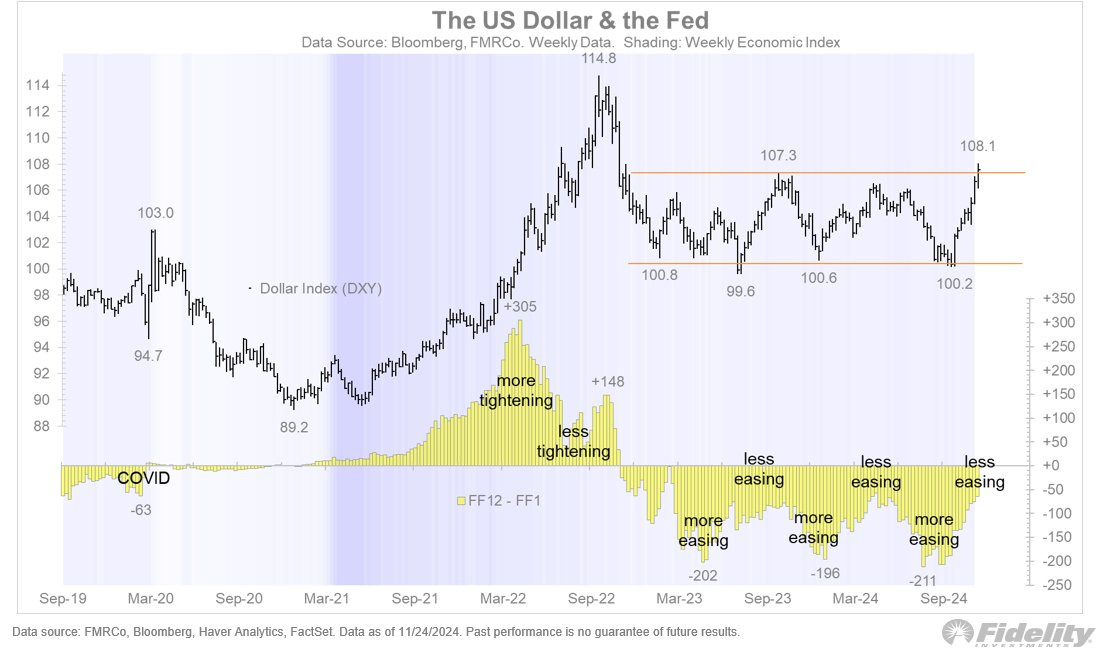
The yield curve continues to bear-steepen, with the Fed Funds rate now at 4.50-62% while the 10-year hovers at 4.4%. I still see the specter of occasional rate tantrums to 5% as a source of market consternation next year. They don’t have to end the bull market, but they might interrupt it.
Part of that scenario is a dollar that might get a little too strong. Per the chart below, the dollar trades on rate differentials, which ebb and flow on the basis of how much or little the Fed is expected to change rates. The dollar has gone from the bottom of its long range all the way to the top in very short order. Much more of this could start to affect financial conditions.
… AND for any / all (still)interested in trying to plan your trades and trade your plans in / around FUNduhMENTALs, here are a couple economic calendars and LINKS I used when I was closer to and IN ‘the game’.
… and lets NOT forget EconOday links (among the best available and most useful IMO), GLOBALLY HERE and as far as US domestically (only) HERE …
THAT is all for now. Enjoy whatever is left of YOUR weekend …




Great information!!!!!
Thank you...
"Trump has said he wants US dollar to remain reserve currency", that so? Huh. Was this Tweet-Policy? Is this the beginning of the end of the West slapping economic sanctions on anything and everybody so they don't need a USD alternative? Wanna bet Trump tries sanctioning whoever doesn't go along? ... Picturing our intrepid master builder setting aside the golf clubs, rolling up his sleeves, and getting busy laying The Great Wall of American Isolation one Bric at a time.
How did those lyrics go? ...
'Maybe gets a blister on his little finger
Maybe gets a blister on his thumb
He will show you where the Purple Hearts grow'