Good morning / afternoon / evening - please choose whichever one which best describes when ever it may be that YOU are stumbling across this weekends note…
First UP, with Monday’s UST auction DOUBLEHEADER (2s and 5s) a couple visuals for your consideration …
Momentum would suggest more of a concession required and based on limited trading FRIDAY, it would appear one is underway … Make of this whatever you will and in as far as some data out Friday (with link thru TO source aka the horses mouth)in the case you were out with friends / family
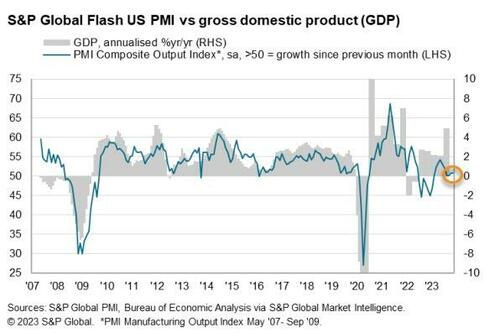
ZH: US Manufacturing PMI Unexpectedly Slumps Into Contraction; Jobs & Prices Lower
“The US private sector remained in expansionary territory in November, as firms signalled another marginal rise in business activity. Moreover, demand conditions – largely driven by the service sector – improved as new orders returned to growth for the first time in four months.
The upturn was historically subdued, however, amid challenges securing orders as customers remained concerned about global economic uncertainty, muted demand and high interest rates.
Businesses cut employment for the first time in almost three-and-a-half years in response to concerns about the outlook. Job shedding has spread beyond the manufacturing sector, as services firms signalled a renewed drop in staff in November as cost savings were sought.
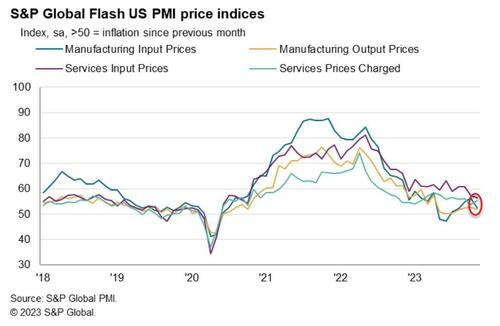
“On a more positive note, input price inflation softened again, with cost burdens rising at the slowest rate in over three years. The impact of hikes in oil prices appear to be dissipating in the manufacturing sector, where the rate of cost inflation slowed notably.
Although ticking up slightly, selling price inflation remained subdued relative to the average over the last three years and was consistent with a rate of increase close to the Fed’s 2% target.”
Alright enough trying to make something outta nothing as MOST if not all bond jockeys have been and remain OUTTA POCKET for holidays … I’ll move on AND right TO the reason many / most are here … some UPDATED WEEKLY NARRATIVES … some of THE VIEWS you might be able to use as you prepare for the days and weeks ahead which will hopefully bring to a close YOUR best year ever — markets and otherwise!!
THIS WEEKEND I’ve added some 2024 outlooks and left others in place and will likely lean on / refer to this note on into the near future …a couple / few things which stood out to ME this weekend … Since I was never IN the 2024 year ahead game, lots of reading to do
… Our rate forecasts by end ’24 for 2y & 10y UST are 4 & 4.25% (Exhibit 5). We expect 2s10s to dis-invert in 2H24, reaching positive slope by end ‘24. Our forecasts are below the forwards but above consensus…
… And you know you’re never sure, but you’re sure you could be right … We expect Treasury yields to fall and the long end to lead the steepening into the first ease in 3Q24, but ongoing QT and a large demand gap suggest a smaller decline and more significant steepening than in prior cycles. We forecast 10-year yields fall to 3.75% and 5s/30s steepens to 75bp by YE24. Stay patient before initiating duration longs given expected time to first ease and dovish Fed path currently priced in. Instead, we favor long-end steepeners, particularly if term premium continues to rise.
Moving along and away FROM highly sought after and often paywalled and Global Wall Street narratives TO a few other things widely available and maybe as useful from the WWW
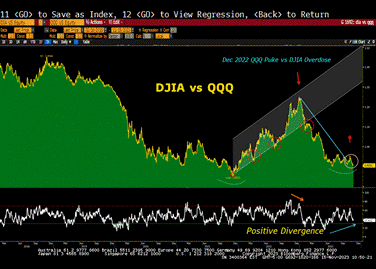
Tax Loss Basket 2022 – A year ago, there was a Q4 overdose into DJIA names, and out of the QQQs, but we are seeing the climax opposite with positive divergence favoring the DJIA in Q1 2024. The Dow Industrials are extremely cheap vs. the ridiculously crowded QQQs. There is close to $19T in the Nasdaq 100, up from $12.5T in January 2023.
Bloomberg: Economists May Have Been Flying Blind All Along (Sahm OpED)
Declining response rates to official surveys raise the possibility that government and central bank officials have been making decisions based on flawed data
WolfST: Money Market Funds, Large CDs, Small CDs All Surged: Americans Figured it Out
… Money market funds for retail investors rose by 0.6% in the latest reporting week from the prior week, by 2.5% over the past four weeks, and by 8.9% over the past three months, to $2.24 trillion, ICI (Investment Company Institute) reported on November 22. This includes funds that invest in government instruments, such as T-bills; funds that invest in tax-exempt securities; and prime funds that invest in non-Treasury assets.
Those are just funds sold to retail investors. Money market funds (MMFs) are divided into two major categories in terms of who they’re targeted for, based on the language in their prospectus; and we look at them separately:
Funds sold directly to retail investors (chart above)
Funds sold to institutions such as an employer, trustee, or fiduciary on behalf of its clients, employees, or owners (chart below)
MMFs are mutual funds that invest in relatively safe, short-term securities, such as Treasury bills, repos, including what the Fed offers and calls “Overnight Reverse Repos” (ON RRPs), high-grade commercial paper, and high-grade asset-backed commercial paper.
MMFs for institutions rose by 0.5% last week, by 2.2% over the past four weeks, but only by 1.4% over the past three months, after the dip in October, to $3.52 trillion.
Individuals are indirectly among the holders of these funds since the institutions include employers, trustees, or fiduciaries who buy those funds on behalf of their clients, employees, or owners.
Total MMF balances rose by 2.3% over the past four weeks and by 4.2% over the past three months, to $5.76 trillion.
The ICI makes only the past 20 weeks of data available and excludes ETFs and funds that invest primarily in other mutual funds.
The Federal Reserve releases a slightly different metric on a quarterly basis as part of its money stock series, currently through Q2, and it has been the same song. You can see how the balances swell when the Fed hikes rates, first in the 2017-2019 period, and then again big time this year (data only through Q2).
Money-printing and money market funds. But note in the chart above how the mega-money-printing binge that started in March 2020 created so much liquidity that it went also into money market funds, even when they returned near 0%, which triggered its own set of problems as these funds had to buy T-bills, and their demand for T-bills pushed down the T-bill yield to 0% and even below 0%.
FOOD for thought … speaking of which Ohio State / MICH has just begun and leftovers are now SCREAMING my name.
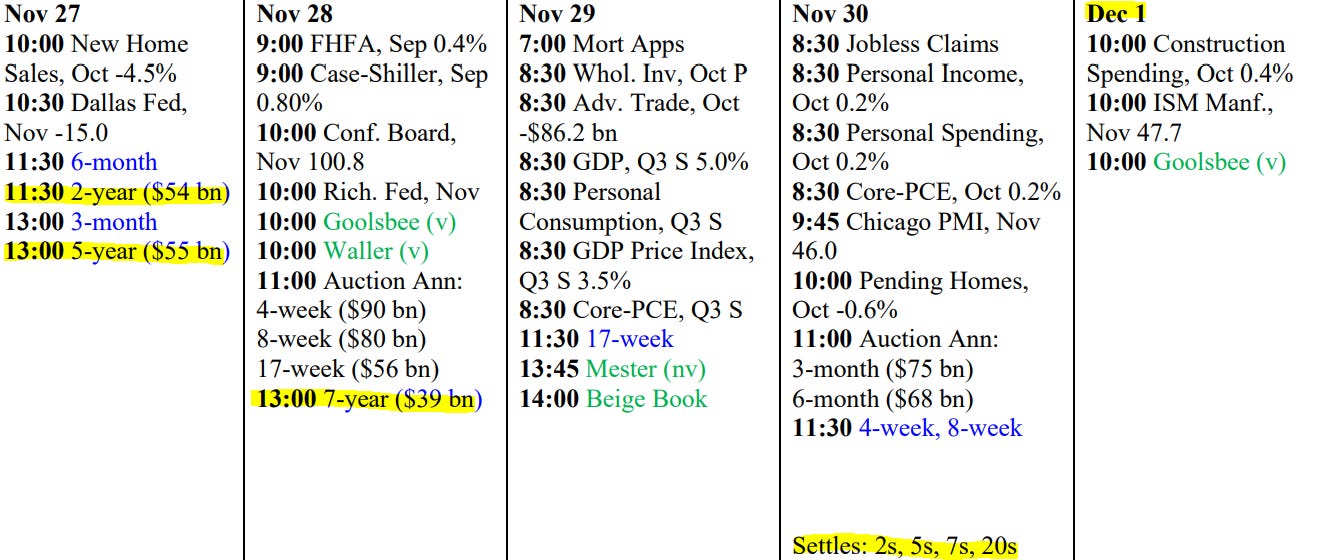
But first, for any / all (still)interested in trying to plan your trades and trade your plans in / around FUNduhMENTALs, here are a couple economic calendars and LINKS I used when I was closer to and IN ‘the game’.
First, this from the best in the strategy biz is a LINKthru TO this calendar,