weekly observations (11.11.24): TLINEs tested (BAML); '3' handle 10s coming (BMO, TD); long 5y breaks (BNP); long 5s (UBS); Apollo: "A Rebound in Growth Is Coming"
Good morning / afternoon / evening - please choose whichever one which best describes when ever it may be that YOU are stumbling across this weekends note…
The bond markets are closed Monday in observation of Veterans Day … thanks to all who’ve served and to their families for their sacrifice.
First UP … the week that was …
The (Long)View From London: The State of Markets
A brief review of all key upcoming events across the major regions of the globe & an overview of key recent market trends.…Key chart: Weekly performance (% return) – various key assets
… but wait, there was moar …
at MikeZaccardi
US stocks' best week vs ex-US since October 2008 $VTI $VEU
+5.1ppt
NOW lets deal with a couple / few things items from the week just passed (in other words, a couple snarky ZH links which contain visuals and info graphics helping tell the tale of markets — INCLUDING rates — which you may / may not have already stumbled upon) …
ZH: Surge In 'Hope' Lifts UMich Consumer Sentiment In Early November Survey
… and by days and weeks end …
ZH: 'Trump Trade' Goes Turbo: Crypto Rips, Gold Dips, Small Caps Best Week Since COVID
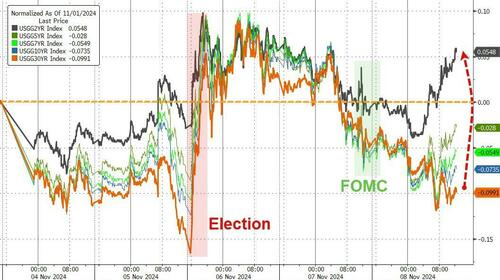
… It was a massive week for bonds though (even as vol fell) with Treasury yields spiking and dumping to end with a very much flatter yield curve. Only the short-end of the curve is higher on the week...
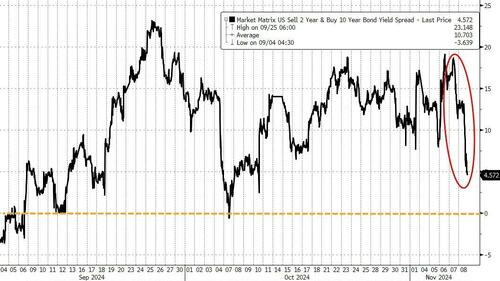
2s10s tumbled back towards inversion once again...
…. say whatever you want — like or HATE the bond market — the pictures (10s, 2s) indicate that it was / is safe to go back into the waters and I’m not sure anything further required … and so, I’ll move on AND right TO the reason many / most are here … some WEEKLY NARRATIVES — SOME of THE VIEWS you might be able to use …
THIS WEEKEND, a few things which stood out to ME …
BAML Global Rates Weekly
Sweepstakes
08 November 2024…US: Red election outcome = trading range higher, inflation wider, spreads tighter. Swap spreads should focus less on regs and more on UST supply / demand…
…Bottom line: We now believe 10Y UST yield range will be 4.25-4.75%, which was shifted higher from 3.5-4.25% after the election. We continue to recommend trading this post-election range tactically from the long side. We prefer adding duration exposure on dips as the US labor market continues cooling & the Fed continues with its rate cuts. We continue to expect a modestly steeper nominal 5s30s & real 5s10s curve (real curve steepening partially supported by tariffs & higher near-term inflation).
…Technicals: US10Y & bunds test bull market trend lines
US 10Y and Bund yield are testing key trend lines that have guided the downtrend in yields since Oct-2023 at 4.45-4.35% and 2.48-2.40%. (Levels from now to YE24)BARCAP: Global Economics Weekly: The macroeconomics of Trump 2.0
Beyond the immediate market rally, the global outlook after Trump's election now depends highly on the sequencing and the degree to which his promised policies of tariffs, deportation, taxes and deregulation materialise. We assume slowing growth later in 2025, combined with US price pressures, lead to diverging rate paths.
…US Outlook
Appetite for disruption
We extend our outlook through 2026, embedding higher tariffs and tighter immigration restrictions. In 2025, we expect slower growth and stalling disinflation amid a tighter labor market, with inflation still exceeding target in 2026 amid below-trend growth. We see another 25bp cut in December then two each in 2025 and 2026.
The election outcome — with Republicans securing the Presidency, the Senate, and, quite possibly, the House — has disrupted the aggregate supply outlook, and we adjust accordingly. We expect tariffs and tighter immigration to slow the pace of disinflation and trim GDP growth. With immigration restrictions significantly slowing labor supply, we continue to expect a tightened labor market.
The FOMC cut rates 25bp in November, as expected, and signaled data-dependent decisions in upcoming meetings. We retain our projection of another 25bp cut in December, though communications leave the door open for a pause pending data developments. We now expect only two 25bp cuts in 2025, in March and June, followed by two more in 2026.
We expect to see another round of firm inflation and spending estimates next week. We think core CPI will rise 0.30% m/m (3.3% y/y) in October, near September's pace, reflecting upswings in the used car and lodging components. Strong auto sales are expected to boost the retail sales headline to 0.5% m/m, with the control group registering a solid 0.3% m/m gain.
BMO US Rates Weekly: Weekly: Powell vs. The Four T's
In the week ahead, the US rates market will continue to digest the election results and ponder the implications from Trump, tariffs, trade wars and tax cuts – The Four T's. As Powell observed at the recent press conference, it is far too soon for monetary policy expectations to reflect any potential changes from the White House and as a result, the Treasury market will shift back into the mode of responding to the fundamentals of growth, employment, and inflation. Wednesday’s CPI report will feature prominently in the market’s interpretation of the prospects for a December pause in rate cuts. Core inflation is forecasted to increase by an above-trend +0.3% in October, and the noise associated with the hurricanes could skew the number even higher. We maintain that the approach to October’s data (jobs, inflation, and consumption) should be one of caution as the dislocations caused by the hurricanes work their way through the real economy. To a lesser degree, this might also hold for November as well, if for no other reason than a reversal of October’s distortions…
…We remain constructive on Treasuries in the medium-term and anticipate a return to 3-handle 10s at some point before the New Year...
BNP: US rates: Long 5y breakevens
We added long 5y breakevens in the wake of US presidential election results. While breakevens have widened in recent days without any concrete details on the incoming administration’s near-term focus, we see this as the market pricing the “rumor”.
Three policy prongs – fiscal expansion, tighter immigration policy and hawkish trade policy (aka tariffs) – are on the table. Importantly, all three carry inflation risks (wider breakevens), but only the fiscal expansion is likely to be beneficial for growth (higher real yields).
The fact that real yields have risen alongside breakevens in recent weeks suggests that markets are currently applying a higher probability to meaningful fiscal expansion (via tax cuts) and are mostly discounting the risks of significant tariffs or a very hawkish immigration policy. The “rumor” is focused on fiscal expansion.
Now that the rumor is priced, the next leg of the market move will depend on facts: which policy will the new administration focus on and what are the timelines? As the facts emerge, they could have a different impact on growth, real yields and (by extension) nominal yields. However, we think breakevens are likely to benefit in most combinations of policy mix, especially if either tariffs or levels of deportations exceed investors’ discounted expectations.BNP US October CPI preview: Used vehicle pop belies underlying disinflationary trend
KEY MESSAGES
We expect a pop in used vehicle prices to drive a third straight rounded 0.3% m/m US core CPI print for October (released on 13 November).
We think the details will look better than the headline, with core services remaining well behaved and fundamentals continuing to point to further services disinflation ahead.
BNP 2025 copper outlook: Bigger surpluses, bigger downside price risks
2025 downgrade on slower expected demand growth: We leave our current Q4 2024 copper price forecasts unchanged, but see a likelihood of slower 2025 global copper demand and dampened prices as a result of growing trade restrictions. As a result, we have cut our end-2025 price by about 9%.
Less trade signals slower demand growth: We have moderately cut our 2025 demand growth expectations from 3.3% to 2.9%. The principal drivers of this revision are our expectations of further contraction in European construction, and in European manufacturing, due to export headwinds. We also expect slower demand growth in China on trade constraints and continued sluggish domestic demand. We remain sceptical that China stimulus measures will offer any meaningful support to copper demand.
Copper supply side - robust in 2025: We think strong mine supply growth in 2025, and the commissioning of more smelter capacity, will drive up refined copper supply growth by 3.7% next year, running well ahead of our new demand growth projections. Indeed, we now see an around-500-kt surplus for the copper market next year, roughly a 320 kt increase over our previous 2025 surplus expectations
Brean Economics Weekly: Implications of Trump's election victory; Labor costs, fiscal policy and the Fed
In the attached Weekly we provide thoughts on the implications of Donald Trump’s decisive election victory with respect to fiscal policy, trade, regulatory policy, immigration, and the Fed. We also discuss the revisions to unit labor cost growth published this week and discuss how the Fed should view both those cost revisions and fiscal policy developments.
…Revised History of Labor Costs Should Give the Fed Thought to Pause
The great Yankee Yogi Berra once said “It’s tough to make predictions, especially about the future.” Like many of Yogi’s aphorisms, such as his comment about inflation that “a Nickle ain’t worth a Dime anymore,” there is a kernel of insight wrapped in an amusing turn of phrase. Making predictions starts from an analysis of the past and an evaluation of where we are at the present time (at the Bank of England back in the 1980s when one of us ran the Bank’s forecasting group, this process was referred to as WAWN or Where Are We Now?) This process is key to creating a forecast path and while this forecast was about the future (putting aside the technicality that the first observations in a forecast might be about the past because the latest data have not yet been published), its value was that as the future unfolded and differed from the forecast (as it inevitably will), the deviations forced one to analyze the forces producing the different outcome. Were the assumptions right (oil prices, the exchange rate, tax rates) but the forecast wrong, in which case one is forced to reconsider the model (unless the deviations were small in a statistical sense). Were the assumptions wrong and, if so, how should the path evolve on revised assumptions? In the 1980s, the Bank did not make monetary policy decisions—it only advised the government—but for a central bank that does pull the trigger on monetary policy, the deviations should prompt the question of how should the assumed path for monetary policy be altered? If the past history of some key variables should be revised in a meaningful way, then all of these questions come into play and need to be addressed……Before the annual revisions to the National Income and Product Accounts (NIPA), the data over the last year showed labor compensation rising 3.1% over the four quarters ending with the second quarter of this year, which was down from 4.9% a year earlier. The nonfinancial corporate data showed a similar picture with 3.3% compensation per hour growth through the middle of 2024 versus 5.3% through the middle of 2023. Adjusted for productivity growth, the slowing in labor costs was more impressive with nonfarm ULC growth slowing to 0.3% from 3.6% and nonfinancial dropping to 0.6% from 4.2%, on the same comparison…
DB: Commitment of Traders
… Speculators continued to sell contracts in TU and FV, with their net short positions in both contracts reaching new highs.
DB: Investor Positioning and Flows - Post Election Moves
Sharp equity rally post-election but within its uptrend channel. Rallies following close elections have been the historical norm as we have previously noted, but the current one is clearly faster than prior ones. However, the context is important. The trajectory of the equity market had been exceptional even prior to the election, having risen 21% this year going in, on top of a 24% rally last year. Indeed, even after the jump this week the S&P 500 is still within its uptrend channel of the last 2 years, albeit now near the top of it. As it stands, the S&P 500 is on track to post 2 consecutive years of 20%+ returns, which has happened only 3 times previously in the last 100 years.
Vol premiums collapsed in line with the historical script. In our reading, the primary driver of this week’s jump in equities, as with previous post-election rallies, has been a collapse in the equity vol premium built up going in, exactly in line with the historical script. The S&P 500 option vol curve which had priced next day vol at over 35% on election day is now pricing it in the single digits. The VIX and vol premium embedded in it have collapsed as well. The decline in vol premiums spans asset classes with that in bonds notably falling back to its historical average after being 3.5 standard deviations above going in (The Cross Asset Ramp Up In Volatility Premiums, Oct 25 2024).
DB: Asset Allocation - Q3 2024 Global Earnings Chart Pack
DB: Fed Liquidity and Money Market Monitor
…Large yield spread between money market funds and bank deposits should support further inflows
MS: Our Views After the Election | Global Macro Strategy & Economics
We maintain a neutral stance on US Treasury duration in anticipation of a 'buy the dip' opportunity – catalyzed by better economic data and less investor certainty over Fed policy into year-end. We suggest investors position for this eventual opportunity today via buying USD against EUR and CHF.
Given the election outcome and investor discussions around this potential outcome, Treasury yields likely already reflect any 'agree to disagree' debate.
If we've assessed current market prices accurately, then economic data and their implications for Fed policy should drive Treasury yields into year-end.
Stronger data into year-end should drive yields higher, but we don't suggest investors deviate from a neutral duration stance at this point.
For now, we turn to relative value with a bias toward higher yields. We suggest paying the 3y SOFR swap rate on the 2s3s30s 50:50 butterfly.
Clarity on the election skews toward a larger deficit expansion, but Treasury issuance flexibility sets up to disappoint aspirations for higher yields.
Prospects for less onerous regulation, which potentially creates incremental bank demand for Treasuries, help to stem one-way moves in swap spreads.
Given the Fed's cutting outlook, we do not think that tariff announcements will have the same 'vol up' dynamic they did in 2018-19.
We suggest long USD positions versus EUR and CHF and short CNH versus INR to hedge against risks of better US data and risks of increased trade policy headlines into year-end..
MS: US Economics: CPI Preview: Noisy
Core CPI at 0.30% in October (0.3%M cons, 3.3%Y), implying core PCE at 0.20%M – slightly higher than the recent 3-month pace. It is a noisy print with higher core goods due to the recent hurricanes and short-run payback in shelter. Headline CPI: 0.21%M (2.6%Y, NSA Index: 315.476).
TD Global Rates Weekly
Oops!...I Did It AgainUS
November FOMC: How About No?
We revise our profile for rate cuts, continuing to look for a 25bp cut in December, but expecting the Fed to pause cuts in H1 2025 in reaction to tariff and immigration policy. We also expect rates to move lower and the curve to steepen, with 10y rates finishing 2025 at 3.80%.UBS: US fixed income: Moving 5-year Treasuries to Attractive
With the election now behind us, rates markets are able to focus once more on the Fed’s path alongside the economic implications of a second Trump administration.
We have recommended positioning in the 5-year area of the curve, expecting underperformance in the long end as the yield curve steepens.
When considering the historically high correlation of 5-year yields to the fed funds rate, we see that 5-year yields are approximately in line with levels consistent with a ~3.7% fed funds rate.
The 5-year area of the curve is a good way to lock in attractive yields at 4.17% while not taking on too much duration risk. We expect outperformance in the months ahead as the knee-jerk reaction to the election recedes and the market shifts its focus back to fundamentals, the rate-cutting cycle, and the soft landing.
…Finally, the Treasury market’s looming maturity wall in 2025, with USD 5.84tr of issuance set to mature, is also a contributing factor to the rise as the market expects further issuance to make up the gap (Fig. 4).
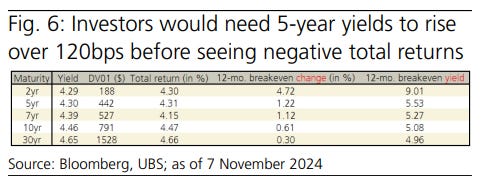
…even if 5-year yields were to rise further, we show that they would need to rise as much as 122bps before investors would begin to see negative total returns, implying a fed funds rate over 4%, which we view as unlikely (Fig. 6).
Given CIO’s fed funds expectations, the rise in 5-year yields since September, and in the wake of the election, we extend our duration and move 5-year US Treasuries to an Attractive allocation. We believe the 5-year area of the curve is a good way to lock in attractive yields at 4.17% while not taking on too much duration risk…
Wells Fargo: Weekly Economic & Financial Commentary
…Interest Rate Watch: Higher Rates Likely Under Trump Administration
President-elect Trump’s victory sparked upward movements in equities and bond yields across the curve. This week’s Fed meeting was less eventful. As was widely expected, the FOMC reduced the federal funds target range by 25 bps to 4.50%-4.75%. Although Chair Powell declined to comment on the election, our expectation for the path of Fed easing has evolved. As we see it today, the potential for higher inflation next year raises the likelihood that the federal funds rate bottoms out closer to 4% than 3%.
Moving along and away FROM highly sought after and often paywalled and Global Wall Street narratives TO a few other things widely available and maybe as useful from the WWW
Apollo: A Rebound in Growth Is Coming
The narrative that the labor market is cooling is inconsistent with the continued strength seen in the incoming data for above-trend GDP growth, strong retail sales, strong durable goods, low jobless claims, and rising average hourly earnings.
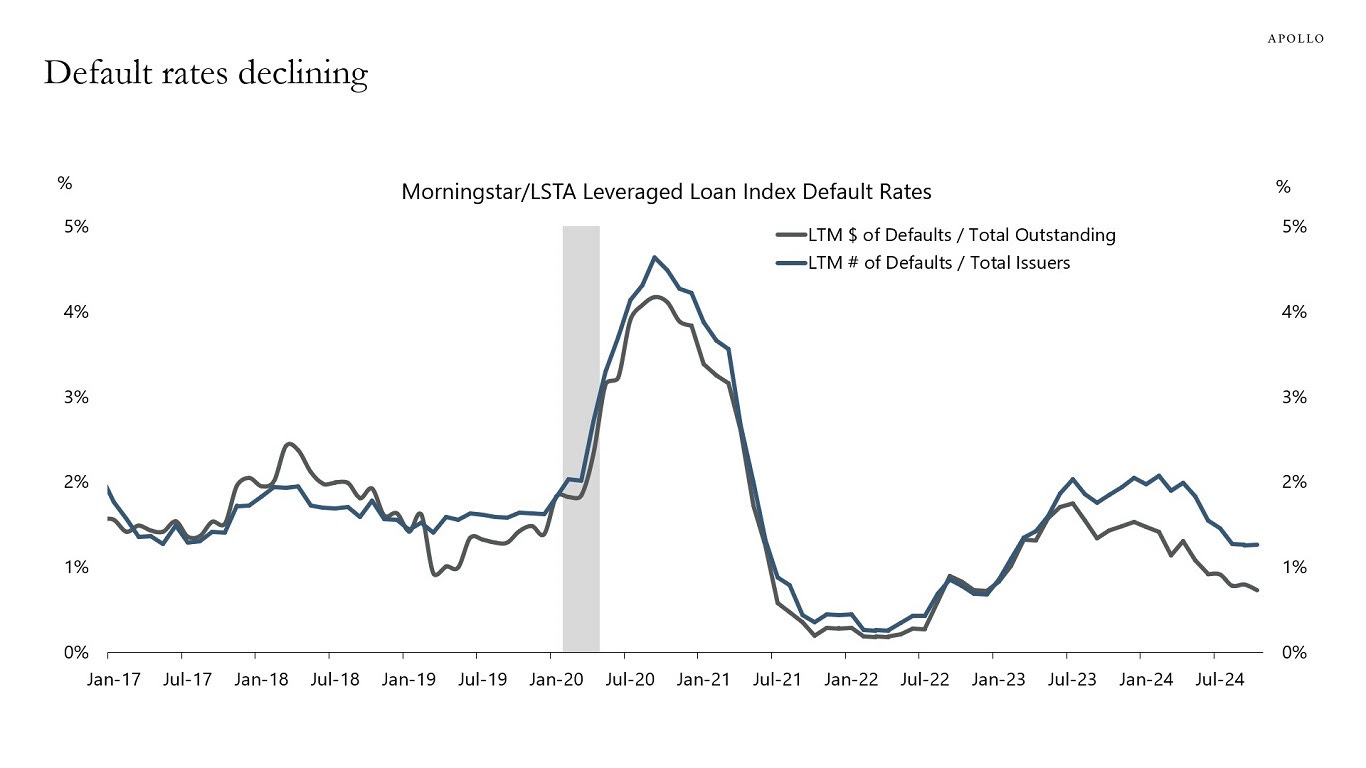
In addition, default rates continue to decline, corporate profits are at all-time highs, weekly forward profit margins are at record highs, and US household balance sheets are in excellent shape, see charts below.
In short, the US economy remains incredibly strong.
Combined with tailwinds to growth from record-high stock prices, tight credit spreads, M&A/issuance markets rebounding, the AI/data center boom, the Chips Act, the IRA, the Infrastructure Act, and lower taxes for domestic manufacturers and deregulation likely coming, the bottom line is that we could see a dramatic increase in job growth in November, including a reversal of the weather and strike effects that were pushing down nonfarm payrolls in October.
Our chart book with daily and weekly indicators for the US economy is available here.
Cumberland: Yields — The Bump from Trump
According to pre-election polls, many believed the results would be too close to call. Instead, it resulted in a clear mandate.
The graph below shows the Trump presidential betting pool odds aligned with the ten-year US Treasury bond yield. This data goes back to July of this year. As you can see, ten-year bond yields were elevated after the Trump-Biden debate, and Trumps’ betting odds were high along with bond yields. These coupled trends assumed possible undivided government to go with a Trump presidency, suggesting that investors would be confronting higher deficits and higher inflation — similar to what happened after the surprise Trump victory in 2016.
After Kamala Harris replaced President Biden on top of the Democratic ticket, the gap in the polls began to close. That trend is reflected by lower Trump odds in the betting pools and a corresponding drop in ten-year US Treasury yields (aided by some softer economic data)…
… Going back to 2016, we can see the rise in yields after the SURPRISE Trump election on November 8, 2016. Yields rose from 1.60% to 2.20% very rapidly and then began a period of consolidation. I believe that yields should consolidate again this year from the rise since September 18th, when the Fed cut rates. The bond market should go back to looking at economic data; and any more Trump rate lift should be moderate.
SpectraMarkets: The Second Coming is Priced
Trump has returned but the actual vs. presumed policy mix is yet to be seen.…Interest Rates
Everyone thought yields would go mad on a Red Sweep, and they did, but only for a few hours. While the move up was faster than the reversal, you ended up with a nicely symmetrical move (up 20bps, down 20bps). From here, the mix of policy breadcrumbs and economic data will determine where we go. Down through 4.17% would take out the bottom of that whole month of trading and will trigger a capitulation event for bond shorts.Looking at Fed pricing, things have come way off the boil as Powell’s cutting strategy looked like this before:
And now looks more like this:
Here’s a more intelligent (less dumb?) visual:
The soft landing continues and the great employment collapse and carry trade unwind of August 2024 were fleeting hallucinations…
StockCharts.com: Stock Market Hits Record Levels: Prepare for What Inflation Can Bring Next
…Bond Market Action Is Key
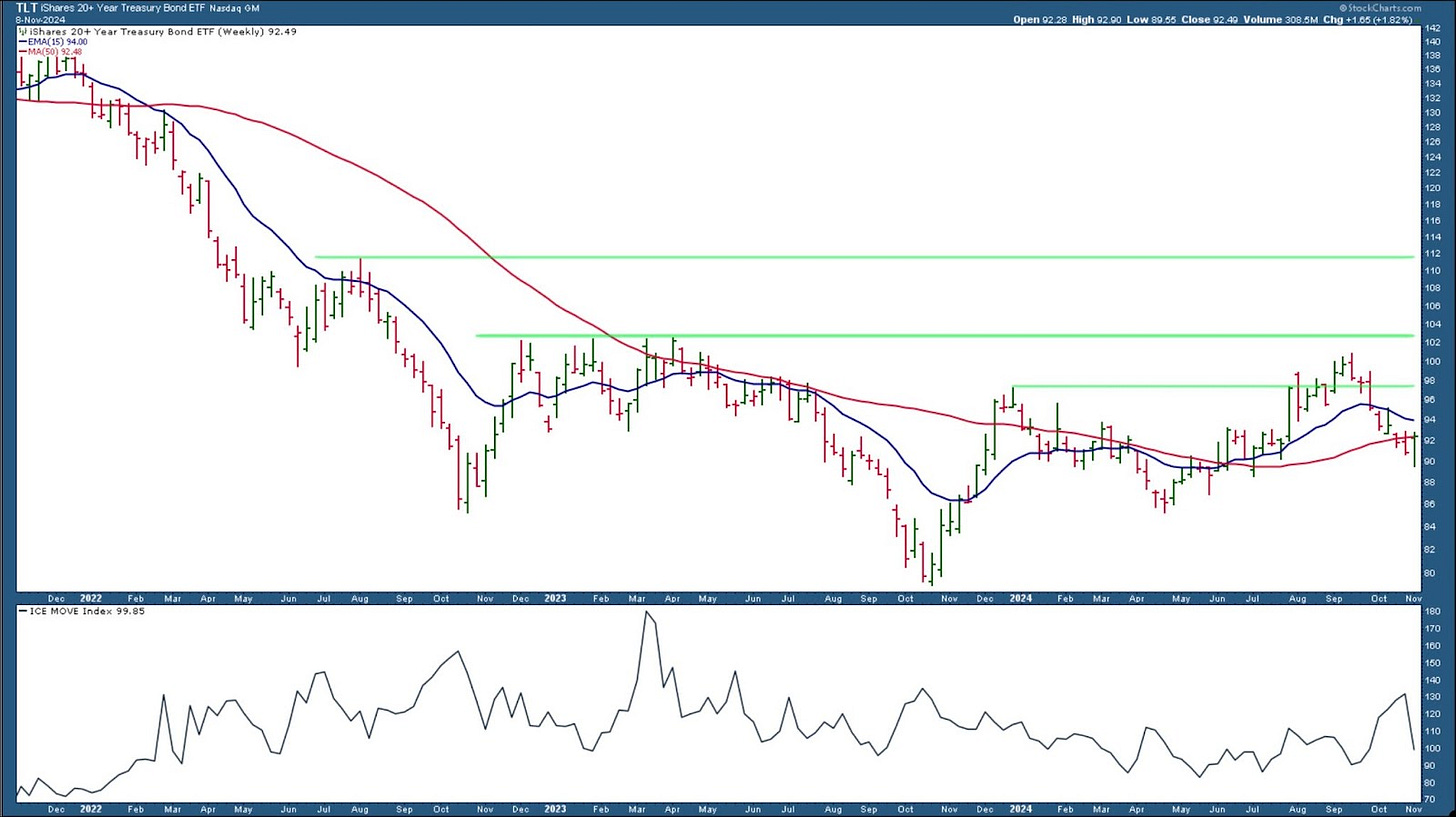
The 10-Year US Treasury Yield Index ($TNX) closed at 4.31% on Friday, which is significantly higher than its September low of 3.61%. Bond prices, which move inversely to yields, fell due to possible economic growth and inflation under the new administration.The weekly chart of the iShares 20+ Year Treasury Bond ETF (TLT) may be flirting with its 50-week simple moving average (SMA), but it's trending to the downside. For as long as economic growth, inflation, and a widening budget deficit remains in play, bonds are likely to continue trading at low levels.
CHART 1. WEEKLY CHART OF THE ISHARES 20+ YEAR TREASURY BOND ETF (TLT). Bonds have been struggling of late and is likely to remain low for a while.Chart source: StockCharts.com. For educational purposes.
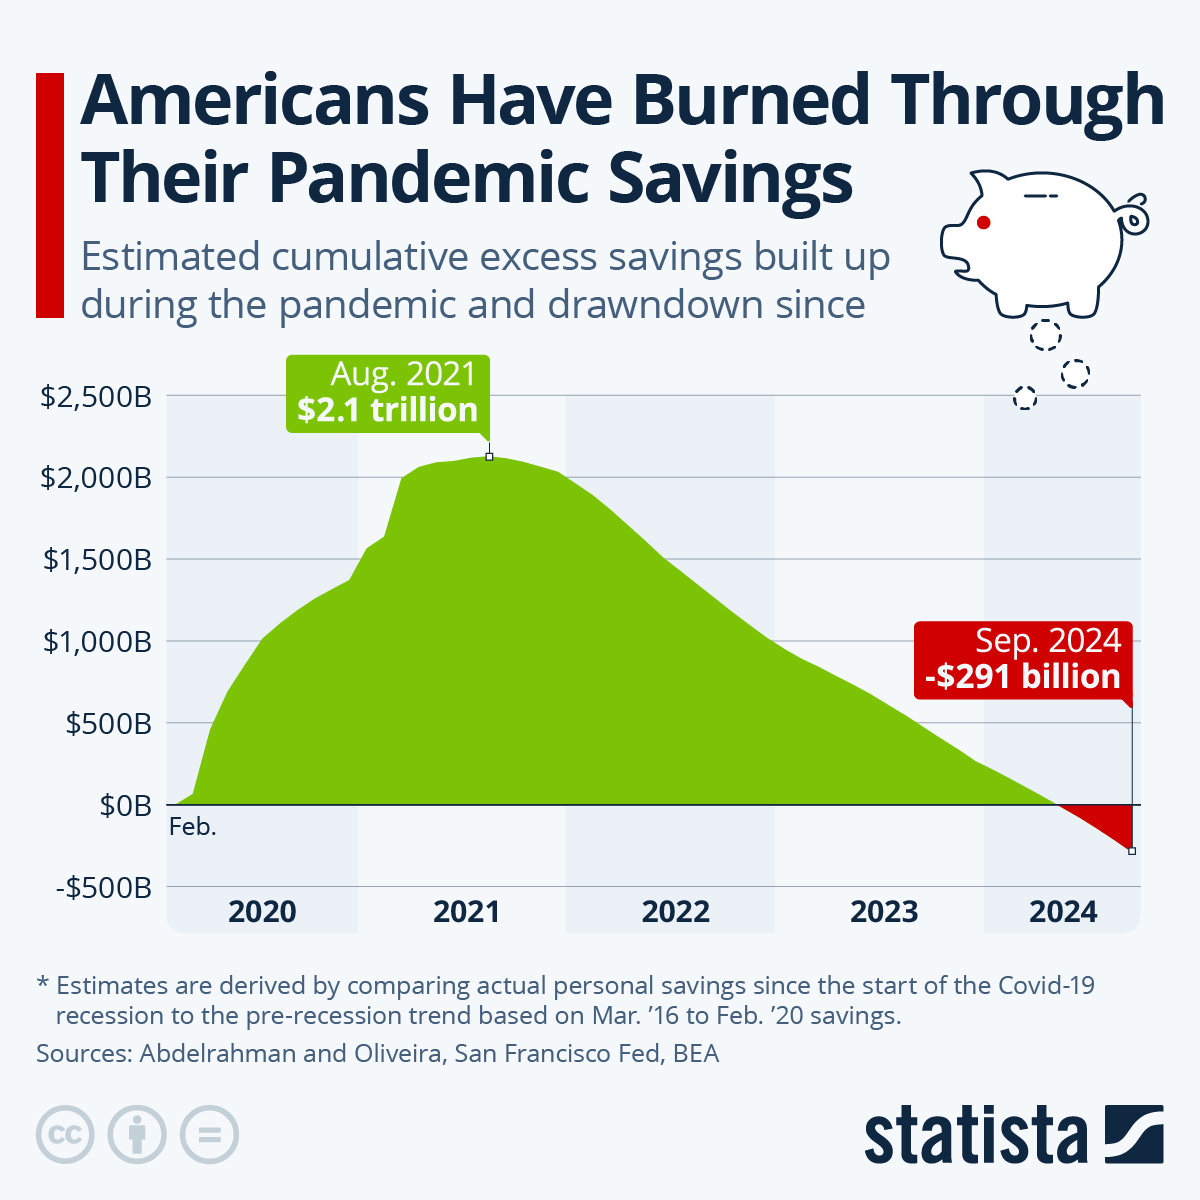
ZH: Americans Have Burned Through Their Pandemic Savings
… However, as Statista's Felix Richter reports, that has come at the expense of personal saving, which dropped sharply in 2022, when the personal saving rate, i.e. the share of their disposable income that people weren’t spending on consumption, taxes or interest payments, dropped to the lowest level since the financial crisis.
ZH: Global Food Prices Re-Accelerate For Second Month As Situation Remains 'Sticky'
The Food and Agriculture Organization of the United Nations' Food Price Index, which tracks the international prices of a basket of globally traded food, averaged 127.4 in October, up 2% from the prior month and 5.5% from one year ago. This index bottomed and turned higher earlier this year after peaking and falling for much of 2022-23.
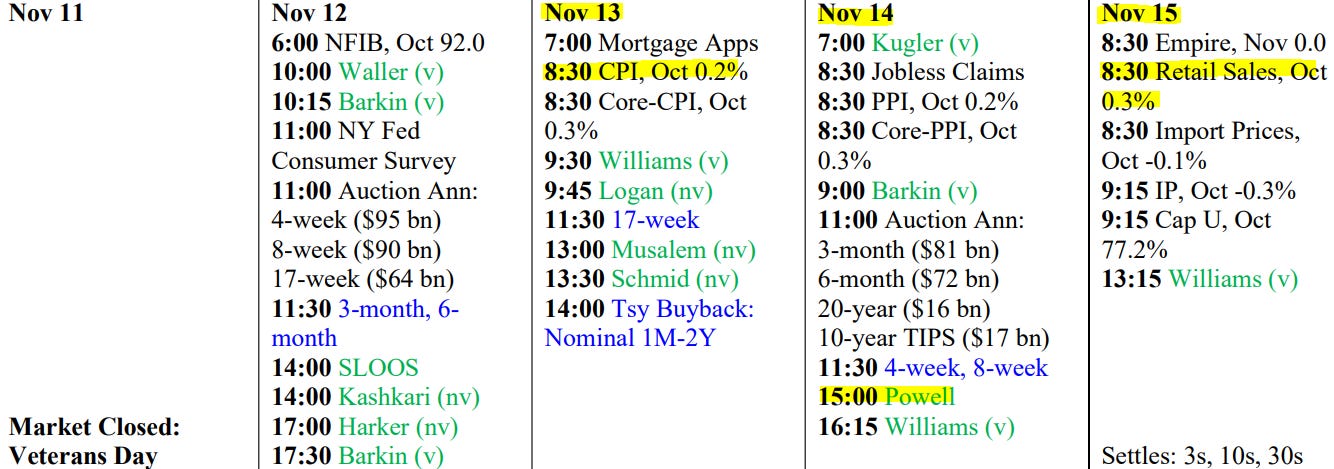
… AND for any / all (still)interested in trying to plan your trades and trade your plans in / around FUNduhMENTALs, here are a couple economic calendars and LINKS I used when I was closer to and IN ‘the game’.
First, this from the best in the strategy biz is a LINK thru TO this calendar,
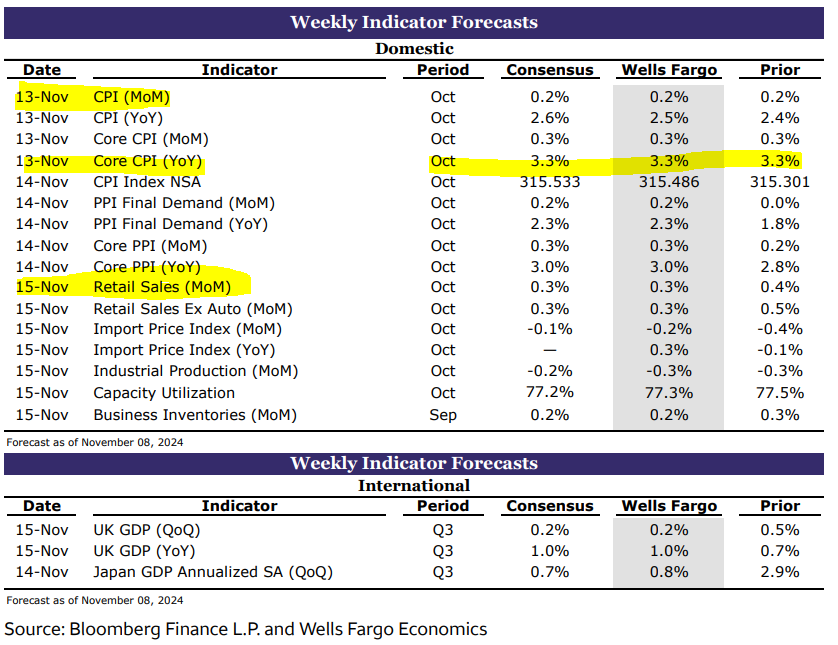
Wells FARGOs version, if you prefer …
… and lets NOT forget EconOday links (among the best available and most useful IMO), GLOBALLY HERE and as far as US domestically (only) HERE …
THAT is all for now. Enjoy whatever is left of YOUR weekend …







I hope you enjoyed the election......
Thank you for your work on our behalf....
https://youtu.be/yf3aa4WfL1o?si=Oto2XjpjuzAWe4QJ
GLOBAL PUBLIC DEBT IS DESTROYING THE ECONOMY