Good morning / afternoon / evening - please choose whichever one which best describes when ever it may be that YOU are stumbling across this weekends note…
This weekends note / thoughts are NOT going to be so … thoughtful.
Thing 1 in town for a few short hours and we intend to make the most of every minute and so I’ll move right along TO some UPDATED WEEKLY NARRATIVES … some of THE VIEWS you might be able to use …
THIS WEEKEND I’d note a couple / few things which stood out to ME this weekend …
BMO rates weekly, “Fading, not Fadable”(covered short, booked profits, looking at 10s30s steepener)
… All of that being said, the impact of supply will remain in the limelight until there is any convincing evidence of further economic deterioration; which won’t be on offer before the refunding announcement. Hence, our bias is to see 10-year yields retest the 5% level in the week ahead as the no landing narrative allows for investors to continue the conversation regarding the correct amount of term premium given the backdrop of ever-increasing auction sizes.
… We closed out of our tactical short in 10s with our 4.99% target reached on the passage of the weekend’s event risk without a material escalation on the geopolitical front …
JPMs FI weekly (from LAST WEEK —left in cuz they maintain LONG 5s AND have revised rate f’casts HIGHER … have cake and EAT IT TOO … BRILLIANT)
Moving along and away FROM highly sought after and often paywalled and Global Wall Street narratives TO a few other things widely available and maybe as useful from the WWW …
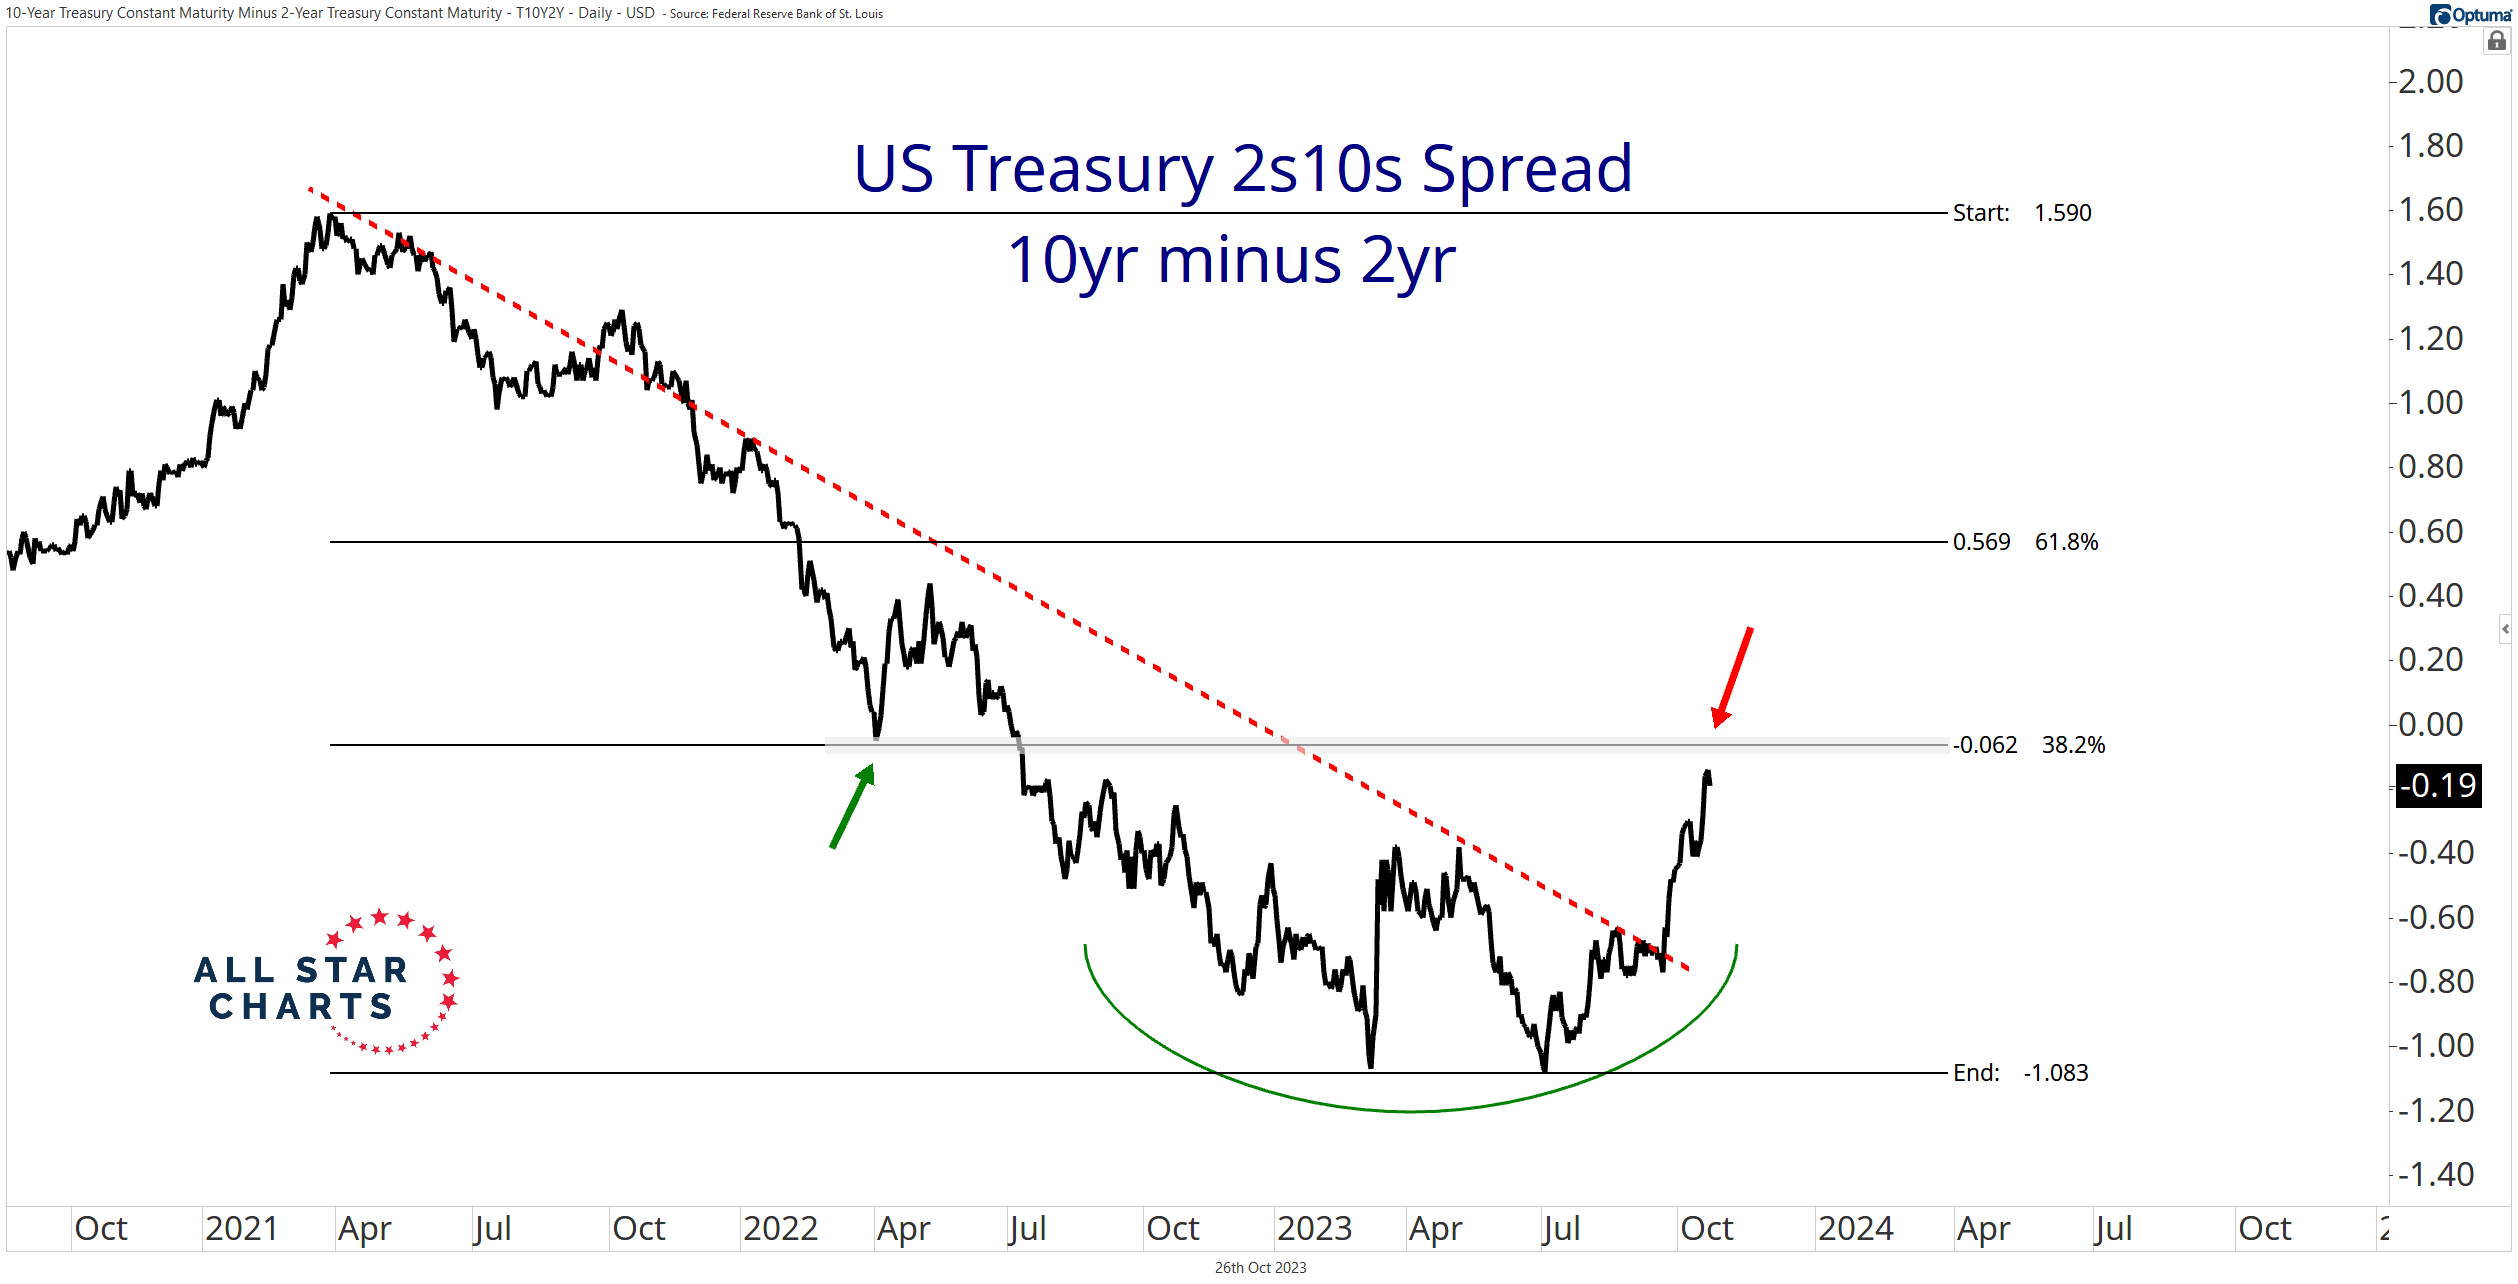
AllStarCharts- 2s10s Spread Retests Zero (some decent visuals …)
Check out the 2s10s spread challenging zero from below:
An inverted yield curve (widely measured by the 2s10s and 3mo.-10yr. spreads) has cast a pall over capital markets, promising an economic recession for over a year. Yet the US economy remains strong.
The curve is now flattening to levels not witnessed since the summer of 2022.
Perhaps it will continue to steepen in the coming months. On the other hand, this could be nothing more than a standard pullback.
Incidentally, the zero line on the 2s10s chart coincides with a critical retracement level supporting the latter.
Fibonacci retracement levels, though incredibly useful, aren’t the end-all-be-all analytical tool. However, critical intermarket ratios are aligning with last year’s patterns…
Inflation expectations measured by the TIPS ETF $TIP vs. the US T-note ETF $IEF are rising, much like the months heading into the Fed’s first rate hike last year.
Interestingly, breakevens (another measure of inflation expectations) have yet to produce a similar rally.
We can attribute this disparity to the denominator – bonds.
Now would be an opportune time for a Bloomberg Magazine cover titled “Bonds: Can’t Stop, Won’t Stop… Falling.” (I can see the cover now.)
Regardless of the reason, the positive correlation between the 10-year yield and the TIPS/IEF ratio remains intact, suggesting more of the same in terms of market environment.
It’s the same story for credit spreads…
Here’s the High Yield Bond ETF $HYG vs. the US T-note ETF $IEI, one of our preferred ways of tracking credit spreads and bond market stability:
Like last year, HYG/IEI is chopping sideways to lower. No alarms blare across the bond market – just an orderly, historic sell-off in US treasuries. Remain calm and carry on.
The Russell 2000 $IWM vs. the S&P 500 $SPY is another ratio tracking last year’s trend.
IWM/SPY experienced a sharp decline as the 10-year rose during the first half of 2022.
The Russell is printing fresh relative lows as the 10-year tests the 5% level. Nothing new here.
Rising rates tend to benefit the cyclical value-oriented Russell 2000 index. But that hasn’t been the case since March 2021.
The continued deterioration of this once-positive correlation is another data point leading the market down a familiar path cleared by last year’s selloff.
Not all intermarket ratios or relationships are following along, though.
Small-cap value has yet to take over small-cap growth stocks on relative terms…
Calculating the equity risk premium using trailing earnings and forward earnings shows that stocks are at their least-attractive levels in 20 years relative to bonds, see charts below.
The equity risk premium measures the return in the stock market minus the return of the risk-free rate, and it tells investors something about equity returns relative to fixed-income returns.
In the equity risk premium formula, equity returns are normally calculated by looking at the S&P500 earnings yield, i.e., the inverse of the P/E ratio. Using forward earnings expectations can be misleading when the consensus expects a 55% chance of a recession, so another variant is to look at the S&P500 earnings yield using trailing earnings.
Either way, the bottom line is that with 10-year interest rates close to 5%, the stock market today is more unappealing than it has been in 20 years, see again charts below.
BESPOKE - Time for some stats, have a look
… 4th Longest Treasury Bear Market. Since its closing low of 0.51% on 8/4/20, the 10-year US Treasury yield has increased by over 4.25 percentage points (ppts) without a 1 ppt decline in between. Since 1962, that marks the fourth longest period behind those spanning 1971 - 1975, 2003 - 2007, and 1962 - 1966 that the 10-year yield has gone without its yield falling 1 ppt from a high since 1962. (Source: Bespoke)
Who Said Bonds are Boring? Over the last 200 trading days, the average daily change of the SPDR S&P 500 ETF (SPY) has been a gain or loss of 0.67%, while the iShares 20+ Year US Treasury ETF's (TLT) average daily move has been +/-0.91%. Since TLT's inception in 2022, there have only been ten other trading days - all in August 2015 - where its volatility relative to SPY was greater. (Source: Bespoke)
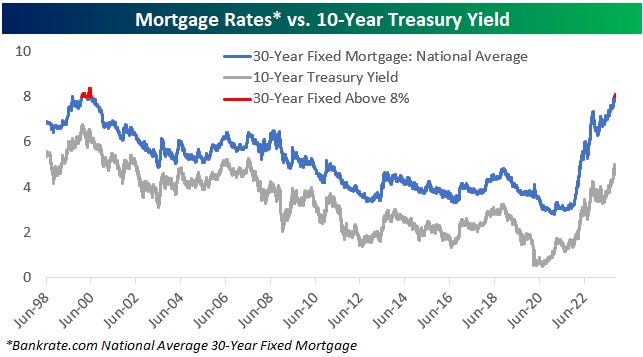
Eight is Not Great. The national average rate on a 30-year fixed mortgage reached 8% on 10/18 for the first time since June 2000. The current 3.1 percentage point spread between the 30-year fixed mortgage rate and the 10-year Treasury yield ranks in the 97th percentile of all periods in the last 25 years. (Source: Bankrate.com)
Bloomberg - Worst October for Stocks in Five Years Has Investors Exiting Market (all ‘bout the bond vol…)
Active manager poll, positioning show investors reduce risk
Bond volatility adds pressure amid a mixed earnings season
… “With yields much higher than they were six months ago, the stock market is going to have to fall to valuation levels that are more in line with historical levels,” said Matt Maley, chief market strategist at Miller Tabak & Co. “The most important issue is the very large divergence that has developed between the bond market and the stock market.
Bloomberg- S&P 500 Extends Drop From Its July Peak to 10%: Markets Wrap
… “The aggressive market selloff has been driven largely by technical factors, as fundamentals remain solid,” said Mark Hackett, chief of investment research at Nationwide. “This is fitting, given the strong bounce since last October was also largely technical. Signs of oversold conditions and supportive seasonality should lead to a bounce, though sentiment will need to shift, which could take a catalyst or a period of capitulation.”
LPL - Spending Growing Faster Than Income (well this doesn’t sound good or sustainable … but then, you didn’t ask me)
Key Takeaways:
Adjusted for inflation, consumers increased spending in each of the last four months while real disposable income fell over the same period. Clearly, this can’t last much longer.
Auto incentives brought in buyers last month as real spending on goods was driven by spending on autos, both new and used. The use of incentives obviously has implications for profit margins in the near future.
Not surprisingly, international travel was the largest contributor to the increase in real services spending in September. Airlines should not expect this level of spending in coming months.
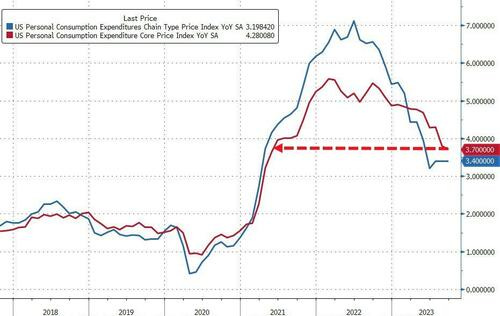
The annual core inflation metric decelerated to 3.7% from 3.8% in August and 4.3% in July.
Markets will likely struggle with processing the sharp 0.8% monthly rise in restaurant and hotel prices, the highest rate since October.
Bottom Line: Although consumer prices rose faster than expected from a month ago, core inflation continues to lose speed and this report will not likely change the Fed’s view that inflation will slow in coming months as demand slows. Eventually, spending will moderate after consumers spend more than they earn for several more months.
StockCharts.com - Bonds Now Beating Stocks While NVDA Goes into Tailspin
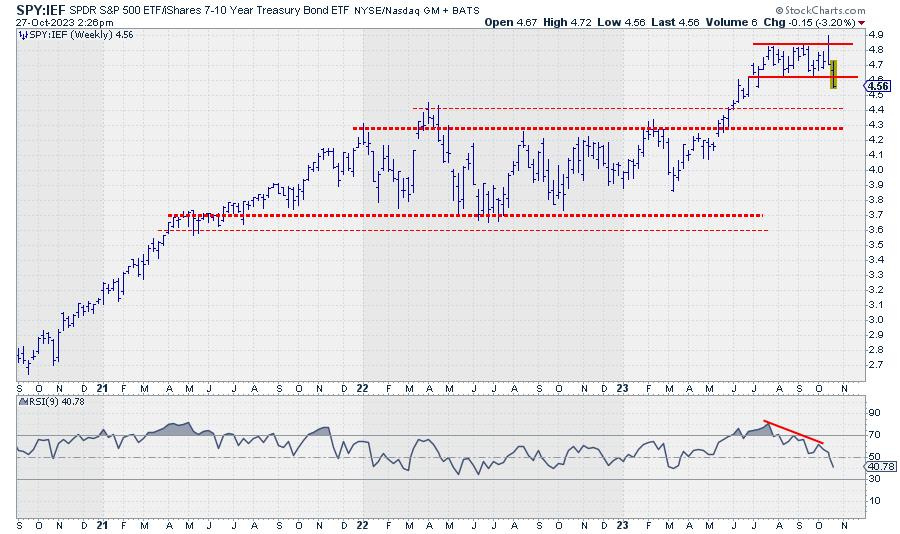
SPY:IEF completes top formation
One of the metrics I keep a close eye on is the ratio between stocks and bonds. Most of the time, I use SPY:IEF. (SPY, obviously, is the ETF that tracks the S&P 500 stock index, while IEF is the ETF that tracks the prices of US Government bonds with a maturity between 7-10 years.) In Sector Spotlight, I address that ratio on a regular basis when we talk about rotations in asset classes. When the ratio moves up, stocks are outperforming bonds, and vice versa. When the ratio moves down, bonds are outperforming stocks.
Looking at the chart above, the uptrend starting in March took the ratio from below 4 to the area between 4.8 and 4.9. This level was reached for the first time in July, after which SPY:IEF started to trade in a sideways range, between 4.85 at the top and 4.6 at the lower end.
Last week, the market took out the lower boundary of that range, completing a top formation. This means that the powers of supply and demand have now shifted in favor of Bonds. Just like the analysis of a regular price chart, we can apply essential technical analysis tools to these ratio charts.
As a first potential target, the area between 4.3 and 4.4 shows up. The level of major peaks formed in 2022. The upside is now expected to be kept at the breakout level, i.e., 4.6. So, the upside potential is now much less than the downside risk…
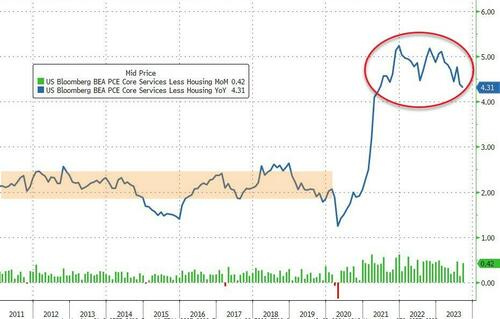
WolfST- Powell’s Gonna Have a Cow When He Sees the PCE Inflation in “Core Services,” Housing, and Non-Housing Core Services
ZH: Savings Rate Plunges As Spending Soars; Inflation Slows As Govt Wage Growth Nears Record High
… One of The Fed's favorite inflation indicators - Core PCE Deflator - slowed to 3.7% YoY in September (its lowest since May 2021). Headline PCE was flat at 3.4% YoY. Both were in line with expectations...
However, while the YoY data slowed, Core PCE rose by 0.3% MoM - the biggest MoM jump in four months…
… Even more focused, is the Fed's view on Services inflation ex-Shelter, and the PCE-equivalent shows that it is slowing/trending lower but very much still stuck at high levels (and rose a large 0.4% MoM)...
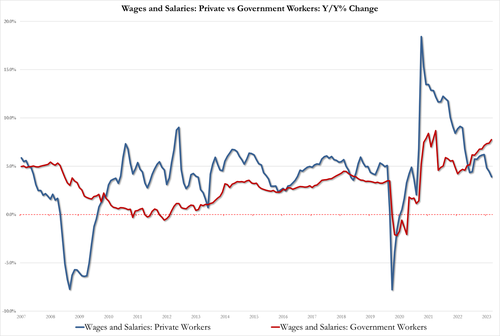
…So where is the offset to hot wages you may ask? Why government workers: wages of govt workers are up 7.8% YoY vs 7.4% in August and approaching the record high of 8.7% in Oct 2021
All of which means the personal savings rate collapsed even further, from 4.0% to 3.4% of DPI...
Source: Bloomberg
The savings rate is down 4 straight months, back near record lows... AND this is after artificial revisions that artificially boosted the savings rate 3 times in the past year (see above chart)
Bidenomics, hard at work.
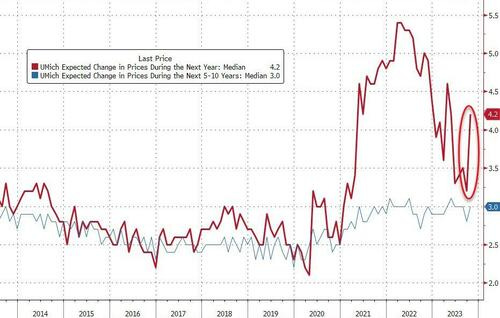
ZH: UMich Inflation ExpectationsExploded Higher In October: "Consumer Frustration Appeared Everywhere"
…In its preliminary October data, UMich inflation expectations for the next year surged to 3.8%.. by the end of the month, the final data showed it had spiked to 4.2% - the highest reading since May 2023 (with the medium-term expectation at 3.0%)...
… AND for any / all (still)interested in trying to plan your trades and trade your plans in / around FUNduhMENTALs, here are a couple economic calendars and LINKS I used when I was closer to and IN ‘the game’.
First, this from the best in the strategy biz is a LINKthru TO this calendar,
The All-Star charts are amazing, especially how the cups & trend lines interact/intersect. WolfSt has great US stock index charts. The indexes have done a round trip since peak QE & March 2023's BTFP.


And I wasn't depressed enough, already.....Just Kidding !!!!
At least I found out what Thing 1 was...first I thought it was a movie....LOL
Have a great time, together...
Excellent information about our Economic Health(or Sickness)..
Heard MarketWatch say they're looking for 1.5T, up from 1T, for the Q4 Refunding.....
In 2024, as the Geniuses at the US Treasury, continue rolling Paper near the 5%,
I'm looking for a 2T Quarterly Refunding level to happen.......
Like a Slow Motion Train Wreck.............
Someone will have to Pay the Piper, someday......Hope it's Joe Biden's Re-Election bid,
that's first in line.....
Thanks for your Expertise !!!!!
The All-Star charts are amazing, especially how the cups & trend lines interact/intersect. WolfSt has great US stock index charts. The indexes have done a round trip since peak QE & March 2023's BTFP.