weekly observations (07.29.24): bullish tech setup (BAML); REAL funds TIGHT, to be cut (BREAN); stay LONG 5s (BMO) & more; PCE 'awkwardly stagnant at elevated levels' ... TESLA motorcycle?
Good morning / afternoon / evening - please choose whichever one which best describes when ever it may be that YOU are stumbling across this weekends note…
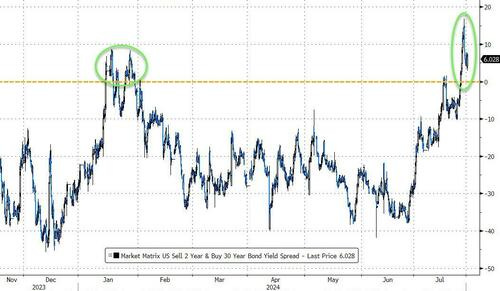
I’ll begin with a fresh palette and attempt to find something of a level of interest to watch in the coming days and FOMC week ahead … this leads me to the front end of the curve …
2yy WEEKLY: momentum is overBOUGHT and I get it, as a rate cutting campaign about to get under way (reference overBOUGHT / extended period of time in COVID era) and so … time at a price (or lower yields ahead) OR … <gulp> it’s gonna be different this time … ?
NEXT, I’d like to offer a couple / few things items from the week just passed (in other words, a couple snarky ZH links which contain visuals and info graphics helping tell the tale of markets — INCLUDING rates — which you may / may not have already stumbled upon) …
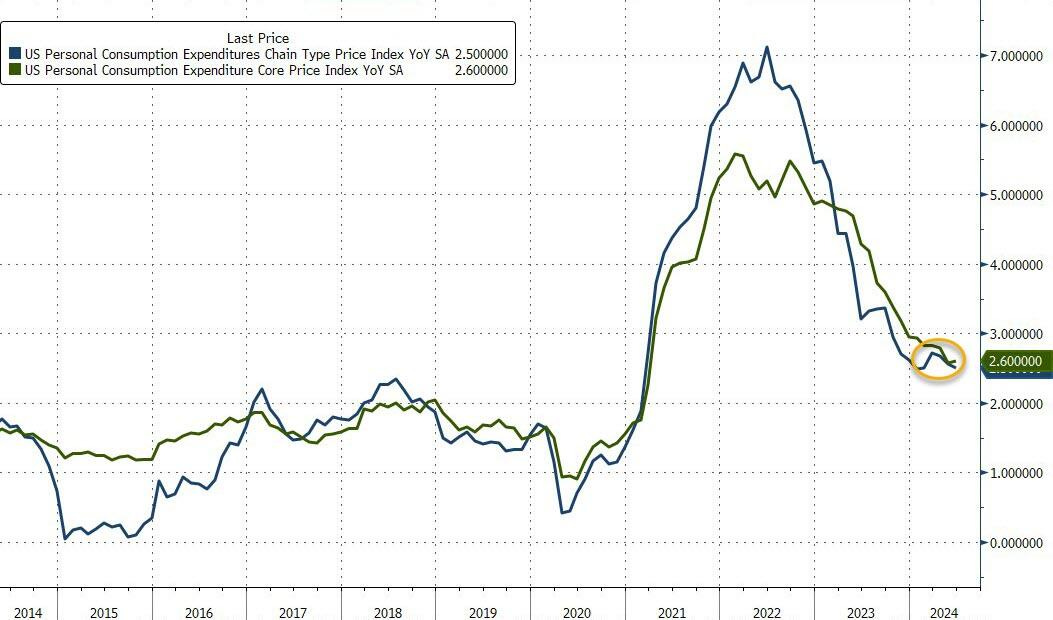
ZH: Fed's Favorite Inflation Indicator Unexpectedly Jumped In June; Savings Rate Slumps (wait, what? but … rate CUTS? …‘awkwardly stagnant at elevated levels’ ..?)
… The Fed's favorite inflation indicator - Core PCE - instead came in slightly hotter than expected, rising 2.6% YoY (vs +2.5% YoY exp). The headline PCE dipped to +2.5%...
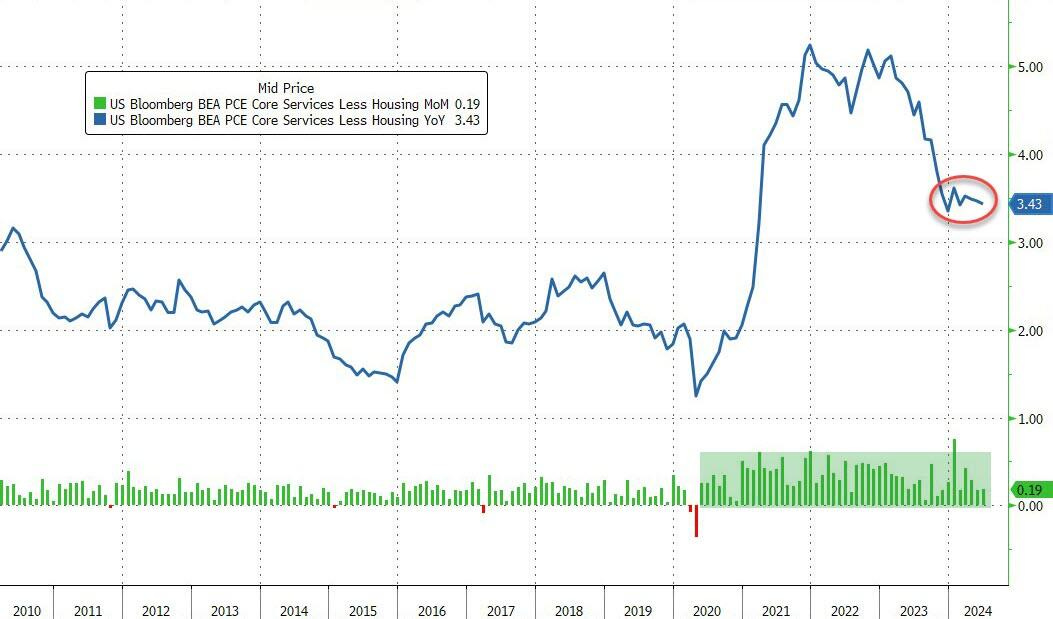
… Even more notably, the so-called SuperCore PCE rose 0.2% MoM, which saw YoY rise to 3.43%... which is awkwardly stagnant at elevated levels...
… WHICH, by days / weeks end translated into another clubbing of MAG7, some UST recovery (led by rate cut hopes clinging on for dear life, front end BID and further dis / un / inversion of the yield curve) …
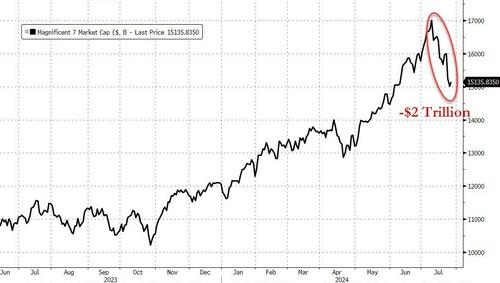
ZH: Two Trillion & Counting... The Mega-Cap Meltdown Continues
Since peaking on July 10th, the market cap of the Magnificent 7 stocks has dropped a mind-numbering $2 trillion...
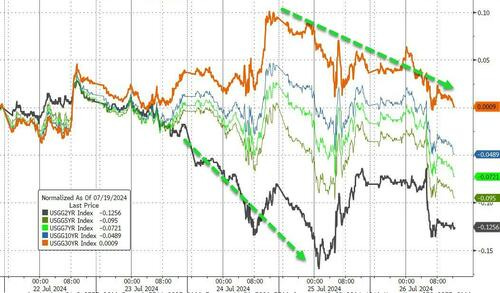
… Treasuries have been broadly bid the last two days, with the long-end lagging (but managing to get back to unchanged on the week today) as the short-end yields tumbled...
This drove the yield curve (2s30s) to disinvert most sine July 2022...
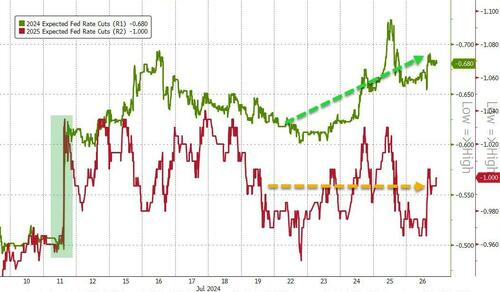
Rate-cut expectations rose modestly on the week (focused fully in 2024 as 2025 remained flat)...
… Ok I’ll move on AND right TO the reason many / most are here … some WEEKLY NARRATIVES — SOME of THE VIEWS you might be able to use — and which Global Wall Street (and, on occasion, other 3rd party sources) are selling HOPING for street cred and / or FLOW …
THIS WEEKEND, here (more than) a few of the best in the biz (still out looking for Institutional Investor votes) and things which they are sayin / sellin and which stood out to ME …
Rates: Curve twisters US: Risks building in funding markets & for deleveraging risk; stay short spreads.
…Bottom line: we are increasingly concerned about funding markets and deleveraging risks; stay short spreads. On duration, hold long bias; on curve, steepening confidence is growing. Refunding could flag increase coupon supply risk, which would exacerbate supply / demand concerns. July FOMC will likely suggest Fed “closer” to cuts but hold off on explicit Sept signal until after NFP & CPI; Fed unlikely to address brewing funding risks.
…Technicals: Two bullish 10Y UST scenarios …Scenario 1 is bullish sooner: The 50d SMA is crossing below a declining 200d SMA and implies 70-80% of the time yield is lower 25-65 days later. So buy the dip as the trend line breaks and yields fall. Scenario 2 is bullish later in H2: A triangle pattern forms. Yield continues to oscillate between converging lines in Q3 and breaks lower in Q4. Some risk that the moving average cross signal flips up and down again …
The 50d SMA is looking like it is about to cross below the 200d SMA on the daily chart of US 10Y yield pictured above. Since 1962, there have been 47 such crosses and a modest tendency for yield to be lower 35-55 trading days later or 60-62% of the time (Exhibit 29). When the 50d SMA crossed below the 200d SMA and the 200d SMA was sloping down, yield was lower 70-80% of the time 25-65 trading days later (Exhibit 30). Currently, the 200d SMA is sloping down…
BARCAP: Global Economics Weekly: Not everyone gets a medal
Amid an equity sell-off, US economic data may show soft spots but remain solid overall. Meanwhile, signals out of Europe and China are weaker. Next week, we expect the Fed to stand pat, the BoJ to hike, and the BoE to cut. The key data will be euro area inflation and Q2 GDP, China PMIs, and US ISM and labour market data.
BARCAP: June PCE: Spending shows continued resilience
Real PCE rose 0.2% m/m in June, with disruptions in auto sales dragging down durable consumption. The likely payback in July, strong household fundamentals, income gains, and the low saving rate place household spending on very solid footing in Q3.
BMO: Payrolls Week is Back! (staying short 5y BREAKS and LONG 5y nominals, expecting ‘dovish HOLD’ from the Fed …)
… This is the juncture at which the policy outlook becomes far less obvious. In the event the real economy performs as it has been – solid growth and employment, accompanied by cooling inflation – there is a case to be made for a total of 75 to 100 bp of total cuts (in quarter-point increments) followed by a pause to assess their impact as well as any influence from the fiscal side. However, there is a lot that can change in the trajectory of the economy over the next 12 months, especially given the fact that July 26th marks the 1-year anniversary of the 5.50% terminal rate. With lingering angst regarding the indeterminate lag of monetary policy actions hitting growth, inflation, and employment – we still find ourselves in the mode of awaiting the next proverbial shoe to drop.
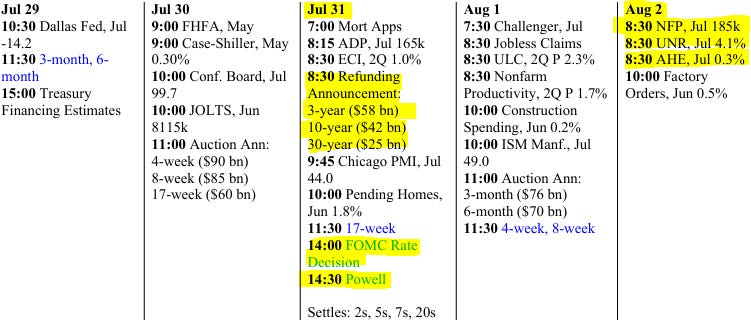
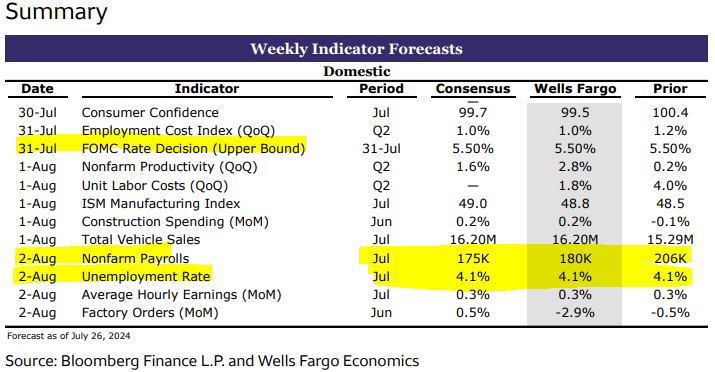
Given the combination of the Treasury Financing Estimates, August Refunding Announcement, FOMC decision, Powell’s press conference, and the July Employment Situation report, investors will not lack guidance on the fundamental side. Powell’s tone will leave the takeaway from the Fed as a ‘dovish hold’ and we see little reason to fade a solid, but not overheating, employment profile. The steadily increasing unemployment rate and investors’ focus on the Sahm Rule will easily make Friday’s session the defining event of the week. In fact, that is our baseline assumption given the Treasury Department has already indicated it will hold coupon auction sizes steady for several quarters, any excess borrowing needs will be absorbed in the bill market, and the FOMC has no incentive to shock or surprise on Wednesday. In short, payrolls week is back! …
The slowing we expect in July job growth (165k versus 206k prior) would likely underestimate the true underlying pace of job creation. Hurricane Beryl affected Texas and Louisiana during the payrolls survey week, potentially weighing on the number.
We project the unemployment rate to remain unchanged at 4.1% following three consecutive increases. Another increase in the jobless rate to 4.2% would trigger the Sahm rule.
A 0.4% m/m increase in hourly wages would reflect an expected reduction in hours worked due to weather impairment and utility outages as well as utility-worker overtime pay. The hurricane distortions are expected to reverse in August.
Brean Economics Weekly: Next week's FOMC meeting and labor market data, domestic demand trends, corporate profit signals
In the attached Weekly we look ahead to next week’s FOMC meeting and labor market data following another encouraging inflation reading. We discuss the underlying trends in domestic demand from this week’s second-quarter GDP report and we draw out some signals on economy-wide corporate profits.
… only 22% of the components of trimmed mean PCE prices (weighted by their shares in total spending) rose at a 5% or faster rate in June, which compares to an average of 42% in the first five months of 2024, 41% in 2023 and 56% in 2022. June 2024’s 22% share of trimmed mean components that rose at a 5% or faster rate is only modestly higher than the 18% average in the three years preceding the pandemic …
… So where does this leave the Fed in its signaling on the policy outlook next week? We have pointed out that the real fed funds rate based on core PCE prices has risen materially since the Fed stopped hiking the nominal fed funds rate in July 2023. Adjusted using core PCE prices, the real fed funds rate in June 2024 was 2.8%, which compares to a 1.2% real rate when the FOMC last raised the nominal fed funds rate target in July 2023 …
… We think Powell will be in a position at next week’s FOMC meeting to set the stage for a September rate cut—now fully priced into interest rate futures markets—providing the data between now and that policy meeting suggest further progress toward the 2% inflation target and a more balanced labor market. Our view is that the focus of FOMC participants will increasingly shift to setting monetary policy in order to sustain the expansion while trying to nudge inflation a little lower, rather than just trying to lower inflation.
DB: US Fixed Income Weekly (facts change. we change. what do you do … never mind)
…US rates forecast update We update our UST yield forecast. In line with DB's US Economics team's recently revised Fed call, we assume three sequential 25bp cuts starting in September, followed by a pause in the first half of next year and resumed cuts in H2. We assume a nominal neutral rate of 3.5%, slightly below our prior forecast, and moderate our outlook for term premia slightly, bringing them more in line with historical norms.
The resulting baseline forecast has the 10y UST yield at 4.25% at year-end, with yields across the curve modestly above forwards. The forecast generally sees frontend spreads (2s5s) a bit flatter than forwards, reflecting a more gradual pace of cuts over 2025 than the market is pricing, and long-end spreads (5s10s and 10s30s) slightly steeper than forwards, reflecting a projected rise in term premia.
We also consider two alternative scenarios, one loosely based on a unified government election outcome and the other on sharper labor market slowdown. In these alternatives, 10y UST reaches 5% and 3.4% at year-end, respectively…
DB: Investor Positioning and Flows - Sharp Pullback But Not There Yet
Over the last several weeks we have been flagging that equity positioning had become very elevated after a sharp but lop-sided climb led by mega-cap growth and Tech stocks. With earnings growth a key driver of positioning, the Q2 earnings season has been a catalyst for a rotation and a pullback (Q2 2024 Earnings Preview: Looking For Growth To Pick Up And Broaden, Jul 1 2024; Will Sector Positioning Rotate This Earnings Season? Jul 12 2024; Rotations, Politics And Pullbacks, Jul 19 2024). Equity positioning in our reading fell sharply this week to a 2-month low and is now slightly below the lower end of the tight range it had been in from February to early June before its recent break to the upside (z score 0.50, 74th percentile). As with the climb in positioning, the drop has been led by MCG & Tech, while that in other sectors has gone largely sideways. Can we declare an all clear? In our reading, not yet.
JPM: Is the “Trump Trade” a good deal? (10s and 2016 visual had me at hello)
…The first Trump trade was characterized by small caps (which outperformed large cap equities by nearly 8%), the energy sector (which outperformed the broader index by over 10%), the 10-year Treasury bond (yields rose by almost 100bps), and the 2- and 10-year yield curve (which steepened by 17bps).
Yields of 10-year Treasuries soared after Trump’s 2016 win 10-year U.S. Treasury bond yields, %
… How are markets responding to the prospect of Trump 2.0? Bond yields: This time, bond yields across the curve have declined since President Trump’s odds have increased, but the yield curve has steepened. Said differently, shorter term interest rates are moving lower faster than longer term interest rates. To us, that suggests that central bank policy expectations are the primary driver of bond yields, and not the election. This is perhaps the biggest difference between 2016 and today. Then, the central bank was desperate for any signs of inflation that would allow them to raise rates above nearly 0%. Today, the central bank is desperate for confirmation that inflation is low enough to allow them to lower rates from 20-year highs. The key risk for bond markets is that protectionist economic policy, such as increased tariffs and less immigration, will reduce growth and increase inflation at the same time that the extension of tax cuts will increase the deficit. The good news right now is that it seems like bond yields are taking their cues from the growth, inflation, and central bank policy outlook.
MS: Citius, Altius, Fortius | Global Macro Strategist (stay in 2s20s steepener)
The Olympic motto reads "Faster, Higher, Stronger – Together." It could have been used as the motto for central bank policies, inflation, and growth in 2022 and 2023. "Slower, Lower, Weaker – Together" seems a more appropriate description in 2024, unless recent weakness in equities extends further.
…Interest Rate Strategy United States Coming full circle:In March 2022, we noted that the 2s10s yield curve was going to invert, without necessarily suggesting that a recession would follow. Nearly two and a half years later, the 2s10s yield curve has been steepening recently and appears about to dis-invert again. And we still expect the US economy to stage a soft landing. Decomposing the yield curve, rate expectations led the flattening while term premiums have led the steepening, opening the door for the curve to be steeper versus the last 10 years.
July FOMC preview: We see a bullish bias to short-term yields driven by the Fed meeting, and some bearish election and seasonality-driven bias higher into long term yields – increasing the chance that the yield curve can continue to steepen. We maintain 2s20s steepeners into the July FOMC.
Treasury refunding preview: On Monday at 3:00pm ET, Treasury will release its updated privately-held net marketable borrowing estimates for 3Q24 and 4Q24. For 3Q24, we estimate $649bn relative to the $847bn estimated by Treasury before May refunding, following the lowering of the run-off cap for Treasury securities to $25bn per month in June. At August refunding announcement on Wednesday 8.30am ET, we expect Treasury will keep both nominal coupon and FRN auction sizes unchanged, in accordance with its regular and predictable issuance strategy.
The data are telling us that disinflation is what will convince the Fed to start cutting, not weakness in growth or the labor market. Spending, output, and jobs growth looks to remain resilient. We continue to forecast three 25pt cuts this year, starting in September.
UBS: Term premium vol – A risk to the US rates view
Bond yields have declined over the last few weeks, particularly in the front of the curve, as we move closer to Federal Reserve rate cuts. We believe they will fall further and continue to forecast and position accordingly.
The view assumes that macroeconomic fundamentals —inflation and growth, and the Fed’s reaction to them—will be the main driver over the next 6-12 months. Historically, this has been the case, but term premium volatility is a risk to that view.
Term premium volatility has resurfaced as a sporadic driver of rates in the post-pandemic world, given unsustainable fiscal trajectories and quantitative tightening. US rates markets are not pricing in greater US Treasury (UST) supply risk at the moment.
Rising odds of a Trump victory in the 2024 presidential election and the associated potential economic policy uncertainty are key concerns for fixed income investors due to term premium volatility. The election is still three months away—an eternity in politics. Much can change as the odds of a second Trump presidency ebb and flow.
… Interest Rate Watch: Wake Me Up When September Ends The only change we expect out of next week's monetary policy meeting is for the FOMC to signal rate cuts are coming as early as its next meeting in September. Inflation progress resumed in Q2, and the labor market is softening—both developments position for Fed easing.
… Moving along and away FROM highly sought after and often paywalled and Global Wall Street narratives TO a few other things widely available and maybe as useful from the WWW
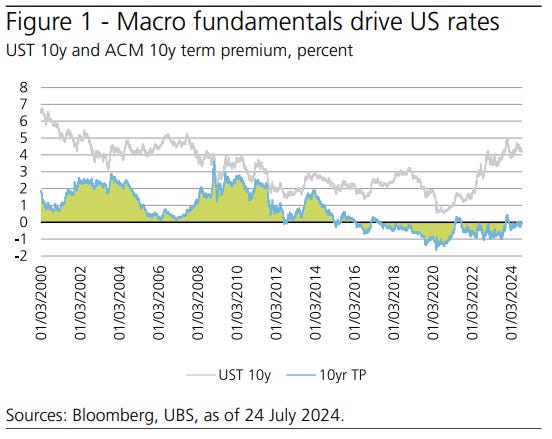
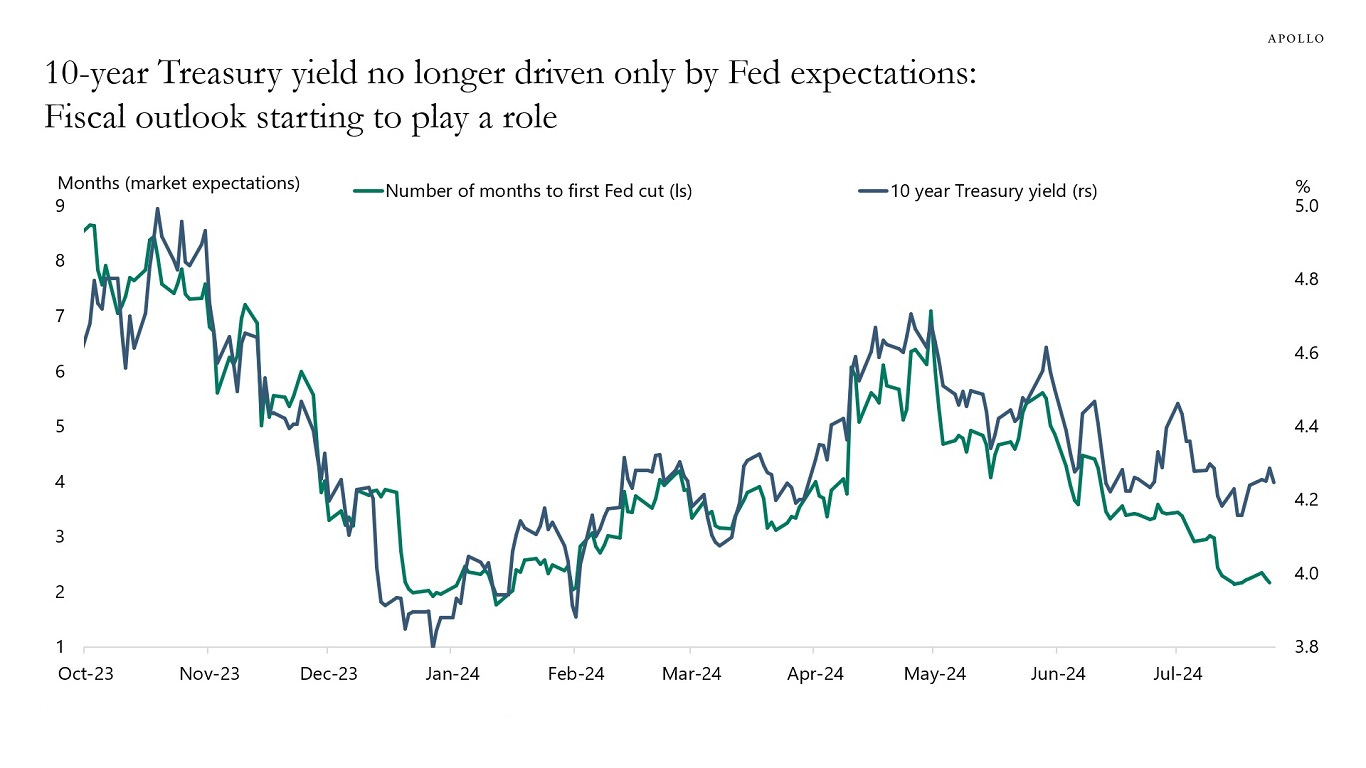
Apollo: 10-Year Interest Rates Disconnecting Further from Fed Expectations
The gap between Fed pricing and long rates continues to widen, suggesting that factors other than Fed expectations, likely including the fiscal outlook, are beginning to play a role for long rates, see chart below. For more discussion, see also here.
Apollo: Watching the Daily and Weekly Data for the US Economy
The daily data for the past week shows that restaurant bookings are still strong, TSA travel data is still strong, and tax withholding data is still strong.
The weekly data shows that jobless claims improved, weekly retail sales data is still strong, weekly hotel demand remains strong, weekly data for bank lending is growing, weekly data for bankruptcy filings is trending lower, weekly data for Broadway show attendance is strong, weekly box office grosses are strong, and weekly S&P 500 forward profit margins are near all-time highs.
Crescat: THE BEAR CASE FOR THE DOLLAR (interesting / BULLISH / pic of 2yy)
… When Resistance Becomes Support
The historical trend of short-term interest rates also reinforces our expectation of several forthcoming interest rate cuts. Consequently, the narrowing interest rate differential between the Fed and other central banks is likely to put further downward pressure on the US dollar.
Not to mention, we believe the risk of a recession has significantly increased in recent months, particularly with the steepening of the yield curve from deeply inverted levels. In our view, today’s suppression of volatility is characteristic of what we often see before a recession, commonly referred to as the calm before the storm.
We believe the 2-year yield is likely to re-test its prior resistance level forming a major support.
There is some mild weakness in the weekly Census business formation statistics and the ASA temp worker staffing index.
Combined with the strong GDP report for the second quarter, the bottom line is that some pockets of weakness are emerging, but the high-frequency indicators show that overall growth remains solid. Consistent with the latest GDP report and the latest monthly report for retail sales.
Bottom line: There is nothing suggesting that the economy is currently in a recession or about to enter a recession.
Our chart book with daily and weekly indicators is available here.
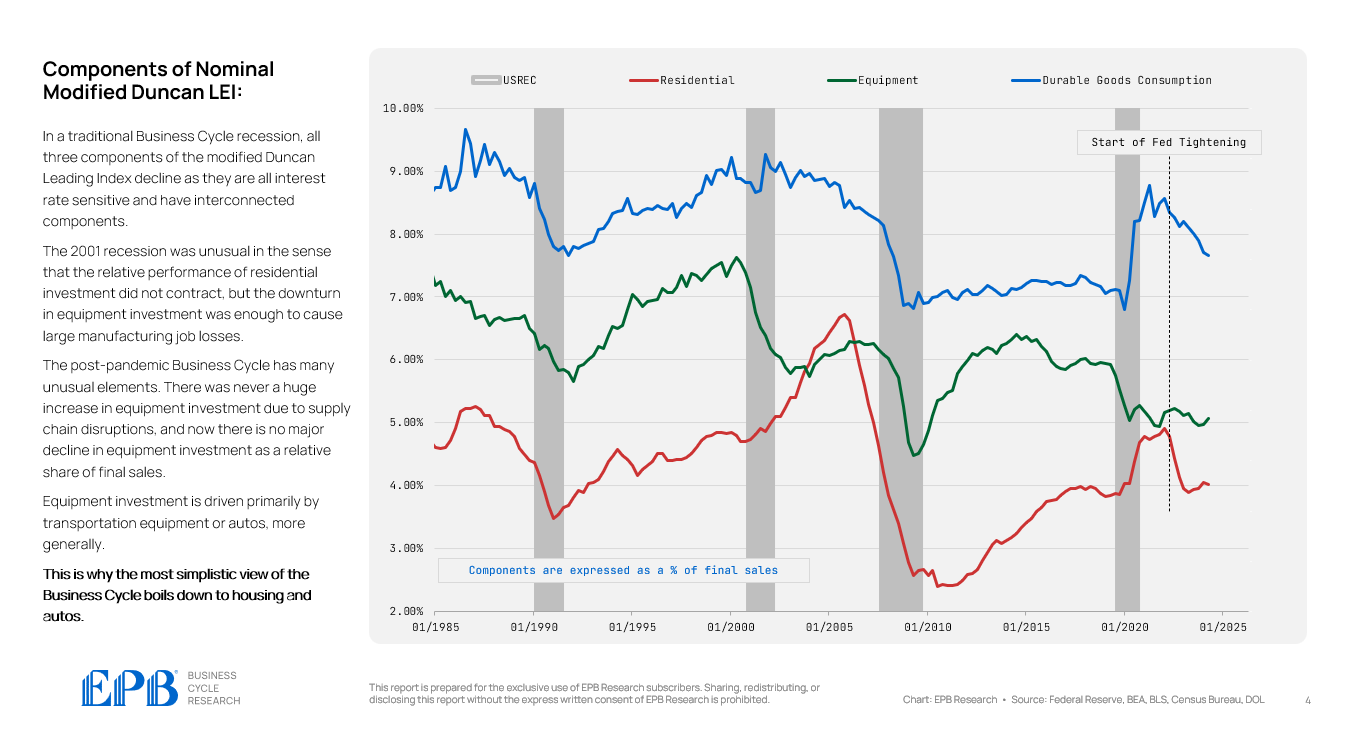
EPB: The Post-COVID Business Cycle (Chart Of The Week)
… In a traditional Business Cycle recession, all three components of the modified Duncan Leading Index decline as they are all interest rate sensitive and have interconnected components (see 1990 and 2008 recessions).
The 2001 recession was unusual in the sense that the relative performance of residential investment did not contract, but the downturn in equipment investment was enough to cause large manufacturing job losses.
The post-pandemic Business Cycle has many unusual elements. There was never a huge increase in equipment investment due to supply chain disruptions, and now there is no major decline in equipment investment as a relative share of final sales…
The rise in the unemployment rate has raised concerns about the possibility of a recession, but the story is not as simple as the usual rules of thumb.
… The Sahm rule is currently sending the right cautionary message about the labor market cooling, but the volume is too loud. The swing from labor shortages caused by the pandemic to a burst in immigration is magnifying the increase in the unemployment rate. At the same time, the demand for workers is softening. A recession is not imminent, but the risks of a recession have risen.
SpectraMarkets: Friday Speedrun! Degrossed. (CPI chart had me at hello)
…CPI came in softer than expected and then the NASDAQ dropped 10%. Wut? But that’s often how markets work. In fact, we saw the mirror image at the ding dong lows in October 2022. After that worse than expected CPI report, stocks went down for about 10 minutes and the proceeded to rally almost exactly 100% over the next year and a half. Craziness.
… Interest Rates Interest rate markets are boring right now as the looming economic slowdown fails to materialize quickly but also hasn’t really gone away. US GDP came in stronger than expected (Atlanta Fed GDPNow wins again!) and the US economy is totally fine. The soft landing and immaculate disinflation continue, and the Fed is absolutely locked into a rate cut in September at this point. It would take a geopolitical event or market collapse to justify 50bps in September and almost no imagineable string of US data could prevent the cut now, I think.
The only action is in the curve, where steepening continues.
The inversion of the yield curve lit up the recessionistas two years ago and the disinversion is likely to light them up again. At some point, if you call for a recession for long enough, you will be right ofc.
The current setup in bond markets is super interesting to me because you have basically perfect certainty for the next three months (not quite, but close) and then much, much more uncertainty than normal after that. With no visibility on fiscal policy in 2025/2026, the Fed can’t really predict or forwardly guide what they’re gonna do. They have to play it one month at a time and see who wins the election and how committed that winner is to continuing the MMT policies made mainstream by Stephanie Kelton Donald Trump and continued by Biden…
WolfST: Large Upward Revisions of “Core Services” PCE Inflation Pushed Six-Month “Core” PCE Inflation to 3.4%, Worst in a Year
Fed’s Wait-and-See on rate cuts makes sense amid heavily revised whiplashy data and still too high inflation.
ZH: Bidenomics Failure Worsens As Credit Card Delinquency Rate Hits 12-Year High
… AND for any / all (still)interested in trying to plan your trades and trade your plans in / around FUNduhMENTALs, here are a couple economic calendars and LINKS I used when I was closer to and IN ‘the game’.
First, this from the best in the strategy biz is a LINKthru TO this calendar,


I have got to believe that Chairman Powell will have Friday's NFP report in hand for Wednesday's decision.
Given the Fed meeting calendar,
it would not be totally bad idea to cut
25, here in July, if that NFP is weak enough. It would surprise the market,
but once the NPF comes out weak, the market would understand.
There is no Fed meeting in August or October.
September is the last meeting before the election.
They could cut once here and wait and look very measured and non-political.
Similar to what the European Central Bank did.
I heard ex-NY Fed Gov. Bill Dudley joined TEAM RATE CUT......