Good morning / afternoon / evening - please choose whichever one which best describes when ever it may be that YOU are stumbling across this weekends note…
First UP, when TLINES fall … The trend is yer friend until said trend bends. What do we do? Welp, we break out NEW crayons and get back to work ahead of this upcoming weeks liquidity events (duration on offer — $58bb 3s, $38bb 10s and $22bb Bonds) …
30yy WEEKLY: 5.15, 5.00, 4.80, 4.75% and 4.50% …
… momentum appears to be leaning bullishly, still and so, any sort of ‘dipORtunities’ that arise may very well be viewed as concession …
… and with an updated / bullish visual of long bonds in mind, it would seem that Global Wall remains bullish (MS) and / or becoming more so (Goldilocks out with new and freshly lowered rate calls, now expecting 10s to end year 4.20 (vs previously suggesting 4.50%).
On the latter, and for all us ‘muppets’, Goldilocks doesn’t seem to be going too terribly far out on any limb as it would appear to ME that 10s closed the week approx 4.35%.
Still, interesting to note that because or despite yesterdays data once again making a mockery of ADP, showing top line strength with devils in the details, well, folks are becoming more comfortable with the idea of lower rates and suggesting we all jump on board.
I’m only now hesitant as it becomes more mainstream (even as I was extremely late to the idea) and specifically because of the OBBB and how Mr. Markets interpret it from an inflation POV.
As long as the longer-end of the bond markets are calm in the coming days, we’ll be OK.
IF the bond market starts BEAR steepening, there will likely be ‘trouble’.
YES, lots of folks have fully endorsed and embraced the steepening trade (couple years running) but this is NOT — repeat NOT — the steepening trade they forecast and suggested.
Lets HOPE (not a strategy) it doesn’t happen.
Meanwhile, with US equity markets CLOSED, the EZ markets are thinly traded and lower largely due to … TARIFFS news (more in a sec)
Now’s likely a good time to refresh why it is that maybe, just maybe TARIFFS aren’t inflationary … a reminder from the intertubes and Lord Abbett …
February 18, 2025 Lord Abbett: Addressing Investor Questions on Tariffs and Inflation
… Historically, tariffs are not inflationary in that they do not set off a permanently higher rate of price increases. Their implementation typically results in a level upward adjustment of the price of tariffed goods by some amount; what sustains that rate of increase is broader conditions in the economy. Tariffs certainly have a cost. They have the same effect as a price increase stemming from any other cause, in that people will pay more for the goods they are buying. But as long as tariffs are not increased, they have a one-time effect and so do not permanently accelerate the rate at which prices are increasing. Typically, they drop off after some period, at which point the inflationary effect goes away.
Bottom line, the tariffs do increase prices for consumers, but they don’t by themselves usher in higher inflation…
… Alrighty, then.
Before a quick recap of Thursday’s data followed by Global Walls victory laps, this just in, on TARIFFS, clearly impacting GLOBAL Wall (as the US has stepped away from their Terminals) …
Updated on July 4, 2025 at 4:50 AM UTC Bloomberg: Trump to Send Tariff Letters From Friday, Floats 10%-70% Range
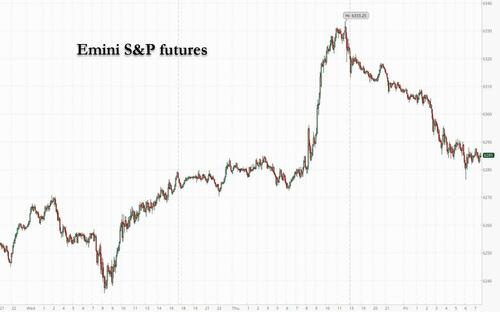
US equity futures slumped on Friday after the latest threat on tariffs from the Trump administration sparked selling across global markets on a day the US cash market is closed for the July 4th holiday. S&P 500 futures fell 0.6% after the index melted up all week, and closed at a fresh all-time high, with payrolls data affirming the economy’s resilience. Trump dialed up trade tensions after Thursday’s close, warning partners he may start setting levies of as much as 70% unilaterally as soon as today ahead of a July 9 deadline for negotiations.
Trump told reporters that about “10 or 12” letters would go out Friday, with additional letters coming “over the next few days.” …
…The S&P 500’s surge has put it on the verge of triggering a sell signal, according to BofA's Michael Hartnett. The CIO advised that investors consider trimming their holdings once the index climbs beyond 6,300, a level just 0.3% above where it closed on Thursday. He also reiterated that bubble risks are mounting into the summer, especially following the House’s approval of a $3.4 trillion fiscal package featuring tax cuts.
“Overbought markets can stay overbought as greed is harder to conquer than fear,” Hartnett wrote in a note…
AND a few NFP (and other relevant) related links from the intertubes …
ZH: Blowout June Payrolls: 147K Jobs Added, Smashing Expectations; Unemployment Rate Drops To 4.1%
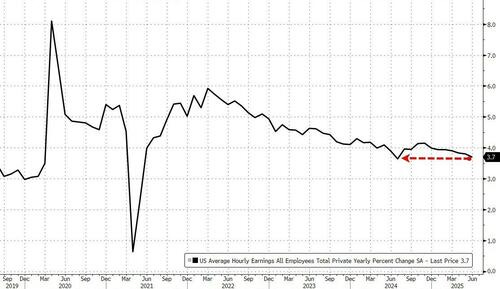
… There was more good news for the inflation-panicking Fed: average hourly earnings rose just 0.2% MoM, below the 0.3% expected, and down from 0.4%, while the annual earnings growth was 3.7%, down from a downward revised 3.8%, and below the 3.8% estimate.
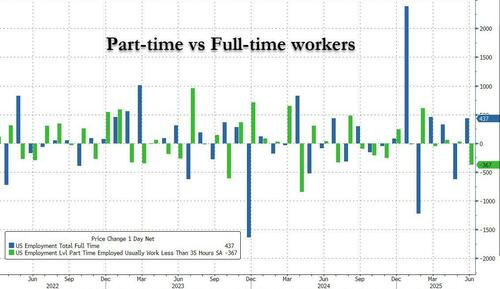
…But wait there's more: whereas in the past the BLS was known to pad the top line number thanks to part-time jobs at the expense of part-time, that was not the case this time as Full-time workers rose by 282K, while part-time workers tumbled by 367K.
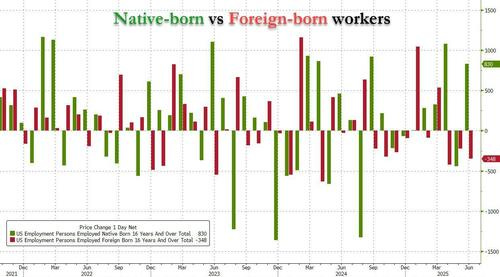
Last but not least, and perhaps most important, the number of native-born workers surged by 830K to a record 132.653 million, while foreign-born workers tumbled by 348K to 31.231 million, the lowest this year.
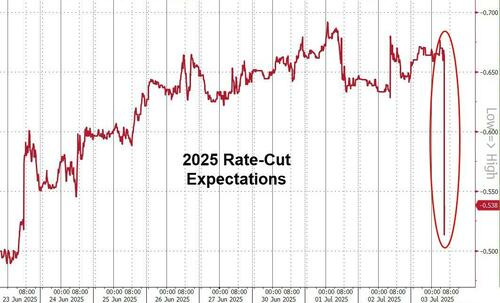
Overall, this was a stellar jobs report - at least relative to expectations - and one which has not only sent yields and the dollar soaring (with traders wrongfooted by the politically-motivated ADP once again), but odds of a July rate cut pretty much gone and odds of later rate cuts in 2025 also sliding rapidly.
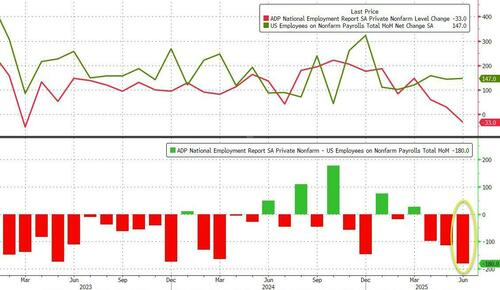
Oh, and finally, never listen to ADP ever again: with a near-record spread of 180K between the two series (-33K for ADP, +147K for NFP), the ADP Private Payrolls report has as much credibility as the marxist cesspool that is the UMich consumer confidence survey.
ZH: Trump Sparks Domestic Labor Renaissance: Native-Born Workers Surge To Record High As Foreign-Born Plunge
CalculatedRISK: June Employment Report: 147 thousand Jobs, 4.1% Unemployment Rate
Bonddad: June jobs report weakness: not enough for “recession watch,” but not too far away either
ZH: Services Surveys Signal 'Expansion' In June, Inflation Fears Remain High
I’ll move on TO some of Global Walls WEEKLY narratives — SOME of THE VIEWS you might be able to use. A few things which stood out to ME this weekend from the inbox
First up on JOBS …
3 July 2025 Barclays: June employment: Softer under the hood
Although headlines from today's employment data overstate the strength of the labor market, this report is likely to keep the FOMC on the sidelines. Under the hood, we see signs of gradual deceleration that align well with our outlook, with private payrolls decelerating and wages losing momentum.
July 3, 2025 BMO: Payrolls Stronger, July Fed cut odds decline -- TSY Selloff
Headline payrolls outperformed expectations at 147k in June vs. 144k prior and 106k consensus. Private-NFP disappointed at 74k vs. 100k expected and 137k prior. This is the lowest since October 2024. The two-month net revision was +16k vs. -95k prior. The Unemployment Rate unexpectedly declined to 4.1% vs. 4.2% May and 4.3% anticipated. On an unrounded basis, the unemployment rate was 4.117% vs. 4.244% prior. This was the first decline in the UNR since the beginning of the year and in unrounded terms, the UNR is the lowest since January. The Labor Force Participation Rate slipped to 62.3% vs. 62.4% May and 62.4% expected. On the wage front, AHE printed at +0.2% vs. +0.4% prior and +0.3% consensus -- the YoY pace slipped to 3.7% vs. 3.8% prior and 3.8% forecasted. Underemployment also ticked lower to 7.7% vs. 7.8% prior. Initial Jobless Claims unexpectedly dropped to 233k vs. 241k expected and 237k prior. This is a 6-week low. The 4-week moving-average fell to 241.50k from 245.25k. Continuing Claims came in at 1964k vs. 1962k and 1964k prior. The trade deficit widened slightly more than expected in May, coming in at -$71.5 bn vs. -$71.0 bn expected and -$61.6 bn prior was revised to -$61.6 bn. Overall, it was a strong set of data that implies the Fed will remain on hold later this month, leaving rate cut expectations focused on the September FOMC meeting…
Jul 3, 2025 Brean Economics Commentary: Payrolls rose 147K in June, boosted by public education workers; unemployment rate slipped to 4.1%
Key Takeaways: The June employment report beat expectations as a 147,000 increase in payrolls and the drop in the unemployment rate to 4.1% from 4.2% portrayed a labor market that continues to expand at a solid rate. The report did have its blemishes (73,000 of the increase in total payrolls came from government, total hours worked declined, and more than half the decline in unemployment was a reduction in the labor force). However, with the latest ratio of job vacancies to unemployment rising to 1.11 from 1.02, the labor force data are simply not making the case for a further pre-emptive cut in rates at this point. In addition, the initial claims data for the last week of June edged down for the third consecutive week.
Though the June employment report was somewhat mixed, it largely affirmed continued healthy labor market trends that have been in place for much of the past year. The headline nonfarm payroll gain of 147k was moderately above our 100k expectation, driven by an unusually large 64k increase in state and local education employment – likely a function of the seasonal factor. Private payrolls were up by a lesser 74k, slightly below our 100k forecast. At the sector level, health care / education services (+51k) and leisure / hospitality (+20k) continued to account for the majority of net private sector hiring. In other details of the establishment survey, hours worked (34.2hrs) and average hourly earnings (+0.2%) were a tenth each below our projections, which had the effective of lowering the year-over-year growth rate of our payroll proxy for compensation growth by 40bps to 4.5%.
That being said, the household survey was more positive as employment increased by 93k amidst a 222k decline in unemployment, thus lowering the U-3 unemployment rate by a tenth to 4.1% – the lowest level since February (4.1%). In addition, the U-6 rate also fell by a tenth to 7.7% – the lowest since January (7.5%). Though labor force participation (LFP) fell by a tenth, this was mostly concentrated in the 55yrs-plus age cohort, which has been trending down for some time. Prime-age LFP increased a tenth to 83.5% and remains above pre-Covid levels.
In short, the June employment report along with other recent labor market data points such as JOLTS and jobless claims continue to signal resiliency. While it is still a low hiring / low firing environment, there are no obvious signs pointing to this equilibrium collapsing. Indeed, as we outlined recently (see “US Economic Perspectives: Potential paths for breakeven employment “), we believe the breakeven rate of payroll gains (that is, the pace of job growth that would keep the unemployment rate steady) is something closer to 100k or less per month at present. The Trump administration’s immigration policies are likely to slow net immigration flows, and potentially could lead to an outright decrease in the foreign-born population. Correspondingly, the breakeven rate of payroll gains could be even lower, closer to 50k per month. As such, even modest payroll gains – like what we saw in June – could have the effect of tightening the labor market.
June headline payrolls (147k) above the 6-month avg (130k) but boosted by 64k state and local education
July 3, 2025 First Trust: Nonfarm Payrolls Increased 147,000 in June
…Implications: No cheerleading today’s employment report. Yes, the headline looks good: nonfarm payrolls rose 147,000 in June, beating the consensus expected 106,000. Payrolls were also revised up 16,000 in prior months, bringing the net gain to a solid 163,000. Meanwhile, the unemployment rate ticked down to 4.1% in June. So why not celebrate? Because private payrolls were up only 74,000 in June and were revised down 16,000 for prior months, bringing the net gain to 58,000. In other words, the gain in June itself was roughly half due to government and all the upward revisions were due to the government, as well…On the inflation front, average hourly earnings rose a tepid 0.2% in June while up 3.7% versus a year ago. This is very close to the 3.5% gain we think the Federal Reserve would like to see and a sign that it has room for modest rate cuts in the months ahead. Although some may claim the increase in government payrolls shows the Trump Administration is failing to trim the federal government, that’s not what the data say. In the five months since January, federal payrolls (excluding the Post Office and Census-related jobs) are down 2.4%, the steepest drop for any 5-month period since the 1990s. Instead, it’s been hiring by state and local governments, particularly for education jobs, that’s kept total government growing…
3 July 2025 ING: Firmer US jobs data suggests no Fed rate cut before September
A stronger-than-expected June jobs report indicates no Federal Reserve rate cut before September despite the President’s demands. Nonetheless, households are becoming more pessimistic on employment prospects with the risk of layoffs rising in the second half of the year
July 3, 2025 MS: U.S. Economics: Slower private payrolls but a tighter labor market
A slower trend in payrolls isn't creating more labor market slack. With the labor market still in balance and adjusting gradually to new policies, the FOMC is not forced into early cuts. We continue to see the Fed on hold, waiting for inflation and spending data to show tariff effects.
Key takeaways
Slower payrolls, a 147k rise boosted by government. But private payrolls, 74k, slowed from a 128k 3-month average. (Revisions were negiligible.)
But no greater slack. Unemployment rate fell from 4.24% to 4.12%, because of lower labor force participation.
Slowing growth in hours worked. Payroll incomes rose solidly but are about to be eroded by a tariff-related pickup in inflation.
Tighter labor supply amid immigration restrictions showed in low unemployment and reduced participation despite the slowdown in payrolls.
• June fireworks: Nonfarm payrolls rose by 147,000, more than expected.
• Government jobs added 73,000 jobs, led by state (40,000) and local (23,000) education jobs. Federal jobs fell 7,000.
• Private payrolls slowed to 74,000, with cooling vs recent trends (notably healthcare).
• Unemployment fell 0.127 pts to 4.1% (4.117% vs. 4.244% unrounded)
• The latest jobs report should not alter the near-term policy outlook
July 3, 2025 Wells Fargo: June Employment: Live to Fight Another Day
Summary The headline employment data for June generally were encouraging. Nonfarm payrolls increased by 147K last month, clearing a relatively low consensus forecast of 106K. Revisions to job growth in May and April were modestly positive. The unemployment rate fell by one tenth to 4.1%, and in a separately released report, initial and continuing jobless claims were roughly unchanged in the most recent week for which we have data.
But, underneath the surface, the details were less encouraging and generally were consistent with a cooling labor market. The breadth of hiring was once again quite narrow. An unusually large jump in state and local government education employment (+64K) may be a seasonal quirk related to the end of the school year in June. Health care & social assistance and leisure & hospitality once again posted solid gains, but outside these sectors hiring in the rest of the economy was relatively flat. Furthermore, the decline in the unemployment rate was partially driven by workers leaving the labor force. The labor force participation rate fell to 62.3%, its lowest reading since December 2022.
Today's employment data make a rate cut at the July FOMC meeting quite unlikely, in our view. But, we think the ongoing cooling in the labor market should keep the Fed on track to start cutting rates at its September meeting. The rate path will be highly dependent on the path of inflation over the summer months as the FOMC attempts to discern the impact that tariffs are having on price growth. The June CPI report to be released on July 15 will be a critical piece of data on this front.
The OBBB's early passage brings more clarity about US fiscal policy, and next week's end to the 90-day tariff pause could clarify US tariff policy. Their consequences, however, remain less clear. The UK's fiscal struggles continue, while a robust US jobs report made a July Fed cut very unlikely…
…US Outlook Payrolls likely to keep Fed on sidelines June employment data threw cold water on market speculation that labor market deterioration might be grounds for an earlier Fed cut, redirecting the focus on upcoming June inflation prints. Meanwhile, the president's budget bill is likely to provide only a modest tailwind for aggregate demand.
June employment data downplayed concerns about labor market deterioration, with the headline job count moving up 147k and the unemployment rate edging down 0.1pp to 4.1%. Although the headlines overstate underlying strength, in our view, we saw little in the report that would hasten rate cuts by the FOMC. Eyes are now shifting to the June inflation estimates.
Congress passed the president's budget, the One Big Beautiful Bill Act. Senate revisions increased the sticker cost of the bill, which is now $3.4trn from FY25-FY34, about $1.0trn more than the earlier House bill. That cost would balloon to $5.5trn after factoring in interest costs and the likely extension of expiring tax provisions.
The 90-day pause of country-specific reciprocal tariffs expires on July 9. Our view is that the current 10% universal tariff will be the floor, and that this will be extended for 18 "priority" countries, including the EU, Japan, India, and South Korea. Others will likely receive letters specifying the new tariff rate, which will exceed 10% if they have a trade surplus with the US…
Same shop with an INCREASED target price for ‘Earl …
Oil prices have been gradually climbing the wall of worry on continued resilience in fundamentals. We turn constructive relative to the curve and consensus and lift our 2025 and 2026 Brent outlook by $6/b and $10/b, respectively.
In the week ahead, investors will continue to digest the BLS employment data and ponder the implications for the forward path of policy rates. The week offers very little in terms of new fundamental information and the policy highlight comes in the form of the FOMC Minutes. We struggle to envision the Fed offering anything off-message in light of the ongoing uncertainties associated with the trade war and potential reflationary implications. Wait-and-see will be the message even as the market appears poised to push back on the notion that policy rates can remain at current levels for an indefinite period of time. Of course, the Minutes are dated and the information that was in hand in mid-June was already reflected in the updated SEP. Recall that the Fed’s updated forecast not only retained the 50 bp of cuts in 2025, but also showed a relatively benign core-PCE forecast for the year at +3.1%. Embedded within the Fed’s inflation outlook is a return to the transitory framing of trade-war-related inflation as well as a lack of pass-through to the core-services ex-OER/Rent component.
Alas, the inflation profile won’t be updated until July 15, leaving the macro landscape to drift in the wake of the payrolls print. The obvious wildcard is the July 9 expiration of Trump’s delay of reciprocal tariffs. The messaging from the President thus far is that he isn’t considering an extension of the pause and, instead, will be sending letters to US trade partners outlining the new applicable tariff structure. We struggle to see that ending particularly well. That being said, the vast majority of goods trade is concentrated among a handful of trading partners – a few of which have bilateral trade deals that are already on different timelines. As a result, we’re less convinced that the inevitable headlines that offer updates on the trade war will carry the same weight as what was revealed on Liberation Day. This implies that the sustainability of any subsequent price action should also be viewed skeptically.
As attention shifts toward the inflation profile, a great deal of uncertainty remains for a number of reasons. First, the full schedule of tariffs has yet to be solidified. Trump’s approach to the trade war has created countless challenges in estimating the ultimate flow-through to end users. Second, as the rules keep changing, investment and consumption decisions have been delayed or scaled back – lack of clarity breeds indecision. Third, a key unknown remains how much of the higher levies will be passed along to the consumer and how much will be absorbed as a hit to profitability. As with many things in the real economy, the passage of time will ultimately be required to more accurately assess the true impact. This fact has created the most relevant divergence at the moment between the timelines of monetary policymakers and investors. The market is increasingly viewing the lack of a material upside surprise in realized inflation as indicative of what to expect going forward whereas the Fed is content to await more convincing evidence.
Investors are eager to move on from the reflationary fallout linked to the trade war, but the Fed maintains that it is still too soon. The FOMC Minutes will only serve to reinforces this divergence. This comes at a moment during which the Treasury market will once again face a gauntlet of supply in the form of 3s, 10s and 30s. For months, the auctions have been scrutinized for any indication of a buyers’ strike – particularly on the part of overseas accounts. We have yet to see anything within the auction results themselves that would indicate such a shift in buyer behavior and our expectations are for the upcoming series of supply events to be equally well received. All buyers, no strike.
France weighing in on the Fed AND our legislative progress …
03 JUL 2025 BNP US Fed: All this has happened before, and will happen again
KEY MESSAGES
President Donald Trump appears to be waging a targeted campaign to pressure Fed Chair Powell into cutting rates and thereby accommodating higher public debt and generating a lower fiscal interest cost.
Over the short run, and in the context of Trump’s comments, we see at least two dissents at any future meeting with policy on hold. We tend to think that the FOMC will stay the course on its policy hold for several more meetings despite these dissents.
Longer term, the Fed has maintained its independence through political criticism in the past and we expect it will continue to do so. That said, the criticism is yet another source of policy uncertainty going forward, one that creates nonlinear macroeconomic risks.
…Dimensioning dissents: In the 30 years since the FOMC began issuing post-meeting statements, at most three voters have dissented at once. We tend to think that the President’s comments, while making it likely that Bowman and Waller dissent, make it less likely that other members do, because this could be seen as signaling weakness or disunity in the policy disagreement between the President and the FOMC. Accordingly, we think that in July we will see only these two dissents. We are watching Chicago Fed President Austan Goolsbee’s comments closely as we believe he would also favor near-term rate cuts, although as a former Democratic political appointee our guess is that he would not dissent for that outcome in this environment.
Resilient payrolls and a lower unemployment rate leave us comfortable with our long-held call for the Fed to stay on hold in 2025.
Soft elements including a slowdown in private job gains and moderating wage growth do leave some space for an earlier rate cut if no signs emerge of tariffs boosting inflation this summer, although we see this as unlikely.
Passage of the One Big Beautiful Bill Act (OBBBA) does not reshape our expected trajectory for the US economy – still caught between the drag from tariffs and only a moderate new impulse from tax and spending changes. However, it adds to our confidence that the economy will avoid a recession.
…Downgrading Q2 GDP projection slightly: We update our US GDP growth projections below, with the main change being a downgrade to our Q2 tracking estimate, now 3.2% (annualized) versus 3.7% prior. We flagged downside risks to our estimate after downward revisions to consumer spending growth in the Q1 GDP data, which mechanically softened the trajectory into Q2. Much of that was due to services spending, with international travel and the leisure/hospitality sector taking a breather.
We now see consumer spending at 1.5% saar in Q1, down from 2.4% prior. Elsewhere, the broad contours are similar to what we were expecting before, with drag from inventories (reversing Q1’s surge) and a big positive contribution from net exports (reversing Q1’s drag) as imports normalized after tariff front-running in Q2.
Beneath the surface, we see final demand continuing to decelerate: 3% in Q4 2024, 1.5% in Q1 2025 and 0.9% in Q2, troughing at 0.8% in Q3. We envision a gradual pickup thereafter consistent with our prior base case outlook. We make slight upward adjustments to Q3 and Q4 due to mechanical effects related to inventories and trade, and full-year growth is still 1.7% y/y in 2025 compared to the prior year average, or 1.2% on a q4/q4 basis.
All opinions are created equally and some are more equal than others … it’s MY OPINION this isn’t one of ‘them’ as I’m leaning somewhat more bullishly (ie Lacy Hunt, DiMartino Booth) but …
4 July 2025 ING Rates Spark: Bearish environment for US Treasuries
The Big Beautiful Bill passed in US Congress, putting even more pressure on the fiscal outlook and thus longer-dated USTs. US payrolls came in better than expected, contributing to higher yields across the curve. The ECB minutes show more members are concerned about undershooting inflation, keeping the 1.75% market-implied landing zone firmly intact
Fiscal concerns and better-than-expected growth provide bearish UST environment The better-than-expected US jobs data jerked 10y yields some 9bp higher, and it put an end to any hopes that the Federal Reserve could cut rates in July. That probability was seen as high as 25%, but has now dropped significantly to near zero.
The One Big Beautiful Bill Act managed to pass through Congress and will now go to President Trump to sign. This bill includes a continuation of tax cuts that will further increase the already large fiscal deficits. The expected rise in issuance should put upward pressure on the curve from the back end and can further widen the spread between UST and the SOFR curves. Right now, the fiscal picture benefits from low unemployment and reasonable growth. But we think markets are at risk of being too complacent about the signing of this bill, since the fiscal trajectory remains worrying in any case.
DipOrTunities in the week ahead …
July 3, 2025 MS: An Opportunity To Buy The Supply and Add To Steepeners | US Rates Strategy
The nonfarm payroll report, carried by state and local government education-related jobs, and the low unemployment rate suggest a dynamic aligned with our economist's view for lower US potential growth and a lower equilibrium rate leading to more Fed cuts. Stay long and in curve steepeners.
Key takeaways
Slower private sector job growth and a lower unemployment rate hint at a tighter labor market, but lower potential growth and lower equilibrium rates.
As our economists have pointed out, when the Fed starts cutting rates, it will need to cut to a lower level than both the dot-plot and market prices reflect.
Lower market-implied trough rates should lower UST yields and help steepen the yield curve, so we stay long duration and in yield curve steepeners.
As investor attention turns to refunding, we see this as a catalyst aiding wider 10y UST SOFR swap spreads on lowered investor expectations for coupon supply.
With less data in the coming week, investors will focus on the June FOMC meeting minutes and the takedown at the 3y, 10y, and 30y Treasury auctions.
… Abstracting from the minutiae of the payroll report, the bigger picture seems clear: lower payroll growth, but a labor market that remains tight, signals lower potential growth. And our economists think lower potential growth weighs on the equilibrium interest rate in the economy.
That means, whenever the Fed starts cutting rates again, it will need to take them lower than previously thought. If the consensus on the Fed sees the equilibrium, longer-run target rate at 3.00%, it may need to lower that over time.
A lower longer-run dot - displayed in Exhibit 11 - means the Fed may need to cut more to reach a neutral policy setting. And, given market prices tend to overshoot - inject a risk premium - relative to expectations, we think market-implied trough policy rates have much further to fall.
As market-implied trough policy rates fall, so too should US Treasury yields - keeping us bullish on US Treasury duration medium term. Exhibit 12 shows the relationship between the two over the past year. The noticeable divergence between the two occurred after the April 2 "Liberation Day".
… Moving along TO a few other curated links from the intertubes, which I HOPE you’ll find useful …
First up from The Terminal, a note which I’ve not yet stumbled across and so …
July 4, 2025 at 2:00 AM UTC Bloomberg: Goldman Lowers Treasury Yield Forecasts on Rising Fed Cut Bet
Goldman Sachs Group Inc. has lowered its forecasts for US Treasury yields, pointing to the increased likelihood that the Federal Reserve will cut interest rates sooner than previously expected.
Strategists including George Cole wrote in a July 3 report that they expect two- and 10-year yields to end the year at 3.45% and 4.20%, respectively, part of a lowering of yield forecasts at every major maturity. They had previously expected those benchmark yields to finish the year at 3.85% and 4.50%.
The move came after Goldman’s economists this week revised their expectations for Fed rate cuts over the course of the year. The economists now think the central bank will cut rates in September, October and December, having previously expected just one cut at the end of the year.
The latest forecast by the Wall Street bank’s economics team came before strong headline jobs numbers on Thursday, which eased pressure on the Fed. But Goldman’s rates strategists were undeterred, pointing out that the strength of the data was undercut by the outsized contribution of government hiring and a small drop in the labor participation rate.
Predicting where Treasury yields are going has become an increasingly complicated task for Wall Street analysts, who are being forced to juggle the likely inflationary hit from tariffs with expectations that the dent to real income could ultimately hit spending and economic growth. President Donald Trump is set to sign a $3.4 trillion fiscal package later Friday, which includes tax cuts, adding to concerns over increased government borrowing to offset a decrease in revenue.
Goldman’s revised forecast is slightly more dovish than the wider market. The average strategist forecast compiled by Bloomberg is for 10-year yields to hit 4.29% in the fourth quarter. The yield was 4.35% on Thursday, before closing for a public holiday.
Overnight-indexed swaps signal a more than 70% chance of the central bank cutting the policy rate by September, followed by another reduction before the year-end. Bloomberg’s economist survey projects subdued US growth in the coming quarters, as higher tariffs threaten to weigh on consumer spending.
“A benign path to lower short-term rates can dilute a potential source of additional fiscal risk premia and improve the economic appeal” of owning Treasuries, the Goldman strategists said. “We see scope for deeper cuts to support lower yields than previously envisioned.”
Former BAML economist now relegated to LinkedIN for whatever reason (I suppose similar reason but with more impact, as me here…)
July 3, 2025 Ethan Harris: More jobs, fewer workers
Like many economists, I was pleasantly surprised by today’s jobs report. In June payrolls rose 147k. That is above the 115k consensus and just below the 10-year average of 150k. So far this year payroll growth has been bouncing around in a healthy 100 to 160k range. The unemployment rate dropped from 4.2% to 4.1%, again defying consensus expectations of an increase to 4.3%. However, the report did show a drop in the labor force, a 0.1% dip in the work week and a soft increase in average hourly earnings.
While the overall data looks find, there are some signs that Administration policy is having an impact. Manufacturing jobs fell 7k in each of the last two months and that could reflect tariff uncertainty. Ironically, the trade war could hurt manufacturing more than it helps. Federal government employment fell 7k in June and is down 66k year-to-date. State and Local governments are making up the difference, adding 47k jobs in June and 68k year-to-date.
Perhaps the most interesting thing in the report, however, is preliminary evidence that “immigrant reduction” polices are impacting the labor force (Chart). Labor force data are very volatile so only very big moves are “statistically significant. However, the drop in the last two months is statistically significant. The labor force fell 755k in May and June. That compares to an average two-month gain of 295k in the last four years and a standard deviation of 392k. Hence the drop is well below the 95% confidence interval.
Source: BLS
Digging deeper, the drop in the labor force is coming from foreign born workers and hispanics. Of course these data are also quite volatile.
Only the beginning
I don’t think the labor force is collapsing, but I do think labor force growth will grind to a halt over the course of the year. US immigration policy has done a 180 degree turn from “open borders” to active attempts to reduce the immigrant population. Keep in mind that “mass deportations”—rounding people up and putting them on planes— is just a part of six polices that tend to reduce the immigrant population:
1. Imposing much stronger border enforcement.
2. Raiding workplaces and day labor gathering sites.
3. Rounding up suspected criminals and deporting without a hearing.
4. Encouraging “self-deportation,” including convincing people to either leave the country or avoid their workplace.
5. Ending temporary humanitarian visas.
6. Discouraging foreign students and researchers from coming too or staying in the US.
Two other policies could be added to this list over time. First, the Supreme Court could (somehow) decide to end birthright citizenship. Second, people could be denationalized (such as Musk and Mamdani) on the grounds that they lied during the naturalization process.
My next post will have a lot more to say about “immigrate reduction” policies and their implications for the labor market.
Technical note:
For my labor force calculations, I’ve used data from the BLS that are smoothed to take into account annual changes in population estimates. Otherwise there is an anomalous jump in the data at the start of each year. If you are suffering from insomnia, this link explains why the data needs to be smoothed.
… from the beach …
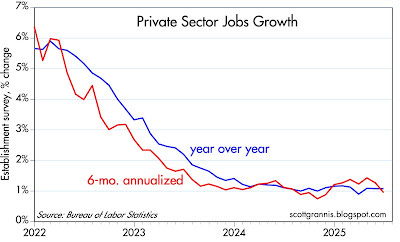
Thursday, July 3, 2025 Calafia Beach Pundit: The June jobs report was not strong
Today's June jobs report is being touted as strong enough to put any chance of a Fed ease on hold. That's silly, in my view. Putting things in the proper perspective, today's job report was one more in a year's worth of mediocre numbers. Private sector jobs (the ones that really count) have been growing at a 1% rate for over a year, which is consistent with real GDP growth of about 2%, a bit less than we've seen since 2010. Nothing in this report should give the Fed a reason to keep monetary policy tight.
Jimmy P remains BULLISH stonks … he looks at cash vs confidence in similar fashion to debt/equity ratio … worth a read and our collective consideration (and consequently, would seem then to argue against need for imminent rate cuts) …
Jul 03, 2025 Paulsen Perspectives: Scared & Loaded I continue listening and considering all bearish arguments for stocks, but for now, I can’t ignore the Big Beautiful Elephant in the room!
Appropriately, investors are generally immersed in the daily minutia surrounding the financial markets. How are valuations looking? Are earnings estimates rising or falling? Is inflation or a recession a threat? What will the Federal Reserve do with interest rates? The money supply? Will bond yields behave? Any external challenges to monitor – political riffs, global tensions, regulatory changes, bankruptcies … ? What is currently hot or not? Any good momentum plays or contrarian ideas to consider? Domestic, international, technology, financials or health care? What about market technicals? Is the S&P still trending above its 200-day moving average? Is that a rounded top, a double bottom, or a major reversal? “Lions and Tigers and Bears, Oh My!”
Nothing wrong with investors doing their homework. But sometimes when diligently juggling all the important facets to consider, investors can develop a tunnel vision and simply miss the elephant in the room. I think there are numerous factors investors need to be assessing today and several of the issues mentioned above are on that list. Nonetheless, I spot an elephant in the room and it probably “Trumps” (pun intended) everything else!
Investors are Scared & Loaded
Currently, investors are scared & loaded – a character generally only evident at major stock market bottoms.
Chart 1 shows the U.S. consumer confidence index since 1952. Confidence currently is near one of its lowest levels in post-war history suggesting pessimism and fear of the future is more pronounced today than at almost any other time during the last 75 years! Despite not having an official recession since March 2020 and only one other recession since 2009-10, and despite being in a bull market now for nearly four years, pessimism among potential investors – main street consumers – is remarkably pronounced.
Chart 2 demonstrates that in addition to households being pessimistic and fearful, they are also “loaded” with dry powder or rainy-day funds! Since 1950, U.S. household liquid assets as a percent of disposable personal income has ranged between 45% to 85% and is currently near 70%. Dry powder sitting on the sidelines is immense at $15.44 trillion – near a post-war high – and is more than double what it was at the bottom of the 2008-09 bear market and above where it was at the worst of the 2020 pandemic.
Many frequently compare the contemporary bull market to the dotcom boom during the 1990s. Similarly, the current bull has been highly concentrated among tech darlings, and it has lifted tech valuations and the overall S&P 500 valuation to very high levels. However, charts 1 and 2 show that the current bull market appears much less vulnerable to a collapse today compared to the dotcom top in 2000. In 2000, confidence on main street was at a post-war record high near 115. Today, the main street confidence index at about 60 is near a post-war low. Moreover, at the top of the dotcom mania, household dry power as a percent of disposable personal income was at a post-war low of only about 45% whereas today it is near 70%. Even though the contemporary bull has been tech driven and highly concentrated, its current position is nearly the contra opposite of the top of the dotcom market. In 2000, households and investors were fully invested with cultural emotions verging on irrational exuberance. Today, households are sitting on considerable potential buying power and arguably are irrationally pessimistic.
Introducing the Cash/Confidence Ratio
Chart 3 illustrates the cash/confidence ratio which is essentially chart 2 (cash holdings) divided by chart 1 (confidence). Currently, this ratio at 0.0113 is at the fourth highest peak level and is higher than 97.2% of the time since 1952. Investors are scared and loaded, and this should be very encouraging for stock investors!
Many currently suggest stock investors should be cautious. Valuation is high, aggregate investment exposure is pronounced, there are concerns about pending inflation due to tariffs, the Federal Reserve suggests it can be patient in holding interest rates and yields at relatively high levels, economic growth has slowed and may slow even further, and a recession and an earnings collapse are still possible. Moreover, the S&P 500 has already risen by almost 75% during this bull market and has surged by almost 25% just since April 8th. Several analysts and strategists make a compelling case that stock investors should proceed with caution.
However, there is an elephant in the room and it’s a big one! Chart 3 demonstrates that investors can currently buy the U.S. stock market with a backdrop or character which is very similar to what existed at the bear market lows of 1974, 1980, 1982, 1991, 2009, 2020 and 2022. Certainly not all characteristics today are consistent with past bear market lows, but two important criterion which drive the initial stages of most bull markets – pessimism and excessive dry buying powder – are evident.
Although I worry about many of the same issues bearish strategists highlight today, my guess is the big elephant in the room – the ability to buy stocks when attitudes are extremely pessimistic and when substantial idle buying power is sitting on the sidelines – is too compelling to ignore. Current risks associated with valuation, inflation, recession, Fed tightening, Trump tariffs, and geo-political conflicts notwithstanding, as chart 3 demonstrates, the opportunity to buy stocks when everyone is scared about the future and have stockpiled cash cannot be ignored.
The Performance Power of the Cash/Confidence Ratio
Chart 4 illustrates how historically powerful a high cash/confidence ratio has been since 1952. It records the average annualized quarterly S&P 500 total return performance since 1952 for all quarters when the cash/confidence ratio declined compared to how the S&P 500 performed when this ratio rose. For all quarters since 1952 when the cash/confidence ratio declined the S&P 500 average annualized total return was a stunning 26.4% compared to an average annualized S&P 500 total return of -0.31% for all quarters when the cash/confidence ratio rose.
Moreover, during quarters when the ratio declined, the annualized standard deviation of S&P 500 quarterly total returns was only 12.6% compared to 16.9% when the ratio rose. Perhaps most astounding, for all quarters since 1952 when the cash/confidence ratio declined, the S&P 500 suffered negative quarterly total returns only 13.7% of the time, whereas for all quarters when this ratio rose, the S&P 500 suffered a negative quarterly total return 45.9% of the time.
The cash/confidence ratio is currently higher than 97.2% of the time since 1952. Isn’t the cash/confidence ratio much more likely to fall rather than ruse in the coming year?
Final Comments
The contemporary U.S. bull market did not just begin; it’s nearing the end of its 3d year. Nonetheless, the current bull exhibits two strong characteristics which perhaps effectively makes it much younger than its calendar age. Throughout the current bull market, pessimism has been chronically elevated and idled buying power has remained abnormally large.
Since the contemporary bull will soon enter its fourth year and has already risen significantly since October 2022, maybe today’s very high cash/confidence ratio will not prove as dramatically positive for total returns as it has in the past. However, having a contemporary cash/confidence ratio which is among the 97% highest since 1952 should not only improve the likelihood of better-than-expected returns but also probably limits downside stock market risk. A high cash/confidence ratio in the stock market is similar to a low debt/equity ratio in the economy. The former enhances potential upside while limiting stock market selloffs and the latter promotes ongoing economic growth with lower recession risk.
I continue listening and considering all bearish arguments for stocks, but for now, I can’t ignore the Big Beautiful Elephant in the room!
Beneath the surface of the NFP report …
Jul 3, 2025 WolfST: Beneath the Surface of the Employment Report: How Jobs Evolved by Industry over Time, Winners & Losers
The job creation machine is running at a decent pace, unemployment is historically low, but it's not evenly spread across all industries.
…The increases of 147,000 new jobs in June and of 150,000 in the three-month average are near the 12-month average increase of 151,000 and are fine. The job creation machine is running at a decent pace. In a moment, we’ll look at jobs by major industry with charts to see how employment evolved over time; there are winners and losers, for sure.
… AND for any / all (still)interested in trying to plan your trades and trade your plans in / around FUNduhMENTALs, here are a couple economic calendars and LINKS I used when I was closer to and IN ‘the game’.
First, this from the best in the strategy biz is a LINKthru TO this calendar,
Somewhat more on ad hoc basis and considering being outta pocket MONDAY (HS football getting into gear and there’s a 7 on 7 to attend) but will likely be paying attention TO the inbox and if / when other research hits or is stumbled upon, will be in touch BUT …
THAT is all for now. Enjoy whatever is left of YOUR weekend …