weekly observations (06.24.24): Buyers on DIPS, staying SHORT and/or NEUTRAL … a range of RATES views and increasing S&P f’cast; who buys USTs in QT (hint: NOT HFs)
Good morning / afternoon / evening - please choose whichever one which best describes when ever it may be that YOU are stumbling across this weekends observations …
First UP a couple / few things observed yesterday, helping create price action and form narratives …
ZH: US PMIs Surprisingly Surge Despite Plummeting 'Hard Data', EU PMIs Slump
… THEN …
ZH: Existing Home Sales Tumble In May... As Prices Set New Record High
… seems to me a fitting end to an early on summer weAk. All told … an illiquid summer week just past and likely several more just ahead and so, with that in mind a couple visuals to contemplate ahead of liquidity events in week just ahead …
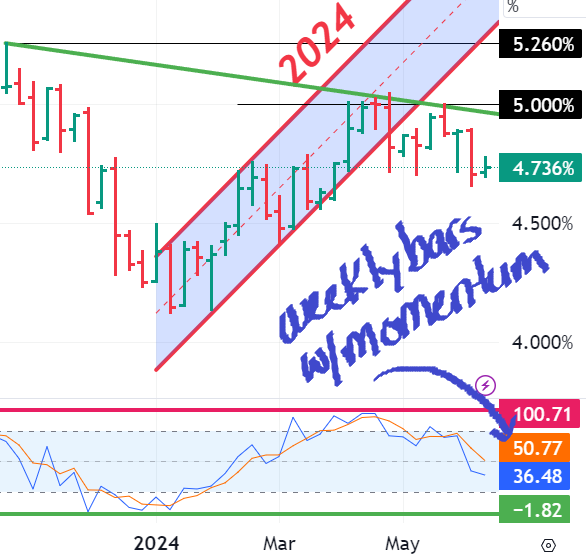
2yy WEEKLY: longer term range DEFINED and if you dig a touch deeper, the weekly momentum (stochastics) remains a bullish input …
… see whatever YOU want in this inkblot test and make as much / little of this as you wish. I’ll have some more granular chart reviews ahead of 2s, 5s and 7s.
I’m reminded that no matter WHAT charts say and I think, we’re supposed to, ‘never sell quiet markets’.
For somewhat more, see / refer to BMO just below with favorable seasonals mentioned in weekly AND of course, ZHs market wrap here for the old, ‘snap and crap’ (? not heard this one before !!) …
ZH: Crude Pops, Gold Drops, Crypto Flops As NVDA Suffers Worst Week In 2 Months
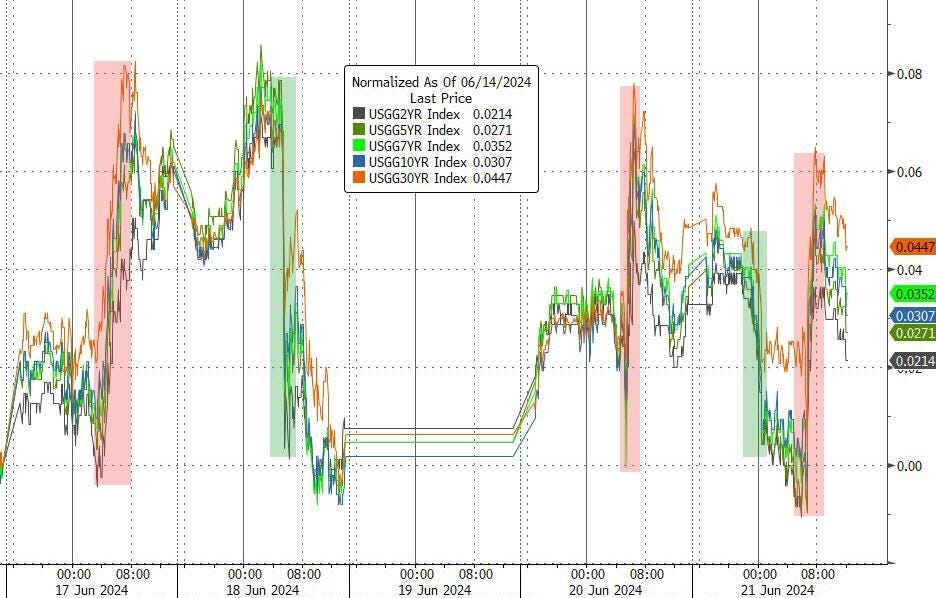
… Looking at US bond yields trade this week, it's clear we are entering the 'illiquid summer' season as yields snapped and crapped constantly to end the week marginally higher...
Ok I’ll move on AND offer some of Global Walls WEEKLY NARRATIVES … some of THE VIEWS you might be able to use … THIS WEEKEND, a few thing which stood out to ME …
… US: Softening US macro data reinforces our tactically long duration bias. CBO deficit revisions risk higher supply and cheaper USTs, especially at the long end.
… Bottom line: we hold core rates views and still recommend trading the rate range tactically from the long side, especially since macro data reinforces Fed cuts later this year. The UST supply outlook worsened with deficit revisions that boost the prospect for near-term bill supply & medium-term coupon supply. Higher UST supply will worsen the outlook for swap spreads; bank demand for cheap USTs vs IORB should limit extend of further 2Y cheapening but 30Y spreads should keep tightening.
… Technicals: US 10Y and Gilt yields heading lower in 2H24 Yields up in 1H24 was countertrend, leads to yields down in 2H24. US 10Y yield below 50wk SMA favors wave (C) down. Gilt yield forming head and shoulders top.
… US 10Y yield Base case remains: Yields up in 1H24, peak by US Memorial Day, buy dips as yields fall in H2
We prefer global equities to fixed income once more, given a backdrop of solid global growth and a gradual easing cycle. But investors should keep a wary eye on tail scenarios, especially in light of political risks…
…Macro Outlook: Enjoy the quiet (while it lasts) Our baseline is for steady global growth, uneven but continued progress on inflation, and a slow easing cycle, despite rising political risks. Disappointing China data should be offset by resilient growth in the US and India, as well as a cyclical pickup in Europe…
…Investment Outlook: Reluctant longs We are overweight global equities over fixed income for the third straight quarter. While still long risky assets, we are more cautious now, given elevated valuations and rising political and trade risks. Buying protection against many key tail risks is cheap; we outline a few key themes…
… US rates likely to bounce back from the low end of the range as election risks come to the forefront …
… Rising US rates could again pose downside to risk assets … The markets are not priced for a significantly positive correlation between bond prices and the S&P (or a negative correlation between rates and equities). While we are generally constructive on stocks, a digital put on the S&P to be down more than 5% by September in a scenario where 5y SOFR rates are higher than forwards offers a payoff of nearly 12:1, which is a cheap hedge for a potential repeat of last summer's market moves, in our view…
… Bonds Key Forecasts We expect Treasury yields to rise over the coming quarter as increasing real income growth and household net worth imply that the consensus is too negative on the economy. Markets have already priced in a material easing cycle, with the real rate expected to fall well below the estimated short-run real neutral rate, which is not justified by the inflation progress alone. The term premium has fallen to levels not justified by fundamentals, and forced unwinds of short-duration positions by leveraged investors have exacerbated the rally.
Outright euro yields have been trading with a bearish bias through most of H1, reflecting bearish spillovers from the US, upside growth surprises and sticky services inflation. Bunds have experienced a sharp flight-to-quality rally since French President Macron called for snap elections: further escalation of political worries could drive a fresh rally, whereas easing of these fears could drive a relief sell-off. In our baseline forecasts, we see 10y Bund yields at 2.45% in Q4 24 and 2.35% in Q2 25…
… We recommended shorting 10y US Treasuries to position for higher rates over the coming quarter …
BMO: Parsing Projections (summer seasonals and a quiet markets = X, solve for X)
In the week ahead, focus will be split between accommodating the incoming Treasury supply and pricing in a benign core-PCE print. The consensus forecast for May’s core-PCE move is a +0.1% monthly gain which would bring the yearly pace down to 2.6% – a notable deceleration from the prior read of 2.8%, and the lowest since March 2021. While the Fed’s preferred core inflation measure has yet to return to the pre-pandemic range, the downward progress has resumed following the Q1 respite. Investors have the combination of CPI and PPI in hand, which affords the market a good sense of May’s inflation profile even in the event the PCE figure differs from the forecast. Said differently, the update will more likely serve to reinforce the market’s understanding of the state of the US economy at the moment, as opposed to materially shifting the outlook. One wildcard on the horizon comes in the form of the personal spending data – both in nominal and real terms…
… We’re also reminded of the folly of shorting a quiet market, especially during a period that has historically seen downward pressure on yields during the summer months.
We still believe gradual disinflation and a deceleration in the economy will push the Fed’s first rate cut to December, leading to continued range-bound trading outright and on the curve.
Over the past 12 months, 2s10s swaps have underperformed the steepening implied by the forward curve unless the curve was 10-15bp more inverted than current levels.
For these reasons, we still favor trades that carry positively and enter a 3m forward 2s10s A/A-17/A-34 CMS floor butterfly and continue to believe that steepeners should be employed tactically with range trading in mind.
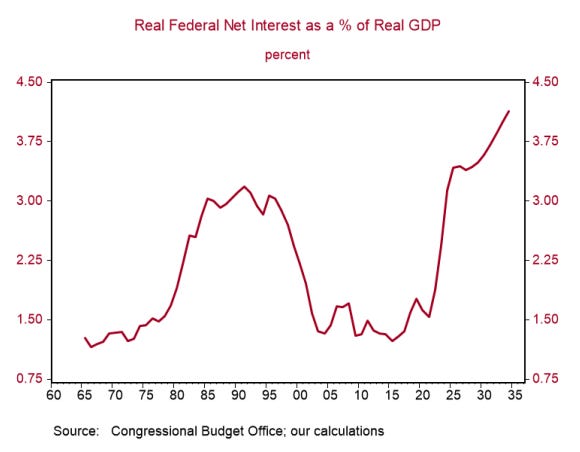
In the attached Weekly we discuss the CBO’s updated budget projections, which highlight a continued worsening in the fiscal outlook. We also provide some thoughts on business animal spirits given the latest CFO Survey.
… However, even if one agrees that real interest cost as a share of GDP is a more useful yardstick than debt-to-GDP, the CBO’s projections paint an ugly picture. In the chart below, we deflate the CBO’s estimate of net federal interest outlays by their projection of GDP prices (and calculate this as a percentage of real GDP)…
Net call volume in MCG & Tech surged to a record, disconnecting from the rest of the S&P 500
Goldilocks: Forecast Change: The S&P 500 will rise higher than previously expected
… Goldman Sachs Research has raised its year-end target for the S&P 500 from 5200 to 5600, driven by milder-than-average negative earnings revisions and a higher valuation multiple. The S&P 500 index has returned about 15% since the start of the year, and earnings and valuation have contributed equally to that return…
To ease, or not to ease, that is the question. While several central banks have answered the question already, even those that have answered "yes" struggle to answer the follow ups: how much to ease and how quickly? The debates will not conclude next week, but the first US presidential debate will.
… Interest Rate Strategy In the US, we stay neutral on duration, and maintain receive July FOMC OIS swap…
…United States Another reason to stay neutral duration: Treasury yields moved in a narrow range, with 10y yields down slightly since last week. On net, yields have reacted meaningfully to the stream of overall negative data since early May (when we had suggested turning long). Currently, economicsurprise indexes have reached very low levels vs. history, leaving it ripe for their typical mean reversion – the fifth reason to stay neutral on duration.
… On net, yields have reacted meaningfully to the stream of overall negative data since early May (when we had suggested turning long). While data surprised to the downside last week too, economic surprise indexes have reached very low levels vs. history, leaving them ripe for their typical mean reversion (see Exhibit 23). This is especially true for hard data like retail sales and inflation data – and adds to the four reasons we suggested for staying neutral last week…
The problem with steepeners persists: The 2s10s curve has bull flattened as yields have fallen in recent weeks. We highlighted the under-appreciated risk of bull flattening in our note, The Problem with Steepeners. As we expected, the significant bear steepening in the curve in the last year was susceptible to mean reversion via bull flattening. This keeps steepeners unattractive for now. We think duration trades will be more attractive than steepeners (we are neutral duration).
…Curve steepeners continue to disappoint: A notable thing amid recent market moves – even with weak data – has been the lack of curve steepening. Notably, the 2s10s (and 2s30s) curve has flattened as yields have fallen in recent weeks (see Exhibit 24). In other words, the curve has overall bull flattened. While this reaction in the curve may look strange, it is in line with the risk of bull flattening we discussed in our note, The Problem with Steepeners, two months ago.
Neutral duration; receive July FOMC OIS and add long 2y breakevens: We stay tactically neutral on duration – especially heading into the US presidential debate next week. We will re-assess whether to be long duration again after the debates, ahead of the next payroll and CPI data. For now, we continue to suggest attractive risk-reward trades like receiving July FOMC OIS, and we add long 2y breakevens…
Yardeni: DEEP DIVE: Winning Streaks Usually Don't Last Forever (great longer term chart of FF with crisis … and something I THOUGHT we were going to add to beginning of LAST year … SVB, etc…?)
… The hard landers correctly observed that previous Fed tightening cycles were followed by financial crises that turned into economy-wide credit crunches and recessions (Fig. 2 below). But the US and global economies are much different in the post-pandemic world than they were before, rendering many recession indicators with high success in the past, misleading now. Here’s how the TAMED approach to forecasting missed the mark:
Moving along and away FROM highly sought after and often paywalled and Global Wall Street narratives TO a few other things widely available and maybe as useful from the WWW
There is a major gap opening up between the mean and the median of long-term inflation expectations, which means that half of the population has long-term inflation expectations that are dramatically higher than the other half, see charts below and in this chart book. This is a very significant challenge for the Fed because it cannot cut interest rates when inflation expectations are out of control.
Apollo: Households More and More Bullish On the S&P 500
Since the Fed started talking about rate cuts, households have turned more and more positive on equities, see chart below.
Apollo: New White Paper -- 2024 Mid-Year Outlook: An Unstable Economic Equilibrium
While the Fed’s rate hikes have reined in growth, especially among over-levered consumers, corporates, and banks, the easing of financial conditions since the “Fed pivot” in December continues to offset the effect of higher rates. For the rest of 2024, we expect economic growth to be higher than consensus and inflation to stay above the Fed’s target. We see no Fed cuts in 2024.
EPB Research: Downshift In The Economic Narrative (Chart Of The Week)
… Rather than picking and choosing which indicators to follow, we aggregate all the major Business Cycle variables into a single composite indicator to track the ebbs and flows of aggregate economic activity with the highest level of consistency and accuracy.
The chart below shows this Aggregate Coincident Index, one of many composite indicators we use at EPB Research to track the sequence of the Business Cycle.
We can see a clear downshift in real growth to start 2024.
The May data was dragged down by household employment and real retail sales while it was boosted by industrial production and nonfarm establishment employment.
In any case, economic momentum has clearly slowed in the most consistent and objective basket of aggregate economic activity…
… Inverted logic Exhibit A in most forecasts of a recession is the inversion of the yield curve, but I would argue that the overall message from financial markets is highly ambiguous. The Fed has developed two kind of yield curve indicators, and both are flashing red. The 10yr-3mo treasury spread, popularized by the NY Fed, went negative in November 2022 and has stayed there ever since (Chart). As a result, their recession probability model has been signaling between a 44% and 72% chance of recession in the next twelve month. That prediction has been in place for 20 months. Currently it pegs a 56% probability.
Not to be outdone, Fed Board economists have developed a supposedly improved, measure-- the spread between the current 3 mo yield and the 3 mo yield 18 months forward. This spread also turned negative in November 2022 and it has been signaling an even higher probability of recession in 12 months. Indeed, in May 2023 this indicator signaled a 99.88% of a recession by this May. Currently it pegs the 12-month recession probability at 95%.
That is a remarkable forecast error. Yield curve fans will argue that if you allow enough time the yield curve will get it right. Be patient, there are long and variable lags. Yes, and if you give me enough mulligans, I’m a scratch golfer.
Why has the yield curve developed such a slice? My favorite explanation is that market participants are seriously underestimating the neutral Fed funds rate and hence expect the Fed to cut a lot even if there is no recession…
Fed in Print: Who Buys Treasuries When the Fed Reduces its Holdings
The Federal Reserve began to decrease the size of its balance sheet in June 2022, entering a phase of "balance sheet reduction" that continues today. In this note, we determine which sectors absorbed the resulting increased supply of Treasury coupon securities. We find that, during the first balance sheet reduction period between 2017 and 2019, dealers, households, and hedge funds bought significantly more Treasury coupons. However, during the post-pandemic balance sheet reduction period, it appears that dealers, private insurance, and the rest of the world purchased the Treasury coupon securities from the reduction in Federal Reserve purchases, not hedge funds.
Hedgopia: Equity Bulls Riding Tailwinds Of Margin Debt And Buybacks – For Now (miss being able to run MARGIN DEBT visuals on a Terminal)
FINRA margin debt, too, has risen nicely from last October’s bottom, but a genuine willingness to take on leverage remains a suspect.
Margin debt peaked at $935.9 billion in October 2021 and dropped all the way to $606.7 billion by December 2022. Last October, when equities bottomed, it stood at $635.3 billion. From that low through May, margin debt is up $174.2 billion to $809.4 billion. At the same time, leverage remains substantially below the October 2021 high, even as equity indices keep making new highs, which also suggests that once these tailwinds stop cooperating, the move lower can be as parabolic as the move higher.
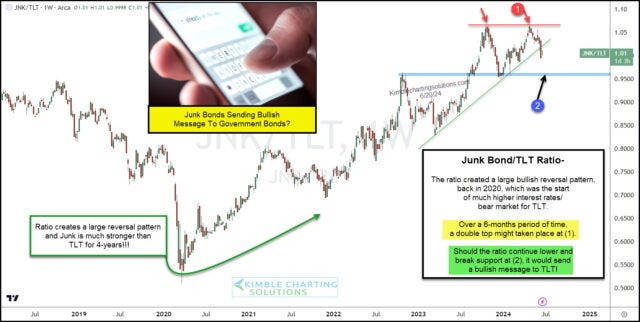
Kimble: Junk Bonds versus Government Bonds: Why It Matters
The stock market reflects a strong economy and the bond market reflects central banks cutting interest rates gradually. Inflation remains elevated and that will put upward pressure on interest rates and downward pressure on the economy.
… Inflation has surprised on the upside and remains elevated. The strong economic conditions have resulted in stronger-than-expected economic growth but also higher-than-expected consumer prices. Underlying inflation has clearly slowed from its highs around 5% but still remains elevated and clearly above central banks’ 2% inflation target. The latest CPI inflation report shows an encouraging moderation in comparison to the inflation trend earlier this year, but the significant change compared to the recent trend and the fact that it is only one data point indicate that it is dangerous to extrapolate that one data point into the future. Looking back at the latest three-, six- and twelve-month periods, core inflation remains above the Federal Reserve’s 2% inflation target. Every day that inflation remains elevated we are likely to remain in an environment where interest rates will increase and put downward pressure on the economy until it is clear that inflation will move sustainably toward 2%.
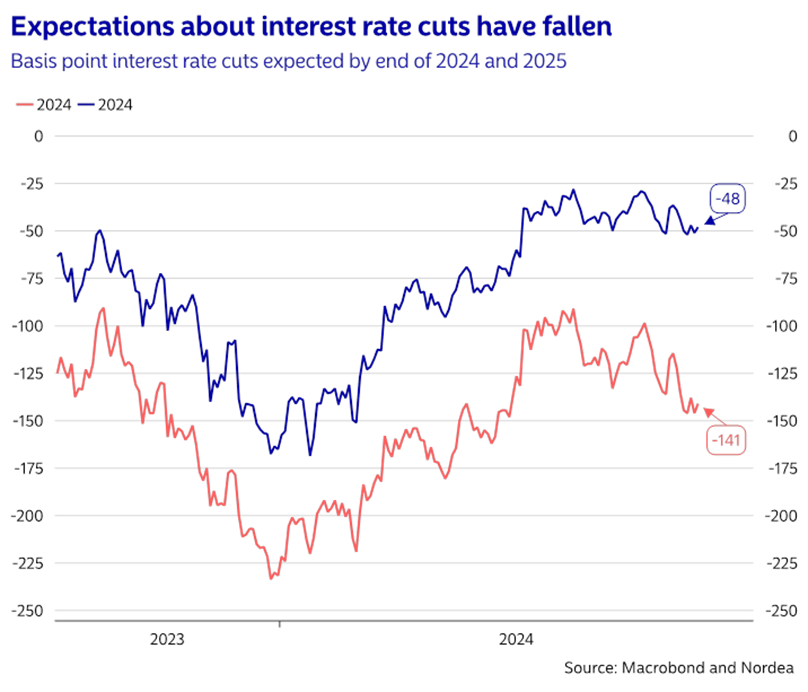
Central banks have reduced expectations about interest rate cuts. Strong economic growth and elevated inflation have forced central banks to keep interest rates at a high level. At the beginning of the year, the consensus expectation was that the Federal Reserve would cut its policy rate seven to eight times during this year. Today, it looks more likely that there will only be one or two interest rate cuts. Interest rates have increased this year, but remain well below the highest level last year even though the consensus expectation is that the economy is stronger today compared to back then. Every day the economy remains solid and inflation remains elevated, interest rates become more likely to increase and put downward pressure on the economy until it becomes clear that inflation will move sustainably toward 2%.
… AND for any / all (still)interested in trying to plan your trades and trade your plans in / around FUNduhMENTALs, here are a couple economic calendars and LINKS I used when I was closer to and IN ‘the game’.
First, this from the best in the strategy biz is a LINKthru TO this calendar,


Great newsletter....
Be interesting to see when the S&P 500 and Bond Yields begin regressing to the mean...or is the trend going to continue unabated ??