weekly observations (06.03.24): 'better late than never' (BAML), PCEs rounding exercise (everyone :)), equity positions rangezilla (DB); specs NET LONG BONDS!?!
Good morning / afternoon / evening - please choose whichever one which best describes when ever it may be that YOU are stumbling across this weekends note…
Before diving too deep into data and Global Wall Street recap and victory laps, I’d like to look first at PRICE ACTION because, well, lets face it … views and opinions are constantly marked to the MARKET and not the other way ‘round … and so …
2yy WEEKLY … rates are lower on the week and so … chalk this week up TO Team Rate CUT as 2yy down about 7bps on the week …
10yy DAILY ending the day and week with a BID, approaching 50dMA (4.48% and noting it as it remains UPWARD SLOPING and seems to be an inflection point others noting … with 200dMA — another level some of the popular kids are watching — is down nearer to 4.35% )
… Looking through some of the MONTHLY charts (more in the days just ahead), it appears that momentum (stochastics) is leaning more overSOLD (and so, rates are BUYABLE) than not but this lean and potential cross (buy signal) isn’t from particularly extreme levels …
Now with RATES setting the table for the week ahead completely void of Fedspeak givent he upcoming meeting ‘blackout’ period, we’re left to our own imagination. After what I would have thought to be quite a good week for Team Rate Cut (turns out not necessarily true throughout the curve but rather only locally for the 2yy and even then, only barely so), Team Rate CUT seems to continue to be on DEFENSE.
Evidence this weeks Barrons cover story:
… Time isn’t on the Fed’s side this year, however. Rate cuts at the Federal Open Market Committee’s June and July meetings are widely thought to be off the table, given the lack of progress on inflation so far in 2024. The September meeting will be “live,” meaning a decision could be made in the moment, but again, the data aren’t likely to cooperate, due to the economy’s enduring strength and technical factors.
Base effects are one example. The PCE price index rose by 0.1% in May 2023, 0.2% in June of last year, and 0.1% in July. If inflation increases at a faster pace during the same months this year, the inflation rate will rise year over year, making it difficult for Fed officials to gain the confidence they desire that inflation is cooling toward 2%. The PCI price index hasn’t risen by less than 0.3% a month so far in 2024…
… and on THAT note (of said ‘base effects’ — it’s math they tell me), I’d like to pause and highly recommend a podcast noted in comments by astute readers for which I’m grateful …
MacroVoices #430 Jim Bianco: Rate Hike On Deck
… he talks rate HIKES, base effects, Liz TRUSS moment (RTRS reminder HERE — this likely got much less attention than it deserved … at the time … at least by me) and more … HE — JB — is clearly NOT on Team Rate CUT but rather the other team, which seems much less organized and quite like the bad news bears … we KNOW how that movie ended, right?
AND with that great big 2nd place as if they won celebration in mind, a quick recap …
First UP, what did we learn from the official ‘rounding exercise’ as one astute reader commented …
ZH: Core PCE Grows At Slowest Pace In Three Years After Lowest Monthly Increase Of 2024, Spending Drops (again it looks to me as WIDELY expected and readily avail and open TO interpretation … clearly Team Rate CUT — and so, bond jockeys who are LONG, which may be … nobody — see below — will be celebrating alongside the #NeverTRUMP’ers this weekend …)
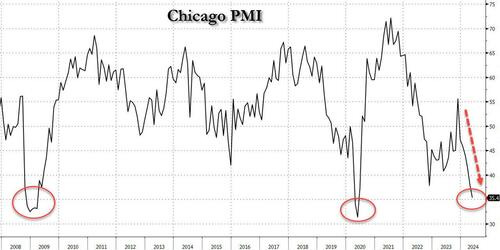
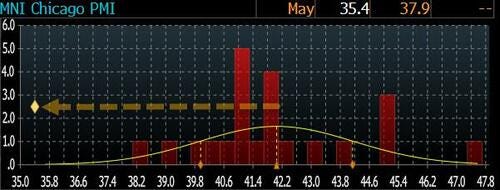
ZH: Chicago PMI Unexpectedly Craters To Depression Levels (another for Team Rate CUT!!)
… ... which seems to suggest that at least according to Chicago-based purchasing managers, the economy is in a depression.
This is how the final number looked relative to expectations.
… Ok I’ll move on AND right TO some WEEKLY NARRATIVES … some of THE VIEWS you might be able to use and as I’m still struggling with who I wanna be when I grow UP, I’ve been spending less time producing this note (but still read an awful lot of what Global Wall is sayin’ and sellin) and on THAT note, here are just a handful of the notes I’m reading before weekends UP and markets are back open for your dining and dancing pleasure.
THIS WEEKEND, a couple / few things which stood out to ME … a combination of views supporting both camps (Team Rate Cut and the other guys) … and lots of angles to consider ahead of / into next weeks ECB meeting and NFP …
BAML Rates Weekly: Better late than never (okie dokie … buyin’ dips despite / because of whatever it is you think you think … techAmentals or whatever)
… Rates: Demand air pocket, lean against the wind
US: Lean against non-fundamental rate moves, add duration w/ 5-10y >4.6 - 4.65%. UST supply / demand concern best traded via 30y B/E & tighter spreads, not bear steepening…… Bottom line: the recent bear steepening of the UST curve appears primarily driven by positioning / flows & soft auction dynamics vs fundamental factors. We recommend leaning against non-fundamental rate rises & going long when 5-10y rates are 4.6- 4.65%. For clients concerned about supply / demand dynamics, we recommend owning 30y B/E & longer-dated SOFR swap tighteners vs TP related bear steepeners.
… Technicals: A patient summer of buying dips
Short-term: Yields up in/into June. Medium-term: Yields near a 1H24 peak and should turn lower in 2H24. Post Memorial Day, we prefer dip buying.BARCAP: April core PCE rounds down to 0.2% m/m (it is a rounding exercise after all, isn’t it… )
Core PCE price inflation eased by 8bp, to 0.25% m/m (2.8% y/y) in April, rounding down to 0.2% m/m after firm prints in Q1. As expected, much of the easing came from core services prices, and the print supports our baseline call that the FOMC will deliver one rate cut this year, in September at the earliest.
BARCAP: April data exaggerate the slowing in PCE (um, wait, what? Team Rate Cut please weigh in … meanwhile, back at the ranch, JB and Barrons above BOTH continuing to look less and less like they are lunatic fringe )
Real PCE eased more than expected, declining 0.1% m/m, following strong increases in the prior two months. That said, we are not convinced that consumers are losing steam, given the still-low saving rate, strong household fundamentals, and income gains.
BMO Weekly: 4.50% 4-Now% (booked profits on some of 2s10s flattener and profitably — stopped out on rest; got LONG 10s; will reflex right back in to flattener IF steepening post NFP … for somewhat MORE and the audio / PODCASTED short version of this PDF, be sure to check out / add to your weekly LISTen … On Tee for N.F.P. - Macro Horizons )
… After a fleeting attempt at pressing 10-year yields above the 4.60% Bollinger band top, benchmark rates have retraced and once again given into the pull of 4.50%. The market’s affinity for round numbers is in play as investors focus on the 4.90% to 5.0% range in 2s versus the 4.50% anchor for 10s. While we certainly don’t expect 4.50% 10s to persist indefinitely, it appears to be the market’s equilibrium for the moment. It’s not difficult to envision a breakout in either direction as a function of NFP or the June 12th CPI release. Our bias is that lower yields will be easier to achieve in the current environment and as a result, we’re targeting the 200-day moving-average of 4.347% in 10s, which corresponds with two standard deviations below the 20-day moving-average of 4.47%.
The path toward lower yields isn’t a foregone conclusion, of course…
DB Monthly charts: Cuts aren't urgent so the Fed will hold 'em
This monthly chartbook highlights our top charts for understanding the current state of the US economy and the outlook for 2024-25. The document features several sections including discussions of: the near-term economic outlook; consumer fundamentals; a better balanced labor market; disinflation being delayed, not derailed; our baseline view for the Fed; the 2024 election; and longer-term issues related to growth, inflation and fiscal deficits and debt.
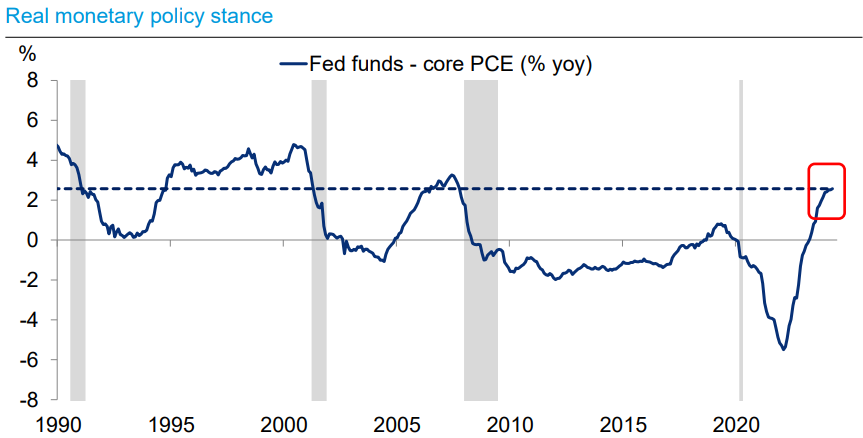
… Fed rate move frontiers: Conditions for cutting and hiking rates
Real monetary policy stance is reaching elevated levels from a historical perspective
DB: Investor Positioning and Flows - Still Stuck In The Range (so room to add IF / when Team Rate CUT is right AND Fed starts cutting, move should be to add risk LONGS — see / listen TO JB above…)
… Positioning remains stuck in the range it has been in since February
MS: Voting With Your Wallet | Global Macro Strategy Mid-Year Outlook
Investment strategy at mid-year must take into account the US election. Investors will need to decide how much risk to take into the election – a likely function of year-to-date performance and certainty about the outcome, both of which may lead to more risk-reducing than risk-seeking behavior.
… Interest Rate Strategy
United States
UST forecasts: In the base case,we expect Treasury yields to move lower over the forecast horizon, with 10-year Treasury yields trading around 4.10% by end-2024 and 3.75% by 1H25. Our economists expect Fed to cut rates from September 2024 and deliver seven 25bp cuts through 1H25. We see this set-up as conducive to driving both lower rate expectations and term premiums. In the bull case, we see a traditional bull steepening in Treasuries – with 2-year and 10-year yields at 4.05% and 3.90% by end-2024, and at 2.30% and 2.80% by 1H25, respectively. In the bear case, we see 2-year yields and 10-year yields ending 2024 at 6.00% and 5.30%, respectively, and at 5.85% and 5.20% by 1H25.The evolving reaction function in yields: Overall, Treasuries have been discounting growth numbers as they have learned about rising labor supply, while being hypersensitive to inflation readings (which in turn are biased by residual seasonality). This is in sharp contrast to 2H23, when markets were discounting inflation progress while being sensitive to rising growth and upside surprises in labor markets. We think this changing reaction function increasesthe downside risks to yields, as inflation broadly decelerates in the coming months, and the bar for growth and labor market goes up.
The problem with steepeners: Curve steepeners are popular among all investor types. Yet, the possibility of "insurance cuts", improving fiscal and historical trends, and consensus positioning means there is an under-appreciated path to bull flattening. We think duration longs offer better risk/reward than steepeners…
… FIVE ARGUMENTS FOR STEEPENERS, AND WHY THEY MAY NOT WORK …
Wells Fargo: Pressure Drop: Slight Cooling in Real Spending as Price Ascent Slows
Summary
Personal income and spending grew in April, but after adjusting for inflation, the income gain was muted and real spending fell 0.1%. Core inflation at 2.8% may not show meaningful progress on the fight against inflation, but it signals a cooling trend, a welcome reversal of Q1 price data.Wells Fargo: Weekly Economic & Financial Commentary (topic of the week caught my attention for a variety of reasons … for now, we’ll just stick to the markets based ones :) )
… Topic of the Week: “I Am Not Paying $20 for a Hamburger”
The latest Beige Book unveiled a growing sense of weariness. Comments in the report—which summarizes anecdotal information on economic conditions collected from business and not-for-profit contacts of the 12 regional Federal Reserve Banks—covered early April through mid-May. Over the month of April, national retail sales and industrial production were flat, nonfarm payrolls posted its smallest gain since October 2023, and expectations for fed funds rate easing this year pared back. Still-elevated borrowing costs combined with a modest pace of activity growth underpinned outlooks that grew “somewhat more pessimistic amid reports of rising uncertainty and greater downside risks.”Despite the pullback in sentiment, employment edged higher. Many contacts expressed that labor demand and supply are continuing to come back into better balance, but shortfalls remain. The New York Fed reported that labor shortages were “particularly acute in the service sector.” This was echoed by the Kansas City Fed, and it reported that “consumer-oriented businesses express[ed] greater wage pressures” relative to manufacturers in its region. While certain industries continue to see strong wage pressures, overall wage growth is normalizing to pre-pandemic averages amid a softer pace of hiring and lower employee churn. Indeed, the Boston Fed reported that “employers enjoyed increased bargaining power relative to a year ago.”
More moderate wage growth has translated to a subdued pace of income growth. As discussed in more detail in U.S. Review, we learned Friday that real disposable personal income was up 1% year-over-year in April, which is the smallest annual gain since December 2022. Fading income momentum has started to weigh on consumer spending. The Cleveland Fed commented that “multiple retailers indicated that customer foot traffic was lower,” while the Richmond Fed said that “low-to-moderate income consumers were reportedly pulling back on spending or trading down in the goods they purchased.” The Atlanta Fed summarized that “shoppers were price sensitive and continued to be cautious with discretionary spending.”
… In sum, the tune of May's Beige Book is one of modest growth. The words “moderate” and “modest” were used 163 times, while “strong” and “robust” were used only 48 times. Looking ahead, contacts expressed mounting pessimism about the path of economic activity this year and pointed to uncertain monetary policy and election outcomes as primary culprits. The St. Louis Fed concluded, “multiple contacts cited a worsening outlook due to some combination of higher interest rates, inflation, and political uncertainty.”
Yardeni DEEP DIVE: US Economy Is Less Interest Rate Sensitive
The resilience of the US economy has been impressive over the past two years in the face of the Fed’s dramatic tightening of monetary policy. Nevertheless, there are still a few hardcore hard-landers predicting that the economy either is already in a recession or soon will be. They’re convinced that there are long and variable lags between restrictive monetary policy and its depressing impact on the economy. Among them is one of our competitors who seems to give a lot of weight to the Senior Loan Officer Opinion Survey (SLOOS). SLOOS, she says, suggests that credit conditions remain tight.
Eric and I disagree with this assessment. Here is why:
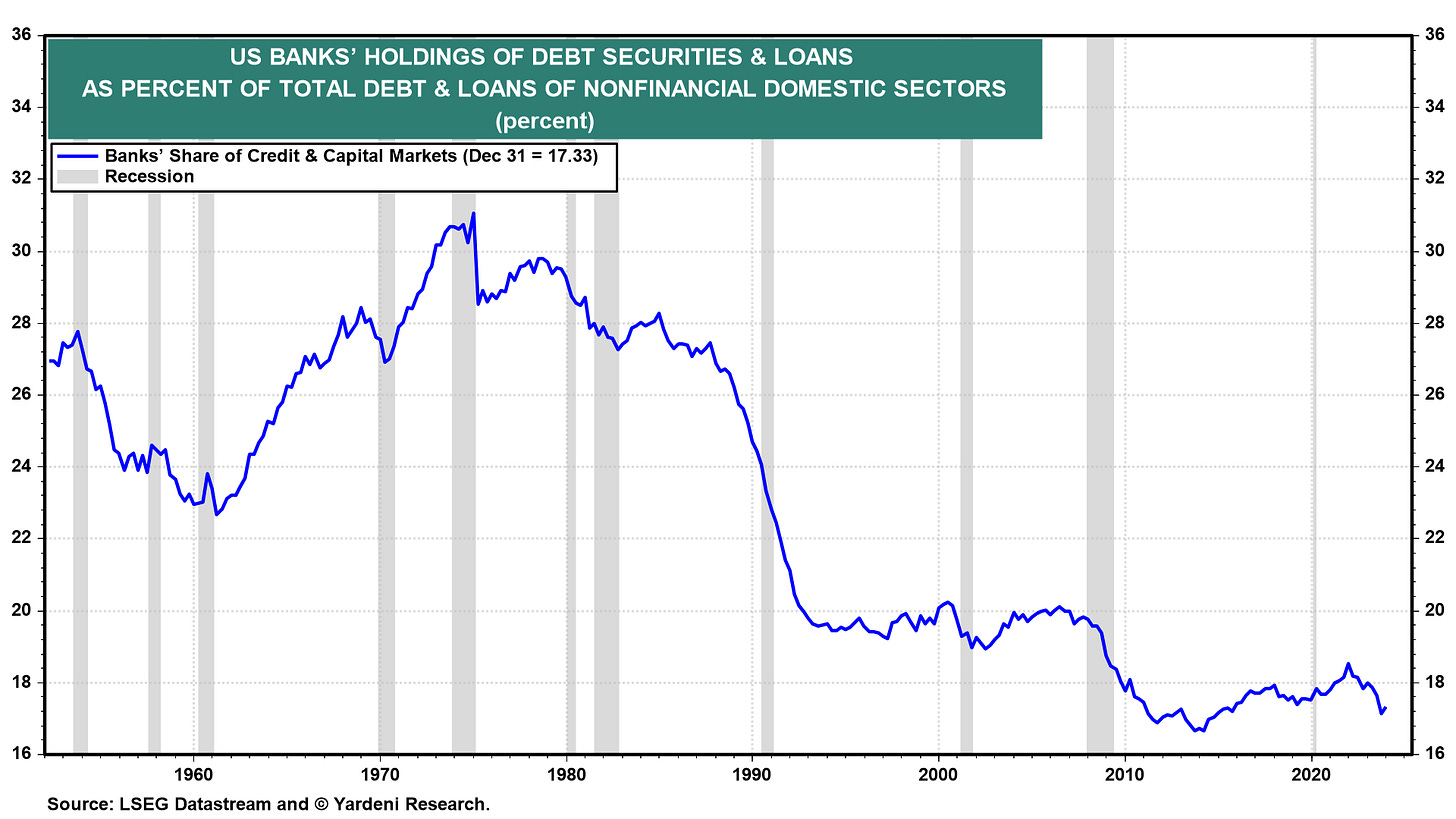
(1) We aren’t saying that SLOOS suggests credit is loose. We are saying that it has become a less important indicator of credit conditions in our economy than it used to be. That’s because banks have become less important agents of capital allocation in our economy as nonbanks have become more important sources of financing (Fig. 1 below). Private debt and private equity funds have been growing rapidly in recent years. So have distressed asset funds that have plenty of money available to restructure overleveraged assets, buying at significant discounts and then reselling at a premium.
… In any event, personal consumption expenditures of new autos as a share of nominal GDP has also been falling (Fig. 8 below). It is currently only 2.6%, which is the lowest since the previous cyclical lows prior to the GFC.
… AND moving along and away FROM highly sought after and often paywalled and Global Wall Street narratives TO a few other things widely available and maybe as useful from the WWW …
Apollo: Japanese Demand for US Treasuries When 10-Year JGBs Are Above 1%
Japan owns $1.2 trillion of US Treasuries, and with 10-year interest rates on JGBs rising above 1% for the first time in more than a decade, Japanese investors will begin to find their own yen-denominated bonds relatively more attractive compared with US rates.
Put differently, as Japanese yields move higher, the global savings glut will shrink, putting upward pressure on the US term premium, see also Bernanke’s speech from March 2013 discussing this dynamic.
Any decline in USDJPY driven by such Japanese repatriation could be magnified once the Fed begins to cut interest rates. Then USDJPY would move lower not only because of higher long rates in Japan but also because of lower short rates in the US.
The bottom line is that rising long-term interest rates in Japan put upward pressure on long-term US Treasury yields, steepen the US yield curve, and put downward pressure on USDJPY.
For more, see also our chart book looking at Japanese demand for US Treasuries available here…
Bloomberg: Market Goes Into PCE With Almost Everyone Neutral Bonds (written and sent - via ZH — 811a so before PCE dropped)
FRBNY Liberty Street Economics: Can Discount Window Stigma Be Cured?
The Federal Reserve has been operating as a lender of last resort through its “discount window” (DW) for more than a century. However, the DW has been plagued by stigma, based on concerns that it could be interpreted as a sign of financial weakness. The authors report on new research showing that once a DW facility is stigmatized, removing that stigma is difficult.
FRB Cleveland New Working Paper: A Unified Framework to Estimate Macroeconomic Stars
This paper develops a semi-structural model to jointly estimate “stars” — long-run levels of output (its growth rate), unemployment rate, real interest rate, productivity growth, price inflation, and wage inflation. It features links between survey expectations and stars, time-variation in macroeconomic relationships, and stochastic volatility. Survey data help discipline stars’ estimates and have been crucial in estimating a high-dimensional model since the pandemic. The model has desirable real-time properties, competitive forecasting performance, and superior fit to the data compared to variants without the empirical features mentioned above. The by-products are estimates of various objects of great interest to the broader profession.
Hedgopia CoT: Peek Into Future Through Futures, How Hedge Funds Are Positioned (large specs NET LONG BONDS … longest since March … of 2022)
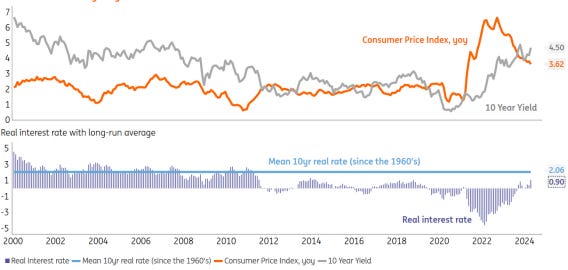
ING: Lets get real on US rates
The 10yr yield you see on your Bloomberg screen today at 4.5% feels high as its come from very low levels, and indeed is well above the 15yr average. But, forget the past decade-and-a-half for anchor points, as that was not normal. We show in fact that 4.5% is neutral. We can get down to 4% in a rate-cutting phase, but we rationalise why we'll in fact end back up at 5%
…The US 10yr real rate is still only 1%. The neutral level is 2%. Lower CPI does not necessarily mean lower yields...
LongView Economics: 5-Year US Government Bonds Selling Off For Most Of 2024
… From a positioning perspective, 5-year Treasuries are now heavily net SHORT (1.06mn contracts net SHORT), reflecting significant bearishness towards this part of the Treasury curve (as well as other parts - fig 1). An overbought/oversold model for 5 year Treasuries (i.e. an RSI, using both a 56 and 14 day timeframe) shows that the price is close to oversold at current levels (albeit there remains some modest potential for further price declines) - see fig 3. The key point here, though, is that a major rally in government bonds is likely brewing, given such one way positioning. As always, it will be crucial to closely monitor the evolution of the Fed’s commentary, as well as key inflation data points and the overall economic landscape for timing entry into that trade.
Fig 1: US 5-year bonds net speculative positions vs. US 5-year bonds futures
… Fig 3: Medium term RSI scoring system vs. US 5-year bonds futures
RBA: Something's gotta give
Financial cycles repeat and current speculation that “this time is different” is likely incorrect. The gap between perception and reality creates a significant investment opportunity.
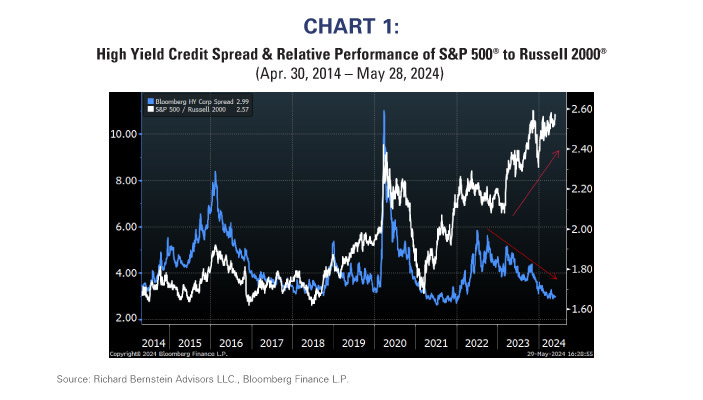
High yield bonds and small cap stocks typically move in line with each other, but the two have diverged since 2022.
We see three plausible explanations for this divergence, all of which imply a more favorable outlook for small cap stocks over high yield bonds and large cap stocks.
… Junk bonds and junk equity are telling different stories
Historically there has been a close relationship between the performances of high yield (junk) bonds and smaller capitalization (junk) equities. In fact, the performance of lower quality investments across asset classes tends to have high correlations because the risk of lower quality investments fluctuates in tandem as the economy and profits expand and contract.Junk bonds tend to outperform quality bonds when the economy expands because 1) their higher yields and lower durations protect against rising interest rates, and 2) credit quality improves when the nominal economy expands because corporate cash flows and balance sheets strengthen. Junk bonds underperform during economic slowdowns or recessions because the opposite occurs, i.e., longer duration assets outperform when interest rates fall, and credit quality deteriorates.
Junk equities similarly outperform during expansions because their operating and financial leverage cause their cash flows and balance sheets to significantly improve. The opposite occurs during economic downturns.
Chart 1 shows the relationship over the last 10 years between high yield corporate spreads and large versus small stock performance. Historically, large cap stocks (higher quality) tend to outperform smaller cap stocks (lower quality) when high yield credit spreads are widening (high quality bonds outperform low quality bonds).
… Explanation #1: Large Cap Bubble
… Explanation #2: The economy is heading for one heck of a credit event
… Explanation #3: Smaller capitalization stocks are now “defensive”… Something has to give
Individual investors are enthusiastic investors in the Magnificent 7 and in lower quality and private debt. This seems very inconsistent to us.The Magnificent 7’s outperformance seems to be forecasting a dire economic future with significant credit problems, whereas the flows into private debt are suggesting the Magnificent 7 is in the midst of a speculative period or even a bubble.
The divergence in the performance of large and small capitalization stocks and high and low quality bonds is highly unusual and extremely inconsistent. Something has to give.
We continue to believe that economic precedent will hold. Profits are accelerating and credit conditions remain healthy. The broadening of fundamentals suggests it is the Magnificent 7 that will be the assets to “give” and substantially underperform.
WolfST: Fed’s Wait-and-See on Rate Cuts Supported by Worst 6-Month “Core” & “Core Services” PCE Inflation since mid-2023
Not just housing, but also other core services. However, durable goods inflation is back to normal.
… AND for any / all (still)interested in trying to plan your trades and trade your plans in / around FUNduhMENTALs, here are a couple economic calendars and LINKS I used when I was closer to and IN ‘the game’.
First, this from the best in the strategy biz is a LINK thru TO this calendar,
Wells FARGOs version, if you prefer … (note NEXT Friday’s funTERtainment … an uptick in jobs comin’?)
… and lets NOT forget EconOday links (among the best available and most useful IMO), GLOBALLY HERE and as far as US domestically (only) HERE …
Finally,
…. confirmed … true story … feelin’ that FATigue … THAT is all for now. Enjoy whatever is left of YOUR weekend …


