weekly observations (05.18.26): #Got2s? 'family fight'; demand destruction; some see bonds > 5% as bullish as others remain SHORT duration;
May 16, 2026
Good morning / afternoon / evening - please choose whichever one which best describes when ever it may be that YOU are stumbling across this weekends note …
CNBC: Kevin Warsh comes into the Fed facing a big ‘family fight’ over cutting interest rates
CNBC: 30-year Treasury yield tops 5.1%, highest in nearly a year
CNBC: The bond market is flashing a warning over Iran. A veteran of energy geopolitics explains the risk
We’re going to be inundated with headlines of US / China deals and with regards to SoH and EARL. What all of this means in as far as RATES is, well, anyone / everyones GUESS…
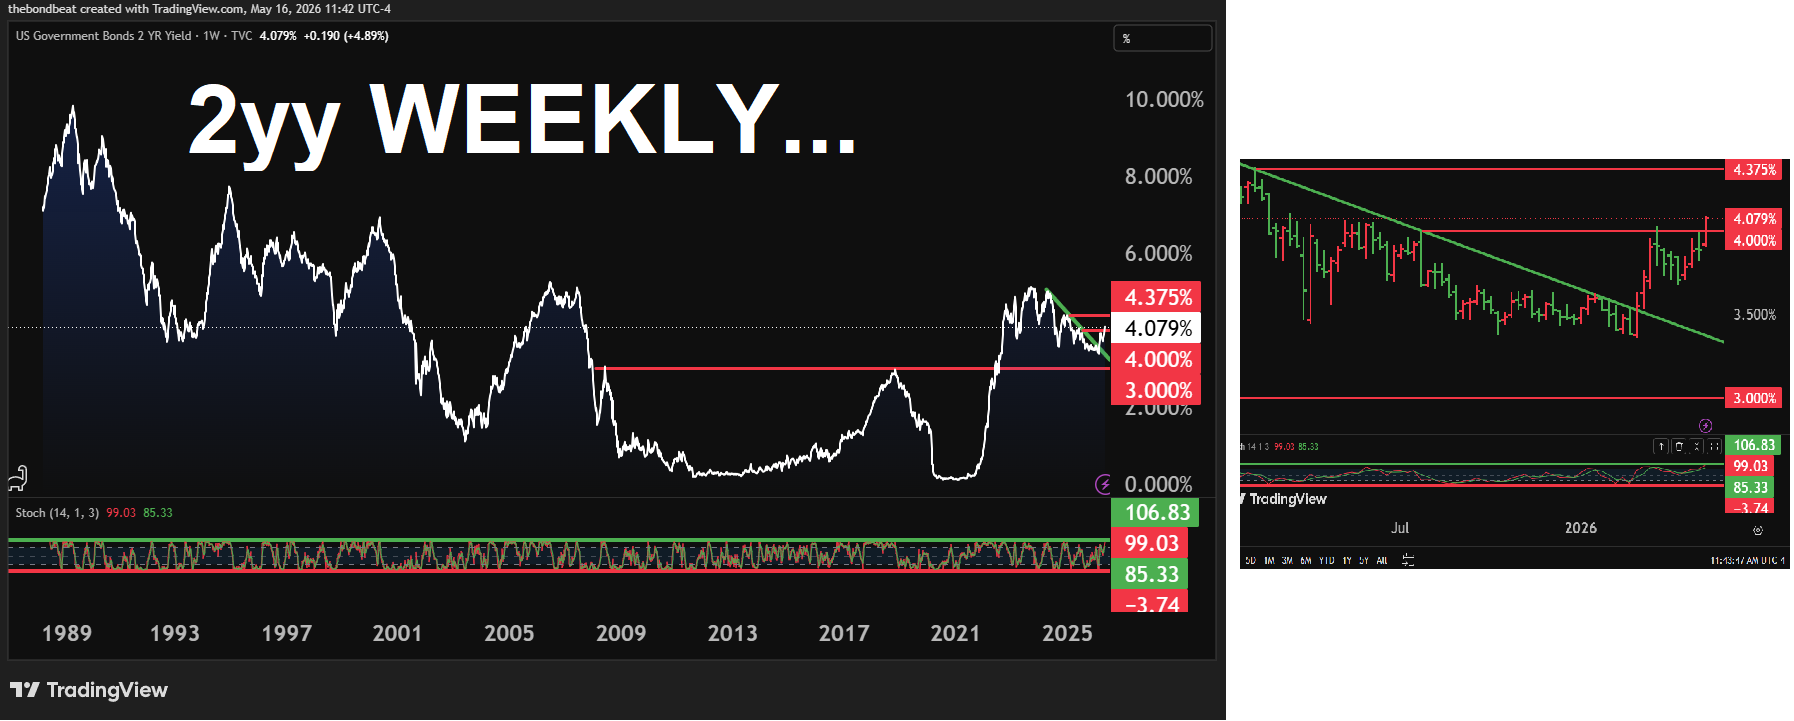
2yy WEEKLY (line): above 4.00 leads TO 4.375 OR back to 4.00 and below…
… momentum becoming overSOLD and so the idea is the Fed HIKES and yields explode OR we’re supposed to be covering shorts and buying front-end … where is Prof 2yrwhen you need him …
#Got2s? My apologies for the ‘chart crime’ above but idea is MY TLINES are personal and left up as my guide. Yers may look different and your opinion and view is just as valid.
I’m torn.
I’m sympathetic with both sides of the story. Longs and shorts are both my favorite trades right now. The bulls and the bears have some logic on their sides.
Inflation does not appear to be going anywhere, anytime soon.
At the same time, bonds forced to price this (and hikes?) in and higher rates attracting attention. And capital. From stocks. As they are more, well, ‘attractive’.
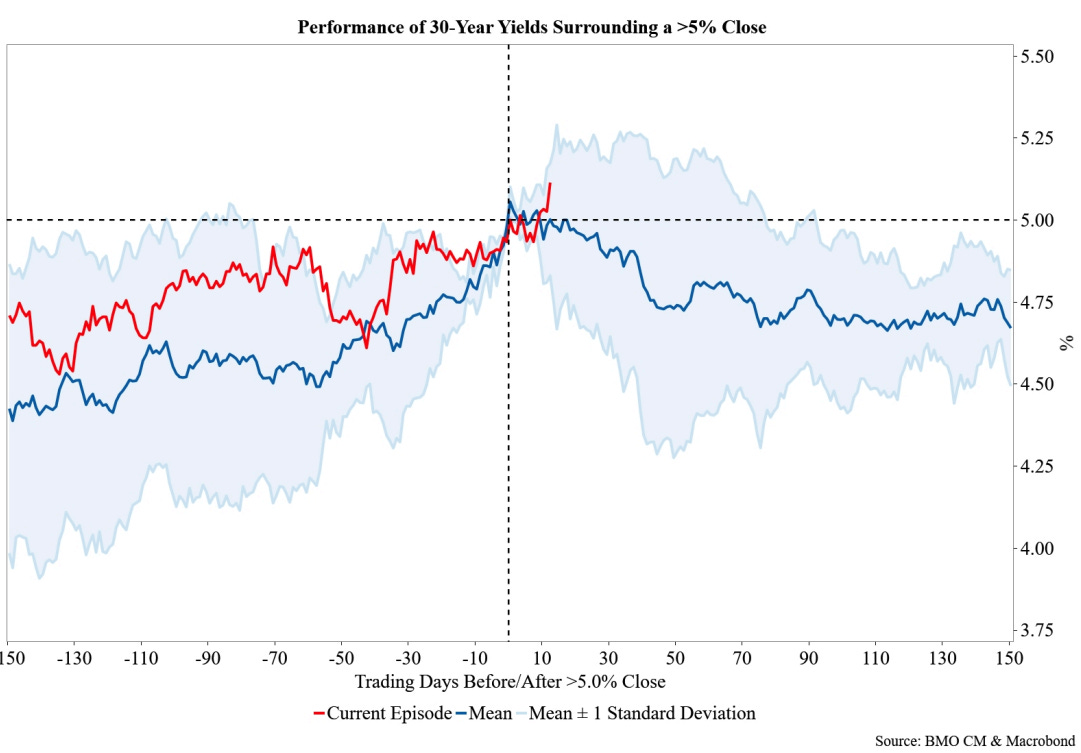
BMO (below) offers a look at HISTORY (never ‘different this time’, right) of when 30s close north of 5% — it’s proven #DipOrTunity and bonds return comfortably to a ‘4’ handle in days (maybe weeks) ahead.
On the other hand, DB — bearish and looking for 4.45 10s — has adjusted target HIGHER (up to 4.65% now) and they have been right and feel as though structural as well as cyclical forces continue supporting the move HIGHER.
If / when EARL stops going UP, all things will change.
It’s likely to be too late to buy unless, of course, it’s forced (risk managers always ruin the party).
Said another way, MARKETS been doing the work FOR the (new)Fed …
Last Updated: May 15, 2026 at 6:21 a.m. ET MarketWatch: The bond market is already hiking rates as Kevin Warsh takes over as Fed’s new chair
…The 30-year Treasury yield this week topped the 5% threshold, the benchmark 10-year yield reclaimed the 4.5% for the first time since June 2025 on Friday, and the policy-sensitive 2-year yield climbed above 4%, also for the first time in 11 months.
All three rates are important to the Fed, banks and borrowers. But the 2-year yield’s move above the Fed’s 3.7% upper limit of its target funding range is particularly noteworthy, as the below chart shows.
The 2-year Treasury yield is sitting above the Fed’s upper level of its short-term lending target.Photo: Federal Reserve, FRED data
That’s because the 2-year Treasury yield usually doesn’t sit above the Fed’s short-term target range, a rate that influences overall borrowing conditions. What the new shift signals is that the Treasury yield curve is increasing rates, even before the first policy-setting meeting set for June 16-17 with Warsh serving as chair.
“This is the modern bond vigilante,” said Ahn. “They don’t burn down the Fed’s credibility with one yield spike. They starve its optionality by lifting the entire curve above the policy band.”
There has long been a perception that new Fed chairs are swiftly tested by turmoil in markets shortly after taking the reins, according to Deutsche Bank’s Jim Reid, who noted the actual data on the topic has been mixed…
… TESTS straight ahead, no doubt. Are we entering El Erians STAGE 3 (demand destruction and weaker econ)? Could very well be and so, the higher rates go, the tighter financial conditions become, the stronger the case for … CUTS?
…Yet, this week also pointed to factors that risk undermining what has been an incredibly impressive stock market surge:
Demand Destruction: The longer and larger the global inflation hit, the greater the risk of demand destruction. This represents Stage 3 of my simple framework for the economic fallout of the Middle East War.
Sovereign Contamination: Stocks could face cross-asset contamination from continued bond market volatility in the more vulnerable G7 economies. On this front, I am keeping a close eye on Japan (a major holder of foreign securities that have already seen some drawdown) and especially the UK which illustrated five warning signs last week: the sheer size of the sell-off, its ultra-high beta attribute relative to other G7 markets, its eroded policy buffers, the rapid transmission to both the fiscal budget and Main Street, and a multidimensional fallout with financial, political, and social ripples.
NOTED and not lost on any of us, I’m quite sure.
DATA? Sure, look … data is FINE so rate CUTS not needed and apparently, higher rates are FINE ??
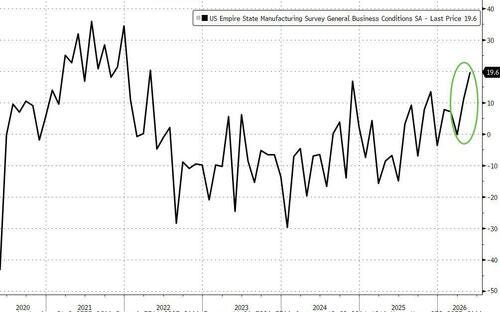
Despite record low consumer sentiment (if you believe UMich), this morning saw the Empire Fed survey show New York state factory activity expanded in May at the fastest pace in four years, and firms grew more optimistic about the outlook.
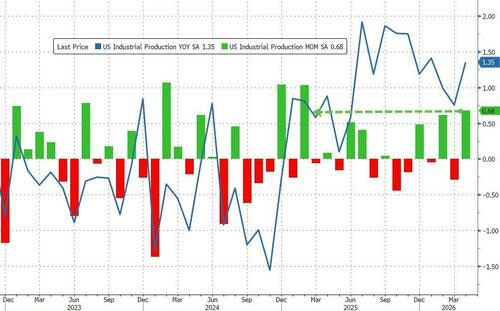
That was followed by a much hotter than expected Industrial Production print (up 0.7% MoM vs +0.3% MoM exp and higher than the highest estimate) for April (and March’s decline revised stronger), lifting annual growth up to +1.35% YoY...
… I’ll quit while I’m behind, am still torn thinking DEMAND DESTRUCTION and tightening of financial conditions (higher rates) as high / rising stock prices working to EASE said financial conditions.
NOT drawing the pre DOT COM analog, just thinkin’ outloud and just back from filling up some of the fleet … $4.21 / gallon and just inside $70.00 … PAY CUT.
With the idea of PAY CUT in mind, to the BondBot Intern …
The Treasury market spent the week vomiting up duration like bad sushi. 2s ripped 15bps higher as traders quietly replaced “rate cuts” with “maybe hikes again,” 10s blew through 4.50%, and the 30-year crashed north of 5% like it just discovered inflation wasn’t “transitory,” only on sabbatical. Oil screamed higher on the Persian excursion and a China summit that produced all the diplomatic firepower of a hotel breakfast buffet. Stocks wobbled because higher yields are the financial equivalent of gravity returning. CME FedWatch now shows hike odds climbing sharply since the Iran conflict began, which is Wall Street’s way of saying gasoline at $105 tends to ruin everyone’s dovish personality. For everyday Americans: mortgages, autos, and credit cards just got more expensive again.
“Turns out the bond market’s favorite peace treaty is still called lower oil prices.”
… I’ll move on TO some of Global Walls narratives I’m still blessed to stumble upon one way or another. These are SOME of THE VIEWS you might be able to use … How about timing of UPDATED short 10s call?! Hey now!!
Bonds NEVER shriek, bonds are bold and beautiful … ok, this week they may have shrieked …
The Trump-Xi meeting did not deliver any tangible outcomes, with no shared approach to reopening the Strait of Hormuz. As energy-driven price pressures pile up against a still-resilient US consumer, inflation becomes the focus. Long-end yields surged and even Fed hikes came into investors' view…
…US Outlook Into the fire Kevin Warsh was confirmed as Fed chair this week, taking the helm from Powell, who will remain as a governor. Warsh will inherit a hot seat, with cost pressures now becoming quite apparent and little indication that demand is cracking amid robust AI-related capex and resilient consumer spending …
Best in show addressing specifically what happens when bonds close north of 5% … short version is BUY BONDS as yields mean revert (think, NONE SHALL PASS) … and yet, while that is the takeaway, what’s noticeably absent? A long position … hmmm ….
…The limited data calendar and approaching summer months should contribute to listless trading conditions in US rates. A bull flattening consolidation is likely to prove the path of least resistance as the long-end pulls back from the upper-end of the yield range and 2s remain anchored near 4.00%….
…Charts of the Week …With 30-year yields back into the land of the 5-handle, our second chart takes a look at the historical performance of 30-year yields during selloffs that resulted in a daily close above 5.0%. To be clear, the chart compares the current episode to the average of the previous five instances since 2006, as well as the range offered by the mean ± 1 standard deviation. Over the last two decades, selloffs that brought 30-year yields into 5-handle territory have been generally short-lived as the elevated outright level of rates attracted dip-buyers. Recall that 2025 saw two bond selloffs that resulted in a >5.0% close, and in each scenario, 30-year yields stayed above 5.0% for only three trading days before returning to 4-handle territory. The October 2023 visit to 5-handle territory lasted less than two weeks. Before that, we have to go back to the selloffs during 2006 and 2007, which saw 30-year rates trade above 5.0% for a few months.
Using these five scenarios, by the 10th trading day after a >5.0% close, 30-year yields were, on average, 4.94%, and the range offered by the mean ± 1 standard deviation was 4.81% to 5.08%. By the 30th trading day after a 5-handle close, 30-year yields were, on average, 4.91% and the one sigma range was 4.65% to 5.17%. By the 50th trading day, the average was 4.74%, with a one sigma zone of 4.29% to 5.19%. Of course, the average drop in rates after a >5% close is even more dramatic if we exclude the 2006/2007 selloffs and only look at the past few years. In this case, the averages on the 10th, 30th, and 50th trading days were 4.84%, 4.76%, and 4.54%, respectively. Overall, history alone would suggest that the 5-handle yield peaks are likely to be established in short-order and the long-bond will make a sustainable return to 4-handle territory in the next few weeks, if not months.
Bearish. Approaching target defined while ago and rather than putting some hay in the barn (mistake, IMO), they’ve simply adjusted the target … does appear stop to be ‘trailed’ so no matter what, THEY WIN …
Firm CPI and PPI prints this week, alongside hawkish FOMC commentary, reinforced rate hike expectations with a full hike now priced by mid-2027. Given that the Committee has several tools available to dial up policy restraint before hiking outright (e.g., adjustments to statement language or SEP projections), Warsh’s bias for lower rates marginally reducing the odds of a hike, and that cuts through neutral have historically come much more rapidly than hikes, the most compelling position may be one that aims for convergence in the flies centered on M7 and Z7 (see here). For a more straightforward and liquid trade, we favor shorts on the SOFR Z6M7Z7 fly to position for a normalization of the “hump” on the curve. While 10-year yields reached our indicative target and 2026 forecast of 4.45% during this recent inflation-driven sell-off, we maintain our bearish bias on duration and move our target to 4.65% given structural supply-demand forces in bonds and elevated inflation risks that justify higher term premia. Separately, the Fed announced a stepdown in RMPs to just $10bn per month–slightly below our expectations of $15bn–likely driven by its confidence in the very benign funding environment in recent weeks…
…The rally occurred during an off-the-charts earnings season that saw S&P 500 earnings growth (25%) surge to arguably its strongest in over 2 decades while growth for MCG & Tech is even stronger (43%). Positioning meanwhile is not nearly that high. But, while this might suggest that positioning has room to go much higher, we would caution that a part of the stronger growth has come from surging prices in the face of supply squeezes and the rate of these price increases is unlikely to be sustained, as we wrote in our Q1 earnings takes (A Sharp Acceleration, Raising Estimates, May 04 2026)…
Touching base / circling back w/a shop who’s been feverishly BULLISH BONDS out last week with mid-year outlook … interestingly enough I cannot find reference to previously recommended LONGS … maybe an oversight OR i’ve just missed it …
May 15, 2026 Morgan Stanley Insight: Global Macro Strategy Mid-Year Outlook: Slippery When Oiled
G10 rates should cheapen first versus forwards, then outperform as oil tails fade and front-end policy repricing leads, with curve views cleaner than duration. FX should see continued cyclical currency gains and a final leg lower for the DXY, but we maintain that the greenback's slack is limited.
Key takeaways
G10 rates: We expect early cheapening versus forwards as markets price oil, demand, and supply tails, followed by outperformance as those risks fade and front-end policy repricing leads. The curve should carry more signal than duration: 2s10s steepening looks cleaner than relying on a large long-end rally…
…Interest Rate Strategy In the US, we expect Treasuries to cheapen first, then outperform forwards as oil tails fade and the Fed path reprices lower. Our probability-weighted baseline puts 10y yields at 4.45% in 2Q26, before falling to 4.25% by year-end and 4.15% by end-2027. The range of outcomes remains wide: the oil-led recession bull case takes 10s toward 3.30%, while the US demand-upside bear case takes them toward 5.15%. We expect the curve to steepen over the horizon…
…US base/demand-upside/oil-led-recession/permanent-oil-premium forecasts: Our baseline is now a subjective probability-weighted UST path, not a clean read-through from the economists’ baseline. The starting mix is 40% baseline, 15% US aggregate demand, 10% AI productivity, 15% global oil-led recession, and 20% permanent oil premium. Oil tails keep yields cheap to forwards in 2Q26, with 2y/10y at 4.05%/4.45%, about 22bp/18bp above forwards.
As baseline probability rises to 100% by 4Q27, the Fed midpoint falls to 3.125%, 2y/10y end 2027 at 3.45%/4.15%, about 48bp/33bp below forwards, and 2s10s steepens to 70bp. The inflation mix limits the long-end rally: 5y/10y breakevens decline from 2.60%/2.40% at end-2026 to 2.35%/2.25% by mid-2027, while 10y real yields rise to 1.95%.
Scenario skew: The UST bear case is US aggregate demand upside: stronger wealth effects and animal spirits lift growth above baseline, the Fed hikes to 4.625%, the 10y reaches 5.15%, the 30y rises to 5.50%, and 2s10s inverts to -50bp by 2Q27. The UST bull case is now a global oil-led recession, not a mild domestic recession: crude above $150/bbl triggers demand destruction, the Fed cuts to 1.625%, the 10y troughs at 3.30%, and 2s10s steepens toward 165-170bp. The new permanent-oil-premium case keeps the Fed at 3.625%, the 10y near 4.45-4.65%, and the long end exposed to inflation risk, term premium, and supply.
US Treasuries as hedges: Market pricing sits above our subjective probability-weighted Fed path through 2027. Translated into scenario weights, it looks most like 84% permanent oil premium and 11% demand upside, with no recession weight. We expect pricing to move toward more recession probability over coming months, helping duration regain its risk-off hedge properties. As the market-implied policy trough moves lower into year-end, 10y yields should follow…
…The base case: probability-weighted baseline …That outlook keeps oil tails alive early, then lets the curve migrate back toward baseline. The Fed midpoint holds at 3.625% in 2Q26, moves to 3.375% in 3Q26, and reaches 3.125% in 2Q27. We see the 2y and 10y at 4.05% and 4.45% in 2Q26, about 22bp and 18bp above forwards, then 3.75% and 4.25% by 4Q26, about 15bp and 9bp below forwards…
…By 2Q27, our targets are 3.60% for 2y, 3.85% for 5y, 4.20% for 10y, and 4.75% for 30y. By 4Q27, the 2y and 10y sit around 3.45% and 4.15%, 48bp and 33bp below forwards. The curve matters more than outright duration: 2s10s flattens to 40bp in 2Q26, then steepens to 60bp by 2Q27 and 70bp by end-2027…
… Moving along TO a few other curated links from the intertubes. I HOPE you’ll find them as funTERtaining (dare I say useful) as I do …
POSITIONS written up / best described from the consummate professional …
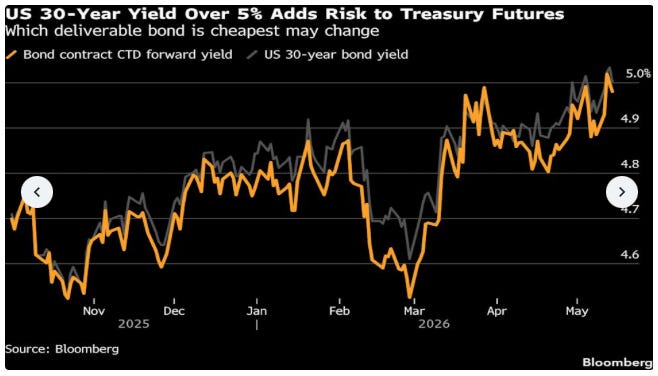
Fri, May 15, 2026 at 12:06 PM EDT Bloomberg: Bond Futures at Risk From Rapid Hedging Overhaul as Yields Climb
(Bloomberg) -- A global surge in yields is threatening to cause a disruption in the Treasury futures market — the principal tool for hedging US government bonds — as traders stand to overhaul their positions…
…Yield levels play a role in determining CTD status, however, and a prolonged shift in either direction can lead to switches. Because of differences between deliverable bonds, switches force futures traders to recalculate how many futures contracts they need to be long or short for a precise hedge — and to buy or sell accordingly.
For the June 2026 Treasury Bond contract, an original-issue 20-year bond maturing in November 2043 with a 4.75% fixed interest rate, has been the CTD most of the time since that contract gained front-month status in February.
A further increase in 30-year yields to around 5.35%, however, stands to cause the CTD to switch to a bond maturing in November 2045, with a 4.625% coupon rate, according to data complied by Bloomberg.
“A break well through 5% would create enough risk uncertainty to wreak havoc with a variety of trades/hedges as the number of contracts needed to balance another position could swing wildly,” CIBC Capital Markets strategists Michael Cloherty, Arjun Anath and Ian Pollick wrote in a report last week.
Switches also have the potential to upend Treasury basis trades, in which fast-moving traders try to capitalize on small divergences between cash and futures prices. Depending on the magnitude of the disruption, there could also be ancillary effects on interest-rate swaps, an alternative to futures for hedging Treasury positions, the CIBC strategists wrote.
Some investors using Treasury Bond or Ultra US Treasury Bond futures — allowing delivery of bonds maturing in at least 25 years — are likely “to shift to using swaps” as a hedge, they wrote.
A surge in demand to received fixed rates in the swap market, where long-term rates are already lower than corresponding Treasury yields, would widen those gaps, with implications for traders with positions in swap spreads, the strategists said.
“Higher yield environments can bring the possibility of a CTD switch into play,” said Agha Mirza, Global Head of Rates & OTC Products at CME Group. This is an “inherent consequence” of the market’s design and tends to be incorporated smoothly into pricing, he said.
CHARTS … bonds are once again, topical and so …
May 15, 2026 The Chart Report: Bond Yields Are Rising Across the Globe The Chart Report
Chart of the Day
🏆 Today’s Chart of the Day was shared by Robin Brooks.
The inflation trade has come roaring back this week, as a wave of hotter data may have forced investors to rethink the path of rates.
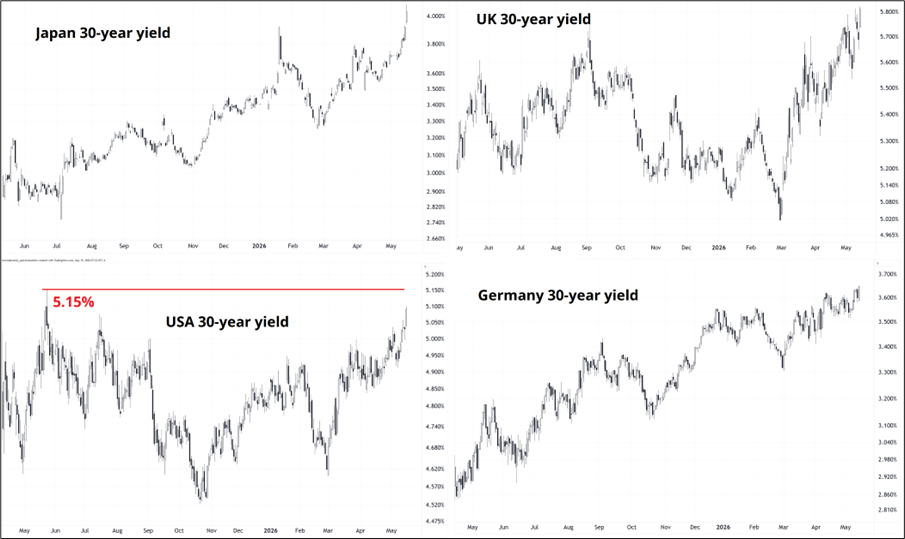
Global bond yields are moving higher in sync, with both current 10-year rates and long-term forward yields rising across the US, Germany, Japan, the UK, Italy, and France.
The sharp rise in 10y10y forward rates suggests investors increasingly believe structurally higher inflation, bigger deficits, and heavier debt issuance will keep rates elevated well beyond the current cycle.
The Takeaway: “Higher for longer” has officially gone global…
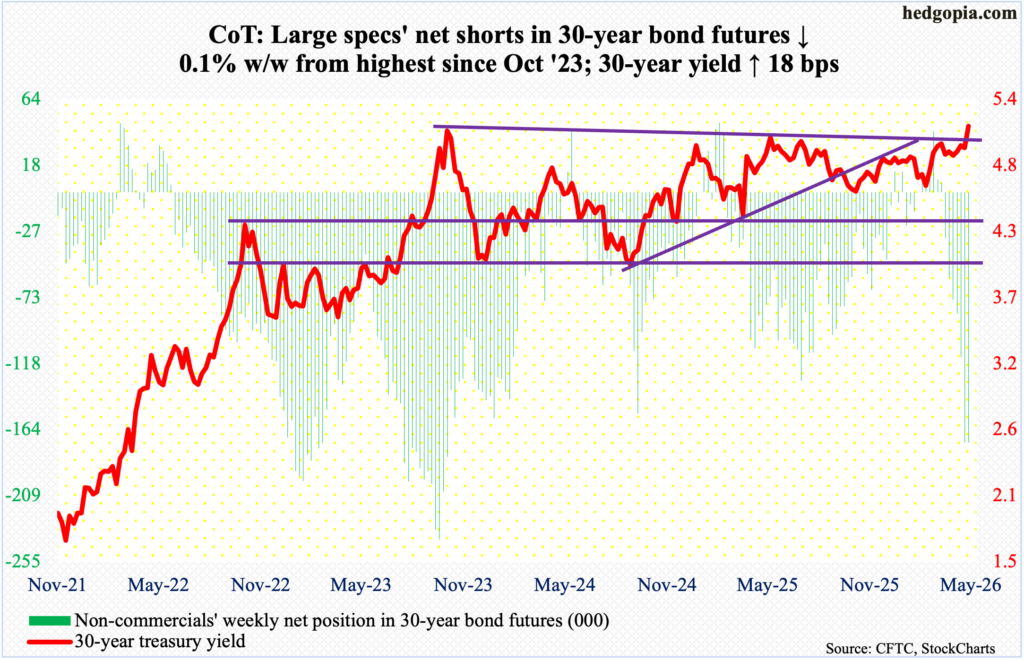
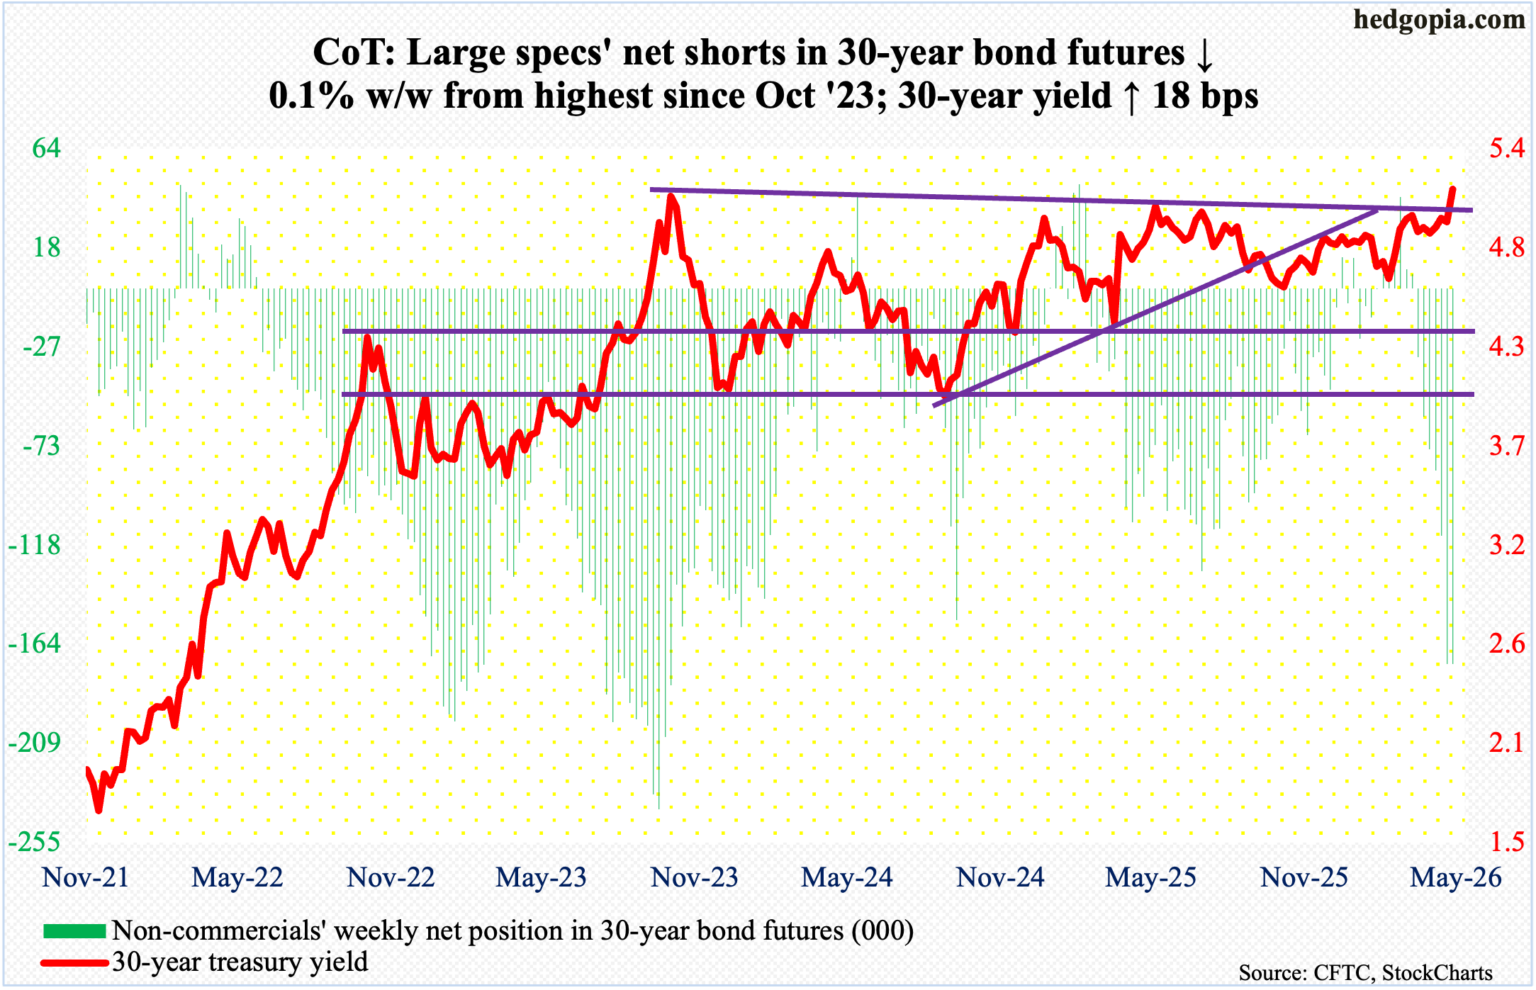
POSITIONS … specs REMAIN SHORT THE LONG END so, #WINNING …
Hedgopia CoT: Peek Into Future Through Futures, How Hedge Funds Are Positioned
…30-year bond: Currently net short 172.9k, down 88.
Brent’s got some funTERtainment worth a view …
May 15, 2026 SPECTRA: Running out of rocket fuel The rocket ship to Venus is running low on fuel.
…Interest Rates
Bonds are becoming a concern again as the U.K. political story heats up and global inflation spikes as Iran flexes its control of the Strait of Hormuz. Bond market volatility has been low but could pick up now because central banks don’t have the bond market’s back, and inflationary psychology from COVID threatens nearly-immediate second-round effects.
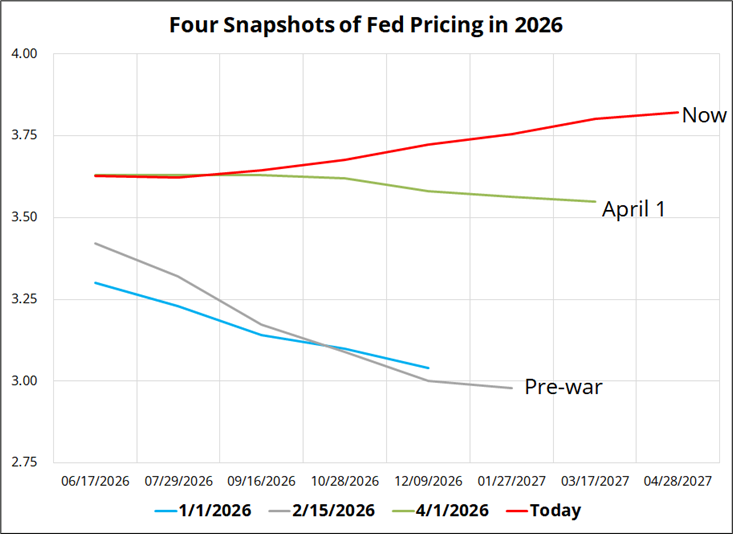
The big story is that the market is now pricing about 20bps of hikes for the Fed. This is in stark contrast to dreams of multiple cuts at the start of this year. Check out these four colored spaghetti noodles:
As I mentioned, I believe the market is not crazy to price Fed hikes here. Inflation could be a major political issue into midterms and the magical fantasy that a president can tell the Fed to cut rates to 1% and that makes any sense in the real world is closer to being dispelled. Warsh is the most orthodox, elite, $5000-suit, Morgan Stanley pedigree candidate for Fed Chair. Hassett, he is not. And there is zero shot the committee will vote for rate cuts in this sort of economic regime, regardless of what he says.
I can’t wait to see what Waller thinks about all this. Unfortunately, he’s not scheduled to speak as of right now.
The long end of the bond market is screaming in pain again.
Yields on the move … a couple MORE visuals as the Fed BEHIND THE CURVE …
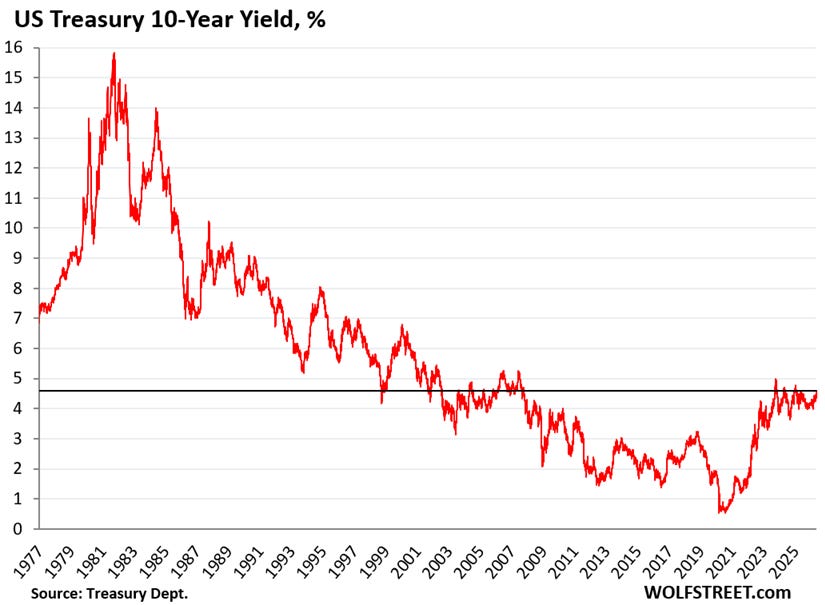
WolfST: US Government Sold $691 Billion of Treasury Securities this Week, 10-Year Yield Spikes to 4.6%, 30-Year Yield to 5.12% as 2nd Wave of Inflation Takes Off - The Fed is “behind the curve,” and the bond market is getting very nervous. Treasury yield curve flips from a sag to a hump in the middle as 2-5 year yields spiked.
…The 40-year bond bull market died in mid-2020, when the 10-year yield bottomed out at 0.5% amid the Fed’s massive interest-rate repression. Since then, as inflation forced the Fed’s hands, it has been a rough ride back to normalcy.
A 10-year yield of 4.6% in a historical context is still relatively low. At this yield, with this potential path of inflation, and with this Fed that wants to sit on its hands to let it happen, 10-year paper looks very unappetizing to this observer, and 30-year paper looks even worse.
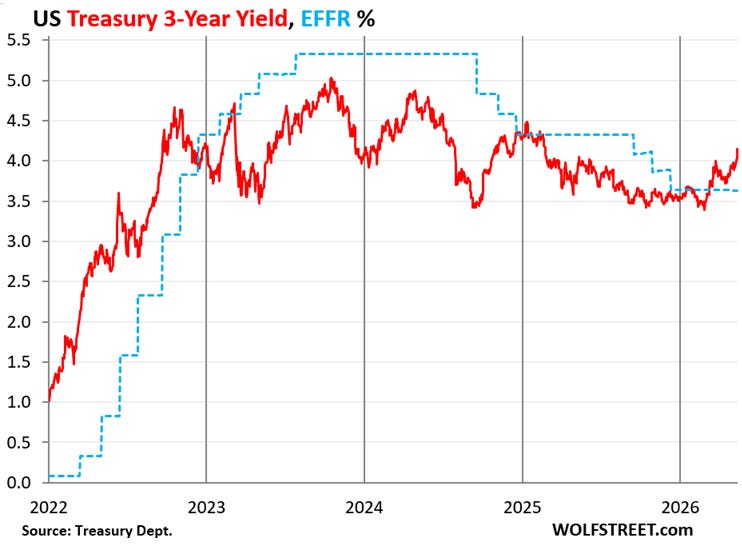
The 3-year Treasury note sold at auction on Monday at a yield of 3.965%. Then the yield spiked, amid the CPI and PPI inflation reports that followed the auction, including by 11 basis points on Friday, and ended at 4.15%.
In the four trading days since the auction, the 3-year yield has shot up by about 20 basis points from the auction yield. This is not fun for the buyers at the auction, and is a sign that the Treasury market is adding to the expectations of multiple rate hikes by the Fed, if not later this year, then next year.
The 3-year yield shows the U-turn in expectations in the market, having spiked by 76 basis points since February 27. The 3-year yield had anticipated the top of the rate hikes and then the rate cuts, and now by having blown through the EFFR is anticipating rate hikes.
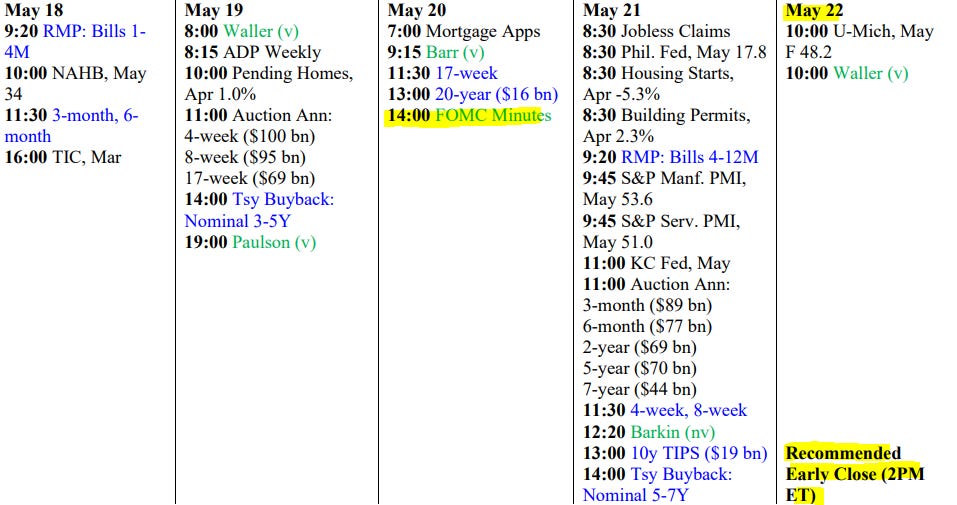
… AND for any / all (still)interested in trying to plan your trades and trade your plans in / around FUNduhMENTALs, here are a couple economic calendars and LINKS I used when I was closer to and IN ‘the game’.
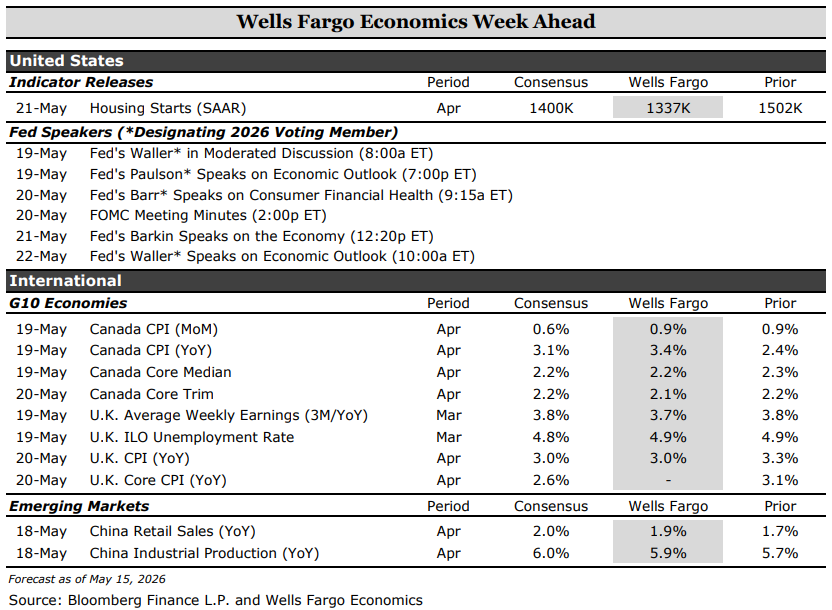
Next week’s release of the April FOMC minutes will shed light on how members of the committee saw the Fed’s next move as balanced between a hike and a cut. U.S. housing data, meanwhile, point to a moderating construction backdrop, as March’s rebound in starts likely overstated momentum amid a 2.6% year‑to‑date decline in permits and continued affordability pressures. In Canada, inflation remains elevated but mixed, with headline near 3.4% and softer core measures around 2.1–2.2%, keeping the Bank of Canada cautiously tilted toward further tightening. In the UK, easing labor market conditions—wage growth near 3.8% and declining vacancies—contrast with still‑firm inflation around 3.0%+, leaving policy finely balanced. In China, growth remains uneven but steady, with industrial production near 5.9% and retail sales around 1.9%, as strong manufacturing offsets softer domestic demand and points to a gradual cooling ahead.


"The Treasury market spent the week vomiting up duration like bad sushi"
Very vivid description.....
Too funny, but true....
I posted this blog on LinkedIn....