weekly observations (03.24.25): best in biz remains long BONDS, others love 5s one way or another ("Liberate Your Inner Bond Bull" -MS) and who's buyin' USTs (see DB); NCAAs expanding TO 4096 teams...
Good morning / afternoon / evening - please choose whichever one which best describes when ever it may be that YOU are stumbling across this weekends note…
2yy WEEKLY: TLINE ‘resistance’ was 3.90 and becomes 3.92 in week ahead…
…momentum looks overBOUGHT (and turning back towards more overboughty) and not YET extreme so the rich can / will get richer (esp if you think and price moar cowbell)
… Alrighty, then.
Personally, the reintroduction / soft re launch of ‘transitory’ in the week just passed has me … well … unnerved and hopeful at the same time. A couple of rate cuts officially pencilled in while market participants leaning on a bit more than that, well, makes me grateful no longer having to ride any fence or offer any pretense of a view.
That said, I’d be shocked with the updated DOTS <GO> (lower growth and higher ‘flation) that a couple more rate cuts happen this year and that would make me more of a seller into a further rally in front end …
Looking towards 7s — a lightning rod of an issue which can / will be as much a Fed ‘call’ and conduit as it may be in as far as a duration grab into NEXT Monday’s month end …
7yy WEEKLY: TLINE resistance around 4.05 HELD and next week watching 4.07 …
… this as again, momentum becoming more deeply overBOUGHT (not yet extreme here either, yet) and I’d urge a look at early indications for month-end needs … one thing that COULD tip the scales and keep current bid alive / well would be deterioration in EZ economies keeping discretionary and foreign PRIVATE BUYERS in demand of duration …
Make of any this whatever you want. Those out there DOING the buying and so, forcing the CME FED TOOL to indicate better than 60% chance of a CUT in June certainly know far more than I … The next part of this weekend programming involves trying to learn exactly that — what it is driving of the price action and a large part of that is whatever it is the narrative of the moment which Global Wall is sellin for flow…
I’ll move on TO some of Global Walls WEEKLY narratives — SOME of THE VIEWS you might be able to use. A few things which stood out to ME this weekend from the inbox …
Largest bank in the land acknowledging the ‘gentle’ rally …
21 March 2025 BAML: Global Rates Weekly Rallying me softly
The View: Confidence in focus US consumer data and EA soft data in focus to answer the question whether the uncertainty shock is more real for the US consumer than EA corporates. We are long EUR rates and long US breakevens outright and vs EA
Rates: I worry less when they worry more US: Hard data not cracking, which shifts rate risks; rates range-y till April 2. QT slowed less than we thought but still enough to support front end spreads.
…Inelasticity of USTs to deteriorating expectations As recent growth risks have deteriorated, USTs have lagged measures of downside risk. Potential drivers for the recent UST inelasticity include: (1) higher stagflation risks which drive the market to price less scope for the Fed to cut rates; (2) friction in a bull flattening dynamic to drives the curve further into inversion territory; (3) erosion of the credibility of the administration on the economic front, which limits the utility of USTs as a hedge and diversifier for risk; (4) erosion of the USD reserve status on the recent geopolitical realignment & USTs safe haven status; and (5) a potential realignment of portfolios away from dollar assets. For detail see: Inelasticity of USTs.
Some of these drivers are likely to be more persistent than others. Near-term, however, the recent dynamic suggest long real yield exposures (dip buying, as we have recommended recently) or synthetic long duration positions constructed though options (e.g., receiver structures in the belly and frontend of the curve) may be attractive alternatives to outright long nominal duration positions as a hedge for negative shocks.
Bottom line: Fed was more concerned with downside growth risks. Hard data hasn’t yet broken amidst weak sentiment data. These factors + inelasticity of USTs to growth shift balance of risks towards less acute downside US growth slowing / Fed cuts. We expect rates to remain range bound until April 2, but if hard data holds through March NFP (April 4) it will be hard to justify early summer cuts & rates at low end of recent range. QT slowing should be enough to support front end spreads.
British shop remains LONG 5s ….
20 March 2025 Barclays: Global Rates Weekly Tick-tock
In the US, consensus and the Fed are still too optimistic about the economy ahead of reciprocal tariffs. We remain long 5y USTs, 2y1y low strike receiver spreads and in 2yf2s10s steepeners. In Europe, we see greater value in front ECB meetings. In Japan, the post-BoJ presser was somewhat hawkish.
… AND same shop thinking economically tying together rates and tariffs …
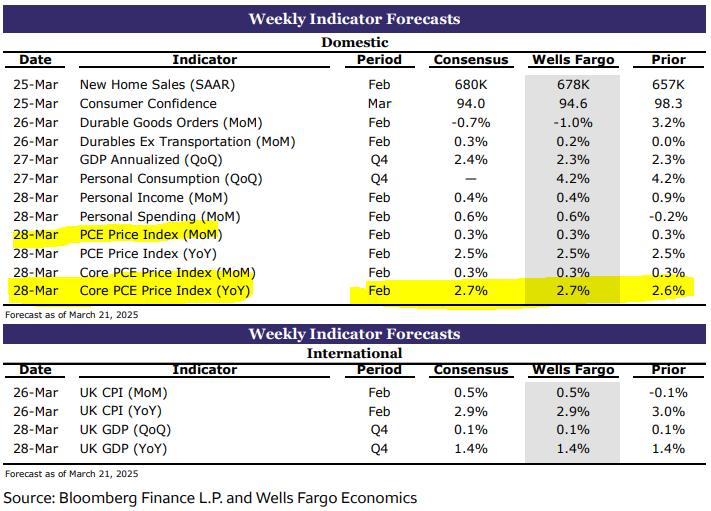
Central banks all emphasised uncertainty, but varied in their responses. Powell reintroduced "transitory" into Fedspeak, BoE was cautious, BoJ had a hawkish tilt, and ECB speakers differed on the effect of US tariffs. Ahead of 2 April tariff announcements, next week we watch PCE and S&P PMIs.
…US Outlook New boss same as the old boss? Amid intensifying uncertainty about both legs of the mandate, Powell struck a positive tone, resurrecting the transitory narrative for tariff-related price pressures and dismissing potential warning signs from inflation expectations and surveys. For now, hard data point to slowing, not weakness.
The latest data suggest that earlier spending estimates had exaggerated slowing, with retail sales, housing, and industrial production all strengthening in February. Even so, available data point to a deceleration of real GDP to about 1.0% q/q saar in Q1, with disruptions from threatened tariffs likely in Q2 and Q3. February personal income highlights next week's dataflow.
The Fed reiterated that it is in no rush to adjust rates amid elevated uncertainty. Although projections showed an updraft in the 2025 dots alongside higher inflation and downgraded growth, Powell was more optimistic, resurrecting the transitory narrative for tariff-related price increases and dismissing increases in some long-run measures of inflation expectations.
Even with big tariff announcements scheduled after the trade investigation on April 2, the picture remains opaque. This week, the Treasury Secretary floated a simplified "tariff number" plan that was quickly rescinded, leaving markets to speculate about how the administration will sort through the complexity of the reciprocal tariffs and the timeline for implementation.
Best in the biz remains LONG BONDS (caution warranted / expressed as to front end ahead of supply…)
In the week ahead, the US rates market will continue digesting the Fed’s messaging that further rate cuts are coming, it's just a matter of when, not if at this stage. The changes to QT have lowered, but not ended the balance sheet rundown. SOMA Treasury holdings will only be runoff by a cap of $5 bn per month – down from the prior level of $25 bn. As a point of clarification (we initially misread this), the MBS cap is unchanged at $35 bn and only maturities in excess of the cap will be reinvested into Treasuries. Given that the average runoff in mortgages has been roughly $15 bn, there was effectively no change on the mortgage side. In short, QT remains in place, albeit at a slower pace. Investors also continue to contemplate the relatively benign Fed response to the inflationary risks created by Trump’s trade war. By characterizing any upward pressure on inflation resulting from tariffs as transitory, Powell closed the door on the potential for a more dramatic response from monetary policymakers.
Moreover, the FOMC has made it clear that its reaction function to sticky inflation (and inflation expectations) is unchanged and involves delaying cuts until inflation subsides and there is further clarity on the trade war. While the Fed might have the ability to be patient, Treasury investors are less willing to be – as evidenced by the post-FOMC drift lower in yields. The bull steepening trend remains well intact despite a few episodes of bear flattening. The most notable of which followed the decades-high University of Michigan gauge of forward inflation expectations. The market was looking for a more hawkish response from the Fed than was offered, hence the solid bid for the 2-year sector that subsequently emerged.
Given the broader global macro backdrop, we remain onboard with the bullish momentum and now that the event risk of the FOMC announcement/SEP has passed, we see scope for the duration rally to extend further. In the 10-year sector, the 200-day moving-average of 4.226% has been broken, clearing the way for a retest of the 4.104% level seen on March 4th.The bid in 2s has room to run as well, and we’re focused on the 3.825% print from March 11th. Further steepening of the curve would be consistent with a retesting of the bottom of the respective ranges in 2s and 10s, although the upcoming front-end supply risks pausing any further steepening progress.
Investors will also benefit from an array of commentary from monetary policymakers that we expect will primarily reinforce the message that the Fed is on-hold for the foreseeable future, but the next move will eventually be a cut. There is always the potential for a headline that rekindles concerns that the Fed will be unable to cut at all this year, even if any associated price action would be an obvious fade at this point. Let us not forget that Friday sees the release of the Fed’s favored measure of inflation in the form of core-PCE. The consensus is for a 'high' +0.3% with the risk that the move rounds up to +0.4%. The Fed already had the CPI/PPI data at the FOMC meeting and therefore, the core-PCE print won’t change the official policy stance. On the margin, this reduces the tradability of the release and reinforces our willingness to go with the bullish move in Treasuries. The performance of the equity market is an obvious wildcard as the end of the first quarter comes into focus. Flight-to-quality flows will be more relevant than any reversal of safe-haven demand as investors' confidence in the sustainability of any rebound is limited, at best…
… As for our long position in 30-year bonds (entered Thursday, March 6th at 4.60%), 4.50% has proven an obvious line in the sand, as the last two intraday forays below that level were short-lived. We now see a double bottom in yield terms at 4.49%, one of several technical hurdles in the path toward our target at 4.40%. The others being the 200-day moving-average (4.464%), and March’s low yield mark of 4.421%. Overhead, our stop out remains at 4.72%…
Here’s a monthly note from France largely centered around FX but …
…USD rates: Stagflation versus recession Stagflation versus recession: Our US economic forecasts reflect a stagflationary impulse. We continue to expect that the US administration’s trade and immigration policies will accelerate inflation while hurting growth.
Consumer and corporate sentiment has shown signs of faltering, highlighting concerns around structurally higher inflation and slower growth. While the data fits our stagflationary narrative, falling risk assets appear to be more focused on growing recession concerns than worsening inflation risks. Since the March FOMC meeting, US rates have priced in about three rate cuts in 2025, compared with slightly more than one cut in early February.
While yields broadly remain lower than in the first six weeks of this year, the stagflation versus recession debate has increased daily volatility in the yield curve. We expect the Fed to be reticent about rushing to cut rates while inflation remains high (and is potentially accelerating), unless growth deteriorates far more than we expect.
Prospects for continued flattening less clear: In the aftermath of high inflation in the 1970s and early 1980s, the Fed needed roughly two decades to firmly anchor US consumer inflation expectations. With measures such as the University of Michigan 5–10y inflation expectations rising to 3.9% in mid-March (the highest since 1991), the Fed is unlikely to rush to cut rates based merely on slowing growth. To be sure, in the event that US growth plunges, the Fed has room to reduce rates quickly with the base rate at 4.25–4.50% and estimates of the nominal neutral rate rising (we estimate the neutral rate at 3.75%).
The March FOMC meeting and press conference revealed a Fed that appears equally concerned about growth and inflation risks, but continues to believe that long-run inflation expectations are anchored despite the elevated University of Michigan survey. In any case, the March summary of economic projections (SEP) revealed that the FOMC has heightened concerns about upside risks to inflation and downside risks to growth.
We still expect the Fed to remain on hold for all of 2025 and believe that monetary policy is not the only factor that may keep the curve relatively flat while containing longer-term yield increases. Our current base case is for Treasury to increase coupon issuance in February 2026. Nonetheless, we acknowledge the risk that factors such as money market fund AUM growth may mean that the Treasury could delay increasing the size of coupon auctions to as late as end-2027 (see No coupon increases through 2027?, dated 7 March).
Elevated growth concerns make us more cautious on the curve, with the prospects for continued flattening less certain. We now expect range-trading on the curve and have closed our 2s10s UST flattener, but remain long 10y TIPS to benefit from lower real yields and long 5y TIPS breakevens.
In this next weekly from a small German bank you may / may not have ever heard of, is a section with a link thru to charts which always catches my eye and worth a look … a couple of my favorite brought forward … I’ve ALSO brought forward some initial MONTH END rebalancing / demand thoughts, too … Month END is NEXT Monday!
…Domestic investors continue to fund the bulk of US deficit and Fed balance sheet unwind
…Private investor Treasury holdings concentrated in maturities of 5 years or less
…Overseas buying of Treasury securities driven entirely by the foreign private sector
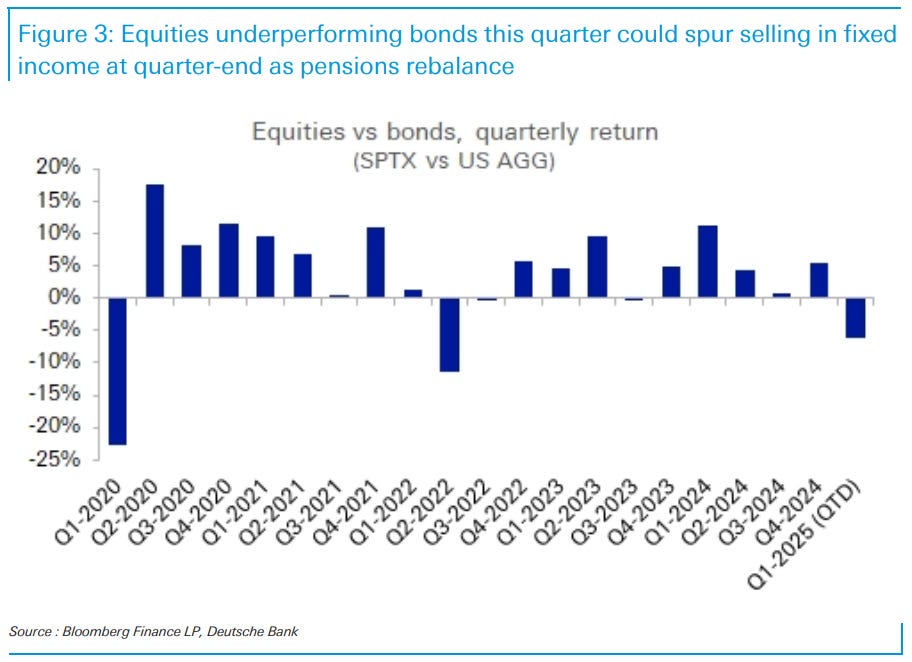
…Quarter-end rebalancing: weak impetus for bonds In the five years since Covid, U.S. equities have rarely underperformed fixed income on a full-quarter basis. Aside from the 20% drawdown in the S&P 500 in Q1 2020, S&P returns have trailed the Bloomberg U.S. Aggregate Index in only two other quarters: first during its 16% decline in Q2 2022, followed by another 4.9% drop in the subsequent quarter (versus a 4.8% decline for the Agg). If current market levels hold, the S&P 500 would underperform the Agg by a staggering 6.1% this quarter – the second largest gap since Covid.
With quarter-end approaching, fixed income’s outperformance this quarter could mean selling pressure from pension rebalancing flows. Our factor model estimates just $6bn of net fixed income buying across public and private pensions for the quarter. (The factors account for under/overinvestment from previous quarters plus new contributions.) This estimate is the lowest since Q3 2022 and ranks in the 16th percentile over the past five years. As a result, there is a risk that this quarter-end could portend weakness for fixed income, driven by muted demand or potential selling as pensions rebalance into equities.
Same shop on POSITIONING and flows … important as you know, to listen to what they are saying they are doing but also to keep tabs on whatever it is that they are actually DOING …
21 March 2025 DB: Investor Positioning and Flows - Discretionary Positioning Neutral Ahead Of Tariffs
Equity positioning remains modestly underweight. Overall equity positioning edged up slightly this week, remaining modestly underweight after sliding sharply over the last three weeks (z score -0.30, 29th percentile). A drop in positioning to the bottom of the historical band, as happened during the last trade war, would take the S&P 500 down to 5250 (Taking Stock of The Selloff, Mar 14 2025). Underweight positioning is broad based but modestly so across mega-cap growth and Tech, the cyclicals and the defensives.
Discretionary positioning close to neutral ahead of April 2 tariffs announcement. Discretionary investor positioning (z score 0.07, 47th percentile) rose slightly this week and remains close to neutral amidst the uncertainty and volatility. Discretionary positioning looks to be caught between weakening survey data on the one hand but still robust hard data on the other and looks to be treating the anticipated tariff announcements on April 2nd as a 2-sided risk for now. Systematic strategy positioning (z score -0.48, 24th percentile) meanwhile remains notably underweight as vol remains elevated and trend signals weaken.
Brief equity rally after the FOMC in keeping with the recent pattern. The S&P 500 has been up after 10 of the last 12 FOMC meetings, either on the same day or the next, on average by just under 1%. We see this as reflecting the dissipation of a steep vol premium priced coming in, with a similar dynamic also playing out around other key calendar events, such as elections and CPI data releases. This becomes important to watch with the tariff announcements on Apr 2nd.
Plea for rate cuts in keeping with trade war 1.0. The post by President Trump following this week’s FOMC meeting, appealing for rate cuts, was in keeping with the pattern during the last trade war, with the tweets aimed at the Fed then occurring in clusters, either in reaction to equity market weakness or preemptively ahead of significant trade escalation. The latest fitting both those molds (Is There A Trump Put? Jun 2019).
Seasonally strong inflows have been very supportive of the equity market, but seasonality is set to turn down. Equity fund inflows have been strong in recent weeks, providing support even as positioning has been sliding. Indeed, continuing this pattern, this week saw a large inflow ($43bn) into equities. However, we would caution against reading too much into it. March is typically the strongest month for equity inflows, with one of the weeks usually quite large, benefiting in our reading from the timing of tax refunds. The typical seasonality for flows turns unfavorable from here on.
This next shop ALWAYS with something of value and making their (continued) bullish intentions know … with a catchy title, too, ahead of Liberation Day …
March 21, 2025 MS: Liberate Your Inner Bond Bull | US Rates Strategy
Many investment professionals spent most of their career dealing with a bull market in US Treasuries. The pandemic-related inflationary episode caused bond bulls to second guess themselves. The time has come for investors to reacquaint with their inner bond bull. Stay positioned for lower yields.
Key takeaways
The bond market rally entered a period of consolidation over recent weeks – lowering implied volatility and helping the intermediate sector outperform.
Consolidation after a rally could reflect a variety of forces: bulls taking profit, bears taking losses, bears putting up a fight, or bulls losing confidence.
Investors often reduce risk into important and uncertain events, especially after large market moves. This clears the air and sows the seeds of the next move.
Information about April 2 – so called "Liberation Day" – may hit news wires in the coming week, keeping nerves tense and Treasury yields biased lower.
We still suggest positioning for lower yields with trades that carry well, but stand ready to sacrifice carry to improve risk off hedge performance.
…New lows for Treasury yields ahead
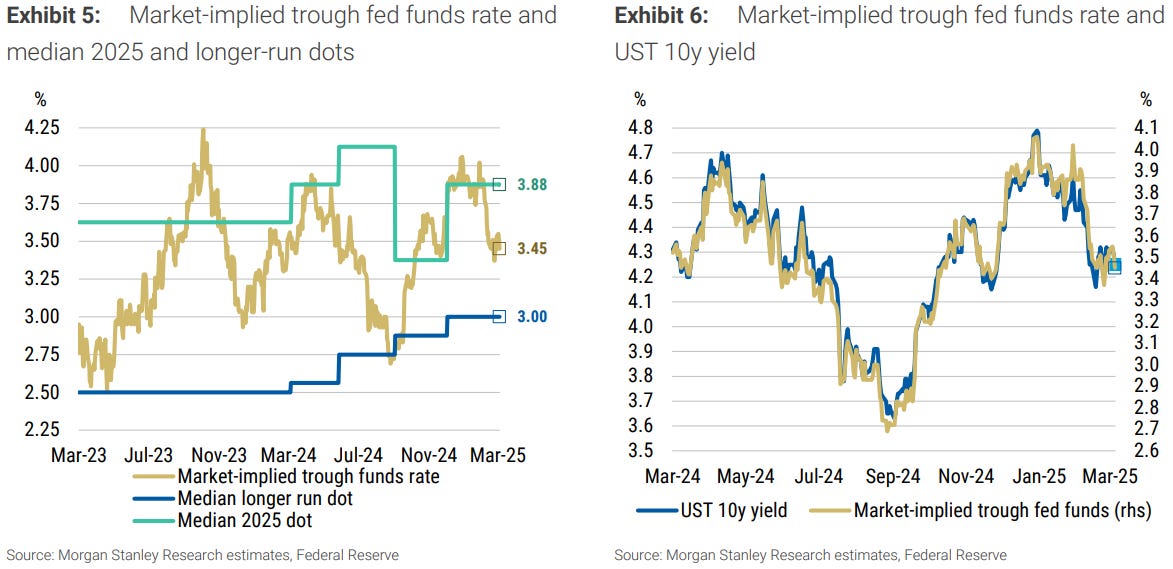
Amid rising downside risks to economic growth, we believe the current pricing of Fed policy should encourage more investors to buy US Treasuries. The market-implied trough policy rate remains well above the longer-run neutral rate written down by the median FOMC participant (see Exhibit 5).
The Fed may not get to 3.0% this year, of course, but it looks increasingly likely it will take policy to 3.0% in 2026 – consistent with our US economics baseline of a policy rate that moves below 3.0% next year.
As the market reprices to a lower trough policy rate, Treasury yields should fall further – in keeping with the recent relationship (see Exhibit 6).
10y Treasury yields should fall below 4.0% – to as low as 3.85% – if the market prices the Fed to return policy to 3.0%.
In the event that 10y Treasuries trade rich to their historical relationship with the pricing of Fed policy, 10y Treasury yields could even reach 3.75%.
We continue to believe that investor sentiment remains fragile, and confidence remains likely to deteriorate further as April 2 approaches. Our public policy strategists expect this date starts a series of negotiations that result in higher tariffs, but less than implied by the US's stated reciprocity framework….
…Stay positioned for lower Treasury yields. We prefer maximizing the carry profile of expressions that should benefit from lower yields – hence our preference to buy 5s on the 2s5s30s 50:50 butterfly instead of buying 5s outright.
At the same time, we understand owning the 5y point outright would benefit more from another large move to lower yields. Given it carry and rolls worse than the butterfly expression, we need to be more confident in the move to lower yields.
Same shop on NEXT Monday’s month-end extension — this on top of or in addition TO what German bank noted above (ie selling pressure in FI) …
March 21, 2025 MS: Global Rates Strategy: March Index Extensions
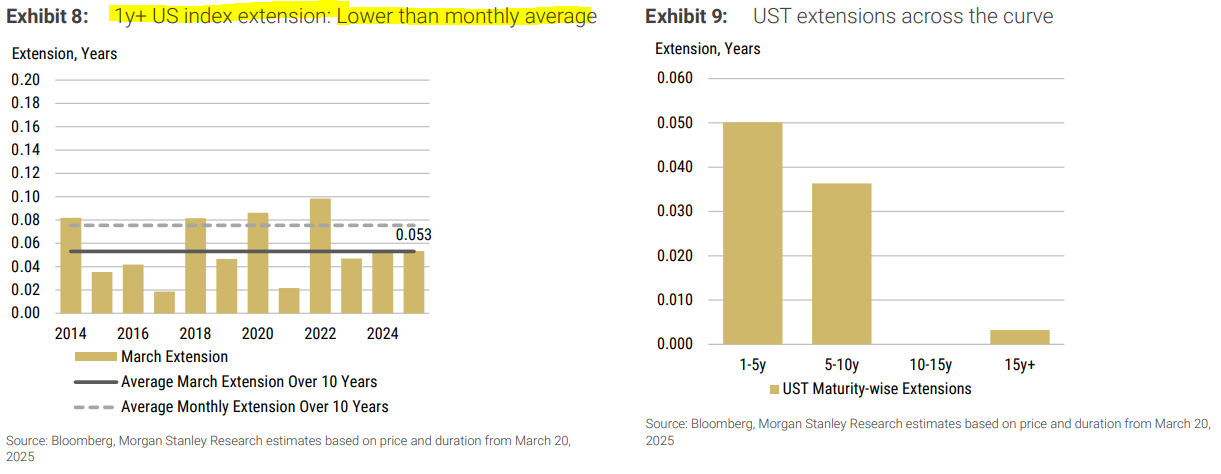
Eurogovies extend by 0.069y, marginally higher than March avg, higher than monthly avg; USTs 0.053y, in line with historical avg in March; UKTs to extend by -0.030y, lower than monthly avg; Eurolinkers extend by 0.178y, higher than average; TIPS to extend by 0.031y relative to March avg of 0.023y…
…United States We expect the 1y+ UST index to extend by ~0.053y, compared to an average March (0.053y) and an average month (0.075y) – Exhibit 8 . A total of US$315 billion of supply (offered amount) will affect the extension, and US$208.9 billion market value of bonds will fall out of the index. The monthly issuance of 2y, 3y, 5y, 7y, 10y, 20y, and 30y will affect the respective maturity-wise indices.
Same shop with a note focused on the front end …
March 21, 2025 MS: Fewer Cuts Now, More Later | US Rates Strategy
March FOMC affirmed our view – fewer cuts now mean more cuts later – propelling SFRM5Z6 to local lows, as markets come to terms with back-loaded rate cuts. Fed patience will test the resolve of investors in risk markets, leaving the left tail ripe to widen; stay in SFRM5Z6 curve flatteners.
ey takeaways
The aftermath of the March FOMC sent the SFRM5Z6 curve to local lows on the idea the Fed is more likely to be late than early, in regards to rate cuts.
A Fed that remains patient longer than investors in risk assets want to tolerate should lead to a lower market-implied trough rate and flatter SFRM5Z6 curve.
Current Fed policy pricing does not imply investors have made a recession their baseline view. April 2 may be the catalyst for a wider left tail distribution.
The Fed's decision to once again taper the pace of asset runoff means the runway for QT now extends well into 2026, in our view.
Rising US household net worth bodes well for strong income tax receipts in April, meaning a larger drain in funding markets; stay short SERFFJ5.
… I’ll check back and update IF anything more funTERtaining ahead of Sunday nights open and ahead of Monday FUNday month-end … Moving along TO a few other curated links from the intertubes, which I HOPE you’ll find useful …
First up, buyers of bonds and duration be thinkin’ and expectin’ like …
March 22, 2025 Apollo: Market Expecting Consumer Spending to Slow Down
The S&P 500 basket of stocks for consumer discretionary companies has declined significantly in recent weeks, suggesting that investors are starting to worry about future consumer spending on big-ticket items such as cars, washing machines, and mobile phones, see chart below.
Next up from The Terminal . com …
March 22, 2025 at 1:00 PM UTC Bloomberg: Diverging US Economic Data Begs the Question: Is a Slowdown Coming?
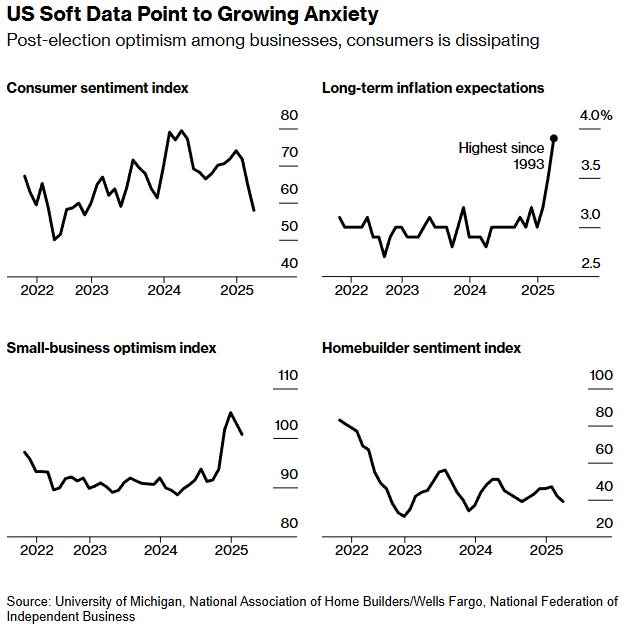
…Much of the anxiety can be traced to surveys of consumer attitudes from the University of Michigan and The Conference Board, which have both cited concerns that tariffs will lead to higher prices. Executives from Nike Inc. to Delta Air Lines Inc. have noted the trend, contributing to a multi-trillion dollar wipeout in stocks in the past month.
… Fed Chair Jerome Powell on Wednesday sought to tamp down worries over those inflation expectations, repeatedly referring to the figure as an outlier. He also said the relationship between soft and hard data “hasn’t been very tight,” and it makes sense for policymakers to hold interest rates steady until they have a better sense of Trump’s policies…
Then there’s the hard data, which indicates the economy is cooling off but hardly dropping off. Job gains moderated in February and unemployment ticked up, but both still point to a solid labor market. Inflation eased in February, notching the slowest pace of price growth in four months.
Other data have also been positive, but not without caveats. US factory output came in higher than expected in February, which economists largely said was indicative of manufacturers ramping up production to get ahead of tariffs. And while new home construction picked up last month, it was seen as a rebound from January’s bad weather.
The trend in consumer spending has been the most discouraging, judging by retail sales data and inflation-adjusted figures from the Commerce Department. But taken together, Powell still says the economy is solid.
“It is the soft data, the surveys, that are showing significant concerns,” Powell said Wednesday after the central bank’s policy meeting. “If that’s going to affect the hard data, we should know it very quickly. And of course we will understand that. But you don’t see that yet.”
The uncertainty is gripping Wall Street and Main Street alike. Alicia Barker, whose Arizona-based company designs and manufactures components used to build custom closets and garage cabinet organizers, is hamstrung by rapidly changing trade policy.
“Our industry is already experiencing rising material costs, and these tariffs will only compound the challenge,” said Barker, president of Organizers Direct Industries. “The lack of clarity makes it challenging to determine the right strategic path forward.”
Bruh. Officials helping not helping helping … with friends like these who needs risk managers …
…As it says on my CV, monetary policy under uncertainty has been my primary area of research. And after 30 years in central banking, I can unequivocally say: Uncertainty is the only certainty in monetary policy.1
…Conclusion There is certain uncertainty in monetary policy. The current modestly restrictive stance of monetary policy is entirely appropriate given the solid labor market and inflation still running somewhat above our 2 percent goal. It also positions us well to adjust to changing circumstances that affect the achievement of our dual mandate goals.
Whatever the economy has in store for us, I am committed to supporting maximum employment and returning inflation to our 2 percent objective.
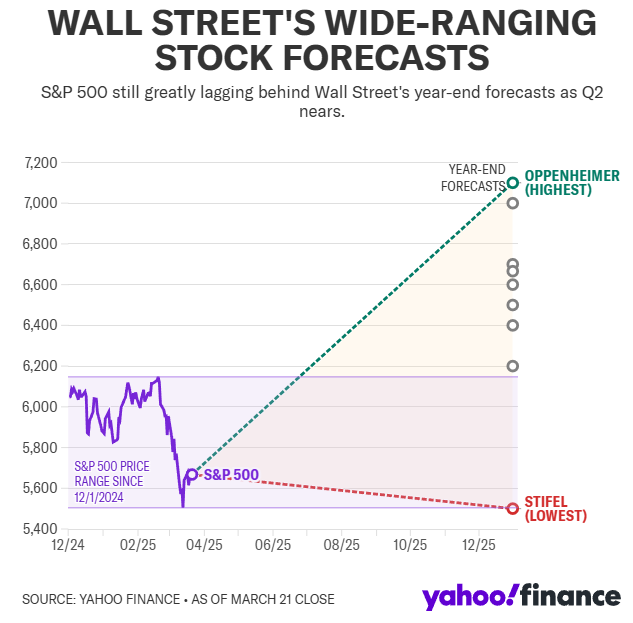
Everyone’s got a view and unfortunately for those looking for ‘pro’ guidance, the views are wide and ranging …
Sat, March 22, 2025 at 6:00 AM EDT Yahoo: Wall Street's S&P 500 forecast range is widening: Chart of the Week
… With an upside range as low as 6,200 and as high as 7,100, forecasters are calling for the S&P 500 to rally anywhere from about 10% to more than 26%.
Ruh Roh …
Mar 21, 2025 WolfST: Fed’s Operating Losses Declined to $78 Billion in 2024, “Unrealized Losses” Rose to $1.06 Trillion
QE has produced years of hangover.
… AND for any / all (still)interested in trying to plan your trades and trade your plans in / around FUNduhMENTALs, here are a couple economic calendars and LINKS I used when I was closer to and IN ‘the game’.
First, this from the best in the strategy biz is a LINKthru TO this calendar,


Very interesting articles...
Thank you...