weekly observations (03.16.26): updated FOMC calls, DipOrTunities (#GotBONDS?, 2s vs IORB?); some hold shorts, others LONG as geopolitics may start wars, but 'flation wins 'em...
Mar 14, 2026
Good morning / afternoon / evening - please choose whichever one which best describes when ever it may be that YOU are stumbling across this weekends note … First up, a few thoughts and links about the day / week that was …
Not sure where or IF to begin. Developments with regards to Iran and flow of EARL can / will likely change couple / few times between now and when markets open Sunday evening and heck, we may even have an entirely new set of facts to help determine price by Monday morning.
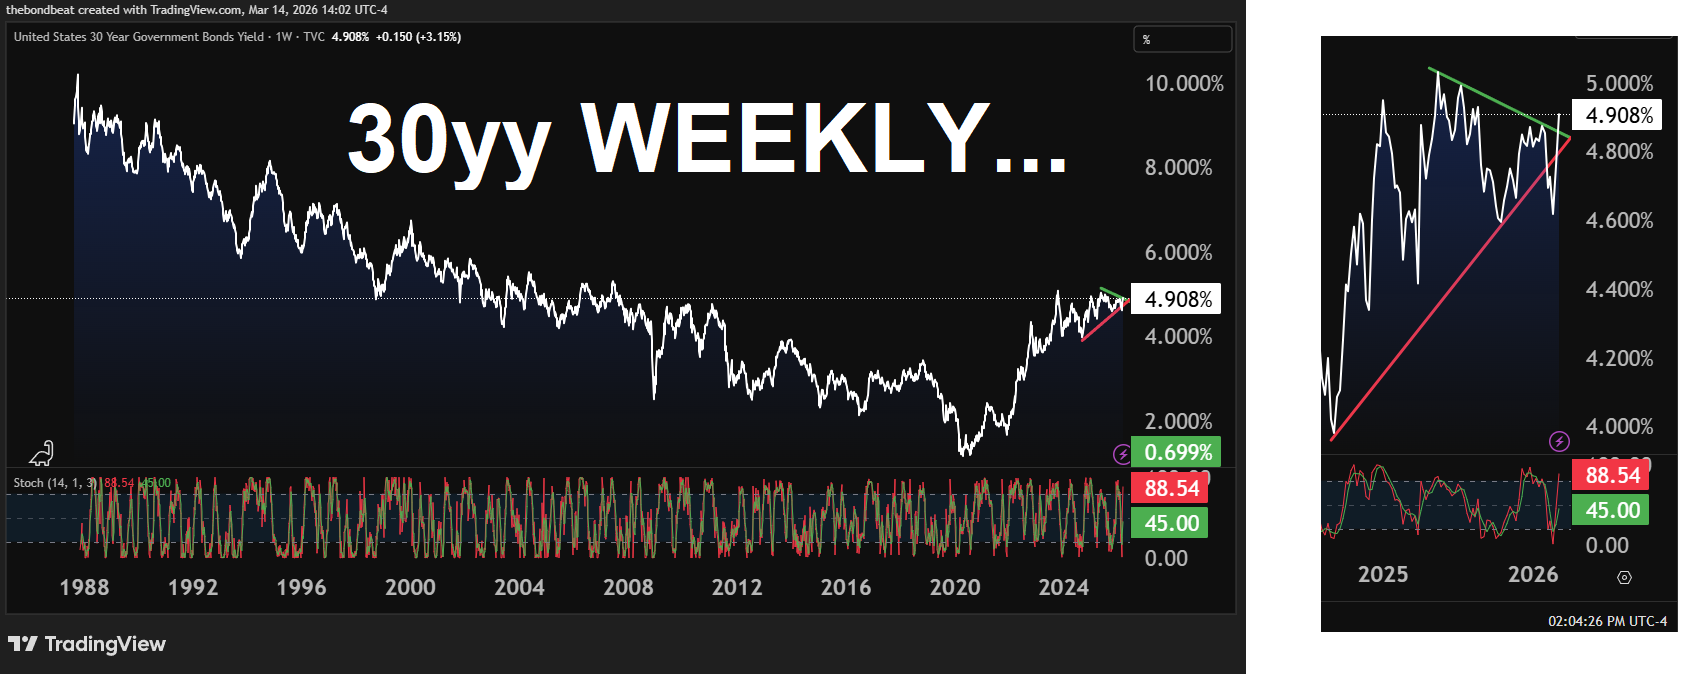
I’ll be brief and start with a weekly look at bonds with limited amount of context avail to me these days …
… momentum (stochastics, bottom panel) suggesting rates moved from overbought TO overSOLD …
#GotBONDS? DipOrTunity at hand? May very well be and am def more intrigued as situations raging on — war AND data — despite / because whatever is being priced in (pushed OUT) with regards to the Fed (CME FedWatch HEREwill tell you far more than I)…
Now in as far as allowing ChatGPT to work for me … again, happy to share the prompt but THIS is what I got …
Bonds Discover Geopolitics Isn’t Disinflationary It was another rough week to be long duration. The U.S. Treasury market took center stage as the 10-year yield pushed up toward 4.25–4.30%, climbing roughly 30bps over two weeks, while the 2-year hovered near 3.6% and the long bond crept toward 4.8%. Stocks didn’t love it. The S&P 500 slid about 1.6% on the week, marking a third straight decline as higher yields once again reminded equities who actually sets the price of money.
…Even a weak payroll report couldn’t save bonds. Normally losing jobs is bullish for Treasuries. This time the market shrugged and muttered, “nice try”.
…The bond market spent the week reminding everyone that geopolitics may start wars—but it’s inflation that wins them.
Fine and true as that may be, I think the point is that as you’ll see below — the rise in EARL and what you and I pay for gas at the pump ($3.27 for reg, Costco — up a nickel in past few days) matters a LOT. Likely more to those of us reading this crap than to those writing it, and you know exactly what I mean.
Markets are going to move this way and that and only in the fullness of time will we know how this episode plays out. I’m HOPING not to be waiting on line with my kids playing catch waiting to gas up the fleet as I was with MY dad in 1979.
Friday … a few buckets of headlines to consider (until the next ones scroll across) …
WAR …
ZH: Pentagon Sends Marine Expeditionary Unit To Middle East, Oil Spikes On Ground War Fears
ZH: Pentagon Confirms All 6 Crew Dead As Pro-Iran Iraqi Militants Claim They Downed US Refueling Plane
ZH: UBS And Goldman Map The Paralysis Across Hormuz Chokepoint
DATA …
ZH: Savings Rate Highest In 6 Months As Fed's Favorite Inflation Indicator Rises Near 2-Year High
ZH: US Q4 GDP Growth Cut In Half To Just 0.7% After Revision
ZH: Inflation Fears Fade As War Drags UMich Sentiment Lower
WolfST: Core PCE Inflation Hits 3.1%, Worst in 2 Years, in Unique Twist Blows way past CPI Inflation. Driven by Core Services … Energy spike is still to come. And today’s GDP inflation measure was revised up to 3.8%, worst since Q4 2022. The Fed needs to pay attention.
ZH: Job Openings Unexpectedly Surge By Almost 400K: Biggest Increase Since 2024
As far as the Fed reprieve goes, it appears this isn’t going to go away quietly SO will continue to watch and see what or how or IF current FOMC members react (more defiantly?) to retain optionality and independence…
… I’ll move on TO some of Global Walls narratives I’m still blessed to stumble upon one way or another. These are SOME of THE VIEWS you might be able to use … from inflation / growth recaps / victory laps TO some updated Fed calls and newly established positions …
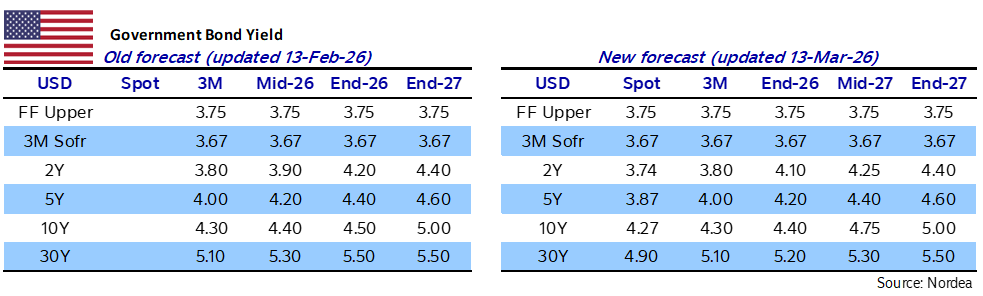
AN UPDATE to a f’cast … when the facts change … now only ONE (Sep, not Jun) cut in 2026 and a 2nd put back to March ‘27 …
Two weeks into the Iran war, its end is uncertain and oil is trading above $100. In a scenario of oil averaging $100 in 2026 (as in 2022) but without financial stress, global growth would be 0.2pp lower and headline inflation 0.7pp higher. The ECB would hike rates, while the Fed would stay on hold…
…US Outlook One battle after another Recent GDP and spending data suggest softer demand in Q4, but stronger income in January points to resilient activity. Core PCE inflation remains hot despite a soft CPI. We expect the Fed to hold next week and change our call to a 25bp cut in September and another in March 2027
Incoming data on Q4 GDP and January personal spending estimates imply somewhat softer US aggregate demand at the turn of the year. However, revised income estimates look considerably more supportive of spending and the JOLTS estimates indicate firmer labor demand that downplays signs of weakness in February’s employment situation report.
CPI inflation remains relatively subdued, with core inflation rising just 0.22% m/m (2.5% y/y) in February. However, hot readings for the PCE price inflation are unlikely to provide much comfort for the Fed, with the core estimate rounding up to 0.4% for the second month in a row in January, and February also expected to print at 0.4%.
We revised our FOMC call to just one 25bp rate cut in 2026, in September (versus June previously), and postpone our second 25bp cut to March 2027 (from December). This reflects elevated core PCE inflation estimates and upside risks to headline inflation amid the ongoing Iran war. In next week’s March FOMC meeting, we expect rates to be left unchanged, with at least two dovish dissents likely. We think the median dots will continue to signal one cut this year and one next.
Today's releases imply somewhat softer US aggregate demand conditions at the turn of the year. However, we caution about reading too much into this weakness, with signs that February's jobs report understated labor demand and with revised income estimates looking considerably more supportive.
The BEA placed core PCE inflation at 0.36% m/m (3.1% y/y) in January, the second consecutive 0.4% print, with core goods inflation once again running higher than its CPI counterpart. Our Q4/Q4 core PCE forecast stands unchanged, at 2.8% for 2026.
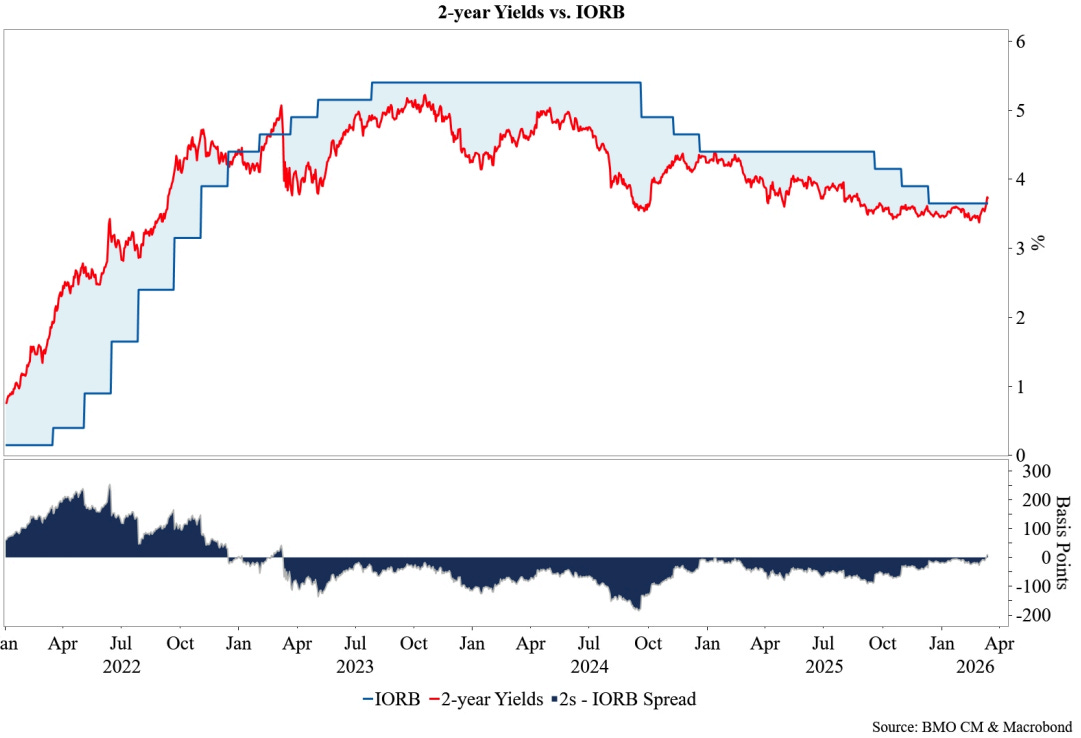
Front end (ie 2s) DipOrTunity … LONG looking for 3.15 with stop up at 3.73
…Given this backdrop, Wednesday's FOMC events will help level set the market's understanding of the Fed's reaction function to an oil shock. With 2-year rates above 3.70%, there is a risk that the market's expectations for a hawkish Fed pivot are misplaced – or at least premature. That being said, one could also make the case that the Fed pivots hawkishly by rotating the dual mandate emphasis even further toward the upside risks to realized inflation and long-term inflation expectations. We find ourselves leaning toward an outcome that disappoints those more hawkishly inclined given the two-sided risks to an oil shock, and unknowable timeline of the ongoing disruption to global energy supply…
…Our assumption remains that the next several weeks will provide an attractive dip-buying opportunity in Treasuries – the question is mainly one of timing…It's not unless the market has a more concrete sense of the war timeline or there is a sharp selloff in risk assets that we'd expect to see a durable repricing lower in 10- and 30-year yields. Let us not forget that the AI and private credit concerns that were responsible for bringing 10-year yields as low as 3.93% in February continue to linger in the background, implying ample scope for rates to decline should we see a collapse in oil prices back to pre-war levels. Furthermore, evidence of a fragile labor market and US consumer even before the recent surge in oil and gas prices has reinforced our dip-buying approach to the Treasury market in the coming weeks.
…Charts of the Week …Our second chart shows one of the most notable aspects of the price action over the last week – the breakout in 2- year yields above the Fed's IORB rate. Until Wednesday, the IORB rate (currently 3.65%) had served as a hard ceiling for 2-year yields since the Fed began lowering policy rates from the cycle peak. Forward rate cut expectations had supported the case for lower short-end rates, and 2-year yields did not close a single trading session above the Fed’s IORB rate for three consecutive years. In fact, over the last three years, 2-year rates have, on average, traded 60 bp below the IORB rate. Notably, only 4% of trading sessions have seen 2-year rates close within 10 bp of the IORB rate over the last three years.
On Wednesday, 2-year rates closed above the IORB rate for the first time since March 2023 – when the Fed was last in the middle of a rate-hiking cycle. As the selloff has been retained, 2-year yields have now finished three consecutive trading sessions above the IORB rate. Additionally, 2-year yields momentarily exceeded the upper bound of the federal funds target range (3.75%) on both Thursday and Friday, something that also has not been seen since March 2023 when the Fed was last in rate-hiking mode…
Short (10s vs 4.11, tgt 4.45) and delighted to be / say and reiterate so …
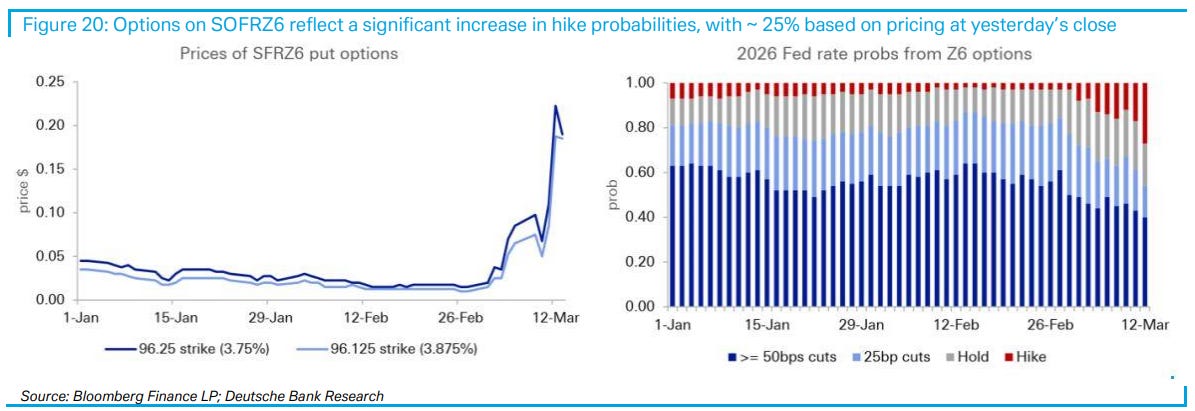
As the conflict in the Middle East continues into its third week, markets have begun pricing in odds of a prolonged conflict, with the front-end selling off sharply due to inflation concerns and swap spreads continuing to struggle amid focus on the cost of the war. Higher oil prices have reduced Fed rate cut expectations for this year and SOFR put options are pricing nontrivial odds (roughly 25%) of a hike this year; we think the conditions for a hike are unlikely to be met, in part due to the potential dovish lean of a Warsh-led Fed. Furthermore, the “peso problem” nature of AI disruption concerns means that the market could once again price more cuts with little tangible evidence of white-collar job displacement. Taken together, we think that front-end rates look attractive here and initiate a long SOFRZ6 position. An interesting feature of the recent rates moves is that the UST curve has flattened less than might be expected given the oil supply shock, as term premia expanded and the swap spread curve flattened. While we already held the view that term premia should be higher given the supply-demand picture prior to the conflict, upside fiscal risks have increased due to the potential need to fund a prolonged war and the possibility of more stimulus ahead of the midterms if the war negatively impacts Republican electoral prospects. Given the cleaner positioning and elevated fiscal and inflation risks, we reengaged steepeners, expressed as a long 5s10s SOFR term premium trade. This trade was also initiated within our broader macro portfolio, alongside a 5s10s EUR term premium trade. Lastly, due to the uncertainty from the volatility in energy markets, we have closed our pay 2y real yield / long 2y1y CPI trade at a loss and are neutral on front-end inflation.
…Could the Fed hike rates in 2026? Yesterday, the 2-year Treasury yield jumped about 10bps to 3.75%, its highest level since late August and roughly 20bps above the effective fed funds rate. The recent repricing has reflected a significant re-think of the Fed outlook this year in response to recent events in the Middle East, with the market moving from ~60bps of cuts priced two weeks ago to ~20bps at present. Most strikingly, the market has moved to price a roughly 25% probability of a rate hike this year.
With global central banks shifting in a hawkish direction, a question that was almost unthinkable two weeks ago is now being more heavily debated: Could the Fed raise rates in 2026?
From a fundamental perspective, we think there are two preconditions for a rate hike this year. (Note that the following only applies to hike conditions for 2026; there are scenarios where the Fed could hike at later dates simply because inflation stays at elevated levels and does not show signs of returning to target.)
First, downside risks to the labor market need to be eliminated. The past two years have shown that the Fed is responsive to weak labor market conditions and downside risks even in the face of elevated inflation. Hikes likely require something more, though. In particular, the labor market likely needs to re-tighten – e.g., with the unemployment rate falling back towards 4%, quits rising, and wages accelerating, among other conditions – and, therefore, return as a source of inflationary pressures.
Second, core PCE likely needs to show evidence of accelerating noticeably above 3%. Furthermore, the source of the rise cannot be readily identifiable as a shock that is likely to prove transitory even in the absence of tighter monetary policy (e.g., tariffs or oil). Of course, there may be thresholds for core inflation where the source of the rise is down-weighted. Nonetheless, to get to hikes the Fed would have to discard a strongly held narrative that a disinflationary trend is in place and that once one-off shocks dissipate inflation will be close to 2%. This would take a compelling story. Clearly, realization of the first point (a re-tightening labor market) would be one reason to reconsider fundamental assumptions about the disinflation trend.
As always, inflation expectations feature as a wildcard in this assessment. If measures of long-run inflation expectations began to rise noticeably, it would lower the thresholds on the labor market and spot inflation required for the Fed to consider a hike. We think most Fed officials are inclined to discount a rise in long-run inflation expectations that is isolated to the University of Michigan survey (indeed this measure has been above 3% for nearly two years). To become concerned, market-based measures (e.g., 5y5y breakevens and inflation swaps) would likely need to rise meaningfully, and / or the signal from University of Michigan would need to be confirmed by other survey-based indicators (e.g., NY Fed’s consumer survey).
We summarize these conditions in the following table, which is meant to be illustrative in showing combinations of the unemployment rate and inflation that could lead the Fed to hike. Evidence of rising inflation expectations would expand the region of rate hikes (red) and shrink the region of cuts (green)…
…How likely do these conditions appear at present? We continue to think they’re unlikely…
…Taken together, we conclude that rate hikes in 2026 are less likely than the market currently believes …
We expect the Fed will keep rates steady, as their communications emphasize elevated uncertainty from the ongoing conflict in the Middle East. With policy “well positioned”, Chair Powell is likely to avoid any strong signals about near-term policy, most likely setting the Fed up for a third consecutive hold at the April meeting – his last leading the Fed.
The Summary of Economic Projections (SEP) should be little changed, except for upward revisions to headline and core PCE inflation for this year. Although it will not take much to move the median dot for 2026, we expect it will most likely stay at one rate cut. In contrast, the long-run dot could edge higher.
Recent developments have reinforced our view that Powell likely delivered the final rate cut of his tenure last December. We see balanced risks to our expectations for one rate cut this year (in September). If the labor market stabilizes, sticky inflation could push the Fed to stay on hold for longer, while a re-emergence of labor market weakness could bring about earlier reductions. A rate hike is unlikely this year (see “Could the Fed hike rates in 2026?”).
GDP … slower growth and higher ‘flation … ‘not a desirable mix’ … understatement of the year?
March 13, 2026 First Trust: 4th Quarter GDP (Preliminary)
…Implications: …The more troublesome part of the report comes from the inflation front, where the GDP price index was revised higher to a 3.8% annualized rate from an initial estimate of 3.6%. GDP prices were up 3.3% in 2025, above the 2.5% increase in 2024. At the same time, real GDP rose 2.0% in 2025, down from the 2.4% increase in 2024. Core GDP grew 2.4% in 2025 versus 2.9% in 2024. In other words, the U.S. experienced slightly slower growth, paired with higher GDP inflation in 2025. Not a desirable mix.
Rate CUTS DELAYED due to the fog of war … I get it and hard to disagree with this and the updated call above … on a positive note, SHOULD (in theory) support the USD …
13 March 2026 INGFed to delay rate cuts as war clouds the outlook
The Middle East conflict will push up prices, but it will also likely harm US growth and job prospects. We see this as a Fed rate-cut delayed rather than removed story, unlike 2022 when a demand shock, combined with a supply shock, fuelled inflation and led to rate hikes
Jamie Dimon’s group SAYS … EARL matters and w/Earl ‘round $90, 10-15% decline in stocks possible and THAT could then reduce consumer spending 1% …
JPM: When oil jumps, household wealth guides demand
History is no stranger to oil shocks. The oil embargo of 1973. The crisis of 1979. More recently, the price surge after the war in Ukraine in 2022. Each episode rattled the global economy, yet over time markets and policymakers have become better at navigating supply disruptions. Oil production can adjust. Strategic reserves can be tapped. While painful, they can be temporary…
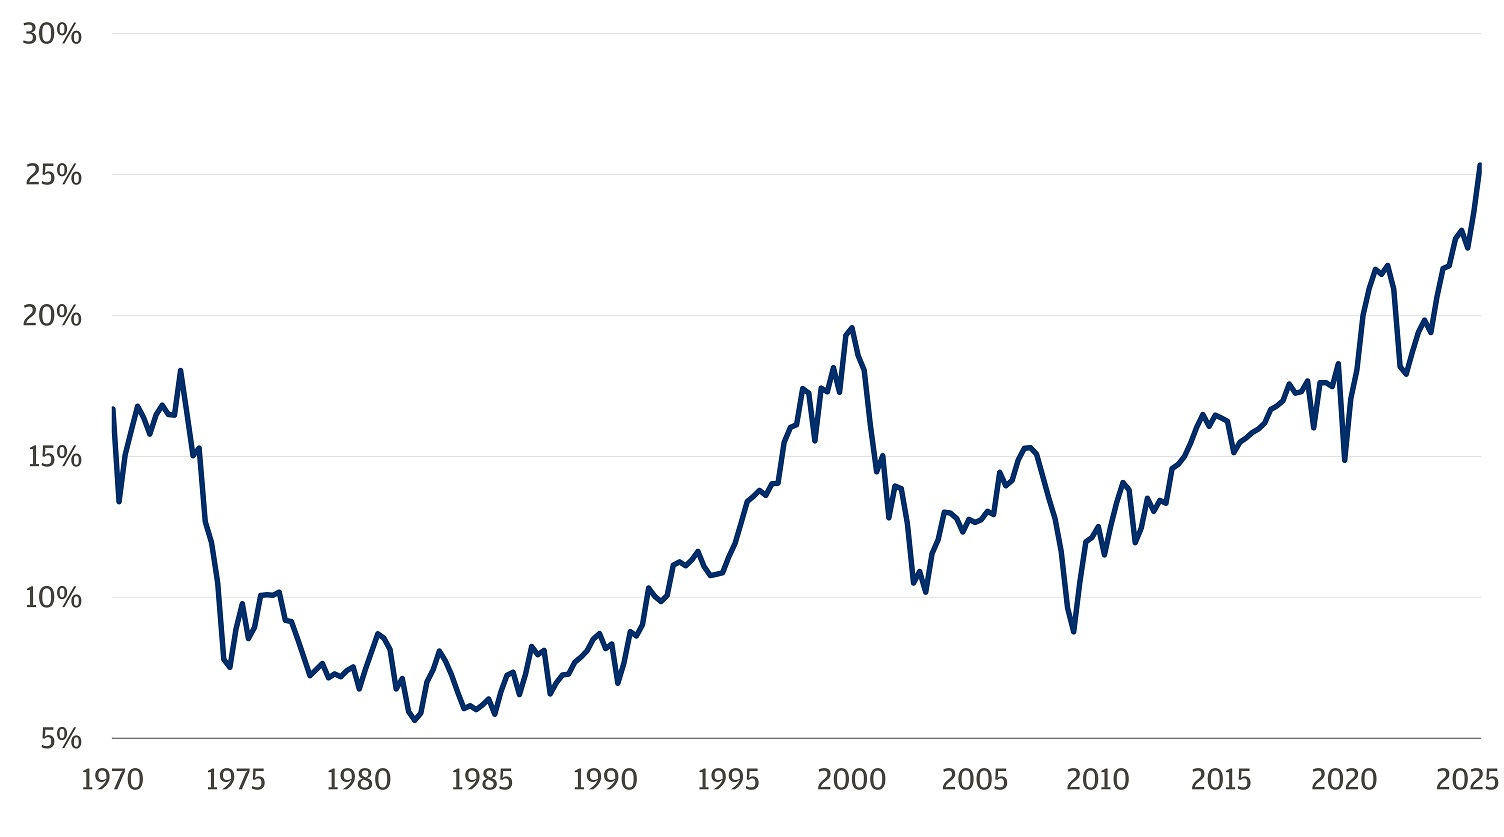
…Household wealth in equities is at record levels Corporate equities as a share of household and nonprofit organization net worth, %
…A domino effect A sustained oil price as high as $90 per barrel would likely catalyze a 10%–15% decline in the S&P 500. As the price rises towards and beyond, say, $120 per barrel, the selling in the S&P 500 will intensify. The implications extend beyond the United States. International and emerging markets typically carry a higher sensitivity to global growth shocks, and the spillover abroad could be even larger. The shift in outperformance is already palpable since the start of the conflict.
From a growth perspective, every 10% decline in the U.S. stock market then has the potential to reduce consumer spending by 1%. Now, combine it all. The compounded effect of sustainably higher oil prices and an S&P 500 bear market has a destructive demand effect, materially amplifying the hit to growth.
But in the face of shipping and oil production snafus, it’s the stock market that may have a more immediate impact on consumer behavior, before prices at the pump. And if the stock market reacts sharply enough, the next oil shock will not just be a supply problem. It could become a demand one. The situation remains volatile, and there is no guarantee of the outcome, but overall consumer health and energy independence put the U.S. on relatively more resilient rooting than its international peers.
…Governments This week’s moves were likely exaggerated by long liquidations and weakening liquidity conditions, though the depth decline was shallower and the rebound quicker than in recent episodes. If rates de-risking has been completed, liquidity conditions should continue to normalize in coming weeks, contingent on how the conflict evolves. We expect the FOMC to keep rates steady next week; risks around the dots and number of dovish dissents could bias yields higher, but after the sharp hawkish repricing, curve impacts may be limited. The front end may not fully reflect our Fed view over the near term; with inflation expectations rangebound, this should help stabilize yields. The 5-year sector appears too rich along the curve given current Fed pricing: maintain 2s/5s/10s belly-cheapening butterflies. We update our deficit forecasts, and continue to expect Treasury to begin coupon auction size increases in February 2027. Net T-bill paydowns and quarter-end dynamics should allow frontend bills to richen near term. With volatility elevated and the duration of the Middle East conflict uncertain, we remain neutral on breakevens…
…Treasuries Faraway, so close
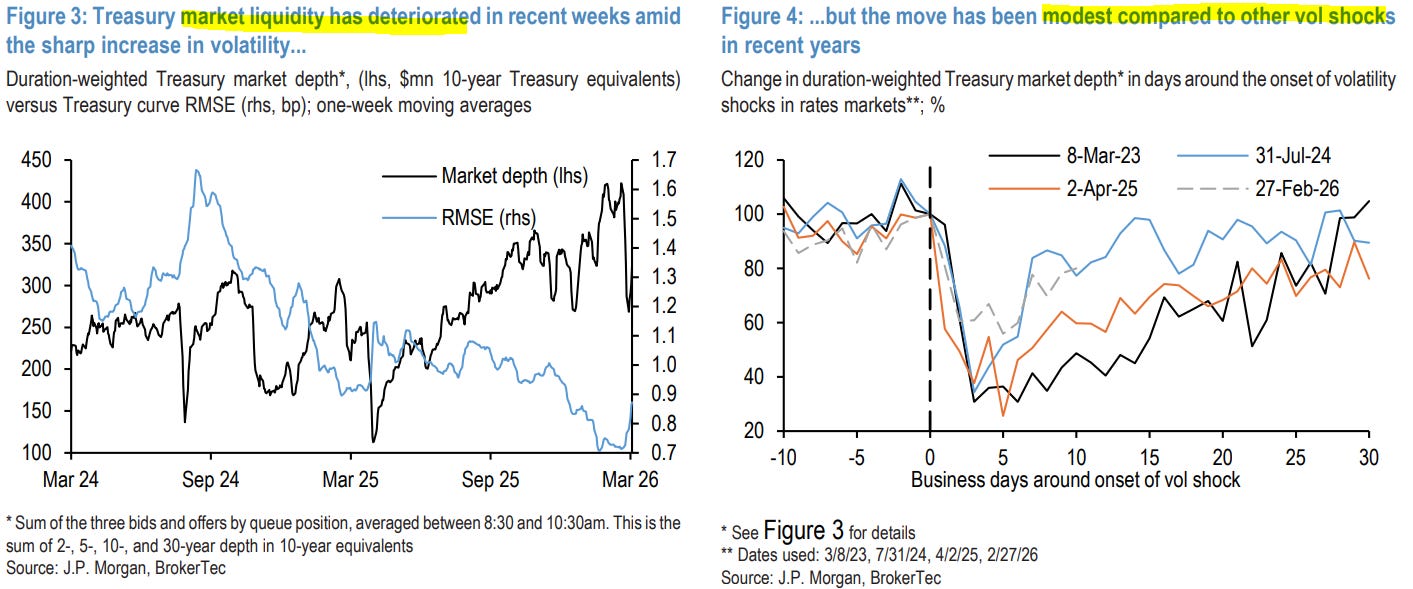
This week’s moves were likely exaggerated by deteriorating liquidity conditions, though the decline in depth has been shallower and the rebound quicker than in recent episodes, underscoring more resilient Treasury market functioning. If de-risking has been completed, liquidity conditions should continue to normalize in coming weeks, depending on the conflict’s evolution
We expect the FOMC to remain on hold next week and through mid-2027. Risks around the SEP and the number of dovish dissents point to risks of higher yields, though given the sharp hawkish repricing of expectations this week, curve impacts may be minimal
The front end may not fully reflect our Fed view over the near term, given lingering labor market concerns and the risk that higher oil prices trigger the Fed’s asymmetric bias around recession risks. This should help the front-end find better footing and, alongside rangebound inflation expectations, stabilize the rest of the curve
The 5-year sector has outperformed along the curve, and now appears roughly 10bp too rich given current Fed pricing. We continue to recommend 2s/5s/10s belly-cheapening butterflies as a way to position for a Fed on hold with a relative value overlay …
…This week’s moves were likely exaggerated by deteriorating liquidity conditions, as Treasury market depth has declined by about 25% from its local peak just last month, while dispersion relative to our fitted curve, a measure of how off-the-runs are trading, has risen about 0.2bp (Figure 3Treasuy mrketliqudy hasetriod nectwks amidthe sarpinces volatiy.). This should come as no surprise as both of these liquidity measures are sensitive to delivered volatility (see Treasuries 2026 Outlook, 11/25/25). However, compared with other volatility shocks in recent years, the downdraft in market depth has been modest. Figure 4.but hemovas benmodst cparedto hvlsckin retyas shows the change in market depth in the periods around other recent sharp increases in rates market volatility: the regional bank crisis in March 2023, the unwind of the JPY carry trade in the summer of 2024, and the “Liberation Day” shock last April. Treasury market depth declined by about 60-70% from pre-shock levels in each of these instances, and then slowly rebounded, with depth fully normalizing six weeks after the initial shock. The lone exception was the JPY carry trade, as conditions normalized quickly once positions were cleaned out. On this basis, the decline in depth has been shallower than in any of these other instances, and the rebound has occurred more quickly.
We take solace in these developments, and think this more modest deterioration underscores more resilient Treasury market functioning …
Some say / think and act DipOrTunity while others just note the potential correction …
Forced position squaring and a viewpoint among investors that still overweights inflation vs. growth risks from the oil shock has dramatically reduced the pricing of rate cuts, leaving the market ripe for a demand-destruction-induced reversal. We think investors will focus on three issues at the March FOMC.
Key takeaways
The market-implied trough fed funds rate now sits at 3.30%, about 43bp higher since the conflict in Iran began, implying less than 35bp of cuts for the cycle.
Forced position squaring in STIR left the Fed policy path detached from a reality in which the Fed “looks through” oil-driven inflation, as our economists expect.
Our economists expect the Fed to acknowledge the weak February jobs report by no longer indicating the labor market has “shown some signs of stabilization.”
Our economists have conviction the Fed won’t respond to an oil shock with hikes, or risks of hikes – keeping the distribution of the rate path skewed lower.
Bowman’s G-SIB surcharge speech unveils a revision to risk around short-term funding; this is supportive for dealer financing and bullish for UST spreads.
…We think investors will have little trouble shifting their focus to downside risks to growth, especially if forthcoming labor market data are weak — in advance of the negative outcomes our economists anticipate in the event of a protracted conflict that justify Fed easing.
Over the past two years, the movement of Treasury yields has been more closely linked with the direction of labor market — as opposed to inflation — surprises.
Exhibit 3: 2-month change in 10 Treasury yields alongside labor market surprises over the last two years
Exhibit 4: 2-month change in 10 Treasury yields alongside inflation surprises over the last two years
In Exhibit 3, we show the 2-month change in 10y Treasury yields alongside an index of labor market surprises, which measures the percent difference between the actual economic data release and median of economist forecasts.
For much of the past two years, the direction of the move in 10y Treasury yields was closely linked to the direction with which labor market data surprised relative to consensus economist expectations.
In Exhibit 4, we show the 2-month change in 10y Treasury yields alongside an index of inflation surprises, which measures the degree with which the median of economist forecasts over- / under-estimate inflation data releases.
Over the past two years, inflation market surprises have not been as closely linked to the direction of 10y Treasury yields.
We think three questions captivate investor focus going into the March FOMC meeting:
Whether the statement acknowledges recent weakness in the labor market;
How Chair Powell contextualizes the distribution of possible policy rate paths;
Whether the 2026 and 2027 dots continue to show further policy normalization…
Oil prices extend gains even as Iran reportedly considers letting some tankers through the Strait of Hormuz; soft US PCE inflation but strong job openings; US administration continues probe into Powell; weak Canadian employment data; soft UK GDP; DXY at 100.4 (+0.6%); US 10y at 4.28 (+1.6bp).
…On net, the US economic data today show a soft start to the first quarter. January core PCE comes in at 0.36% m/m, below our economists’ and consensus expectations (C: 0.4%) but still firm. The downside surprise appears largely methodological, driven by a change in the calculation of legal services PCE. Our economists still expect core PCE 3-month annualized to exceed 4% in February, but begin to decelerate afterwards, leaving the door open for the Fed to cut rates.
US rates twist-steepen, with the front end remaining well anchored (2y: -2bp) by economic data even as the long end underperforms. Front-end rates initially rally on the back of the somewhat soft PCE print, as well as a downward revision to 4Q GDP (0.7%; P: 1.4%) and weak durable goods orders (0%; C: 1.1%). However, the rally moderates after January JOLTS job openings come in strong at 6,946k (C: 6,750k), suggesting a stronger labor market than expected. As a result, market pricing for Fed cuts closes largely unchanged.
Inflation … don’t worry ‘bout it. TEMPORARY (as I get back from filling up some of the fleet at local Costco where prices are up a nickel — $3.27 — in past couple days) …
1Q inflation is coming in strong, as expected. We continue to believe core inflation will decelerate in the coming quarters. We maintain our call for 2 Fed cuts this year, but risks skew toward later cuts.
Key takeaways
If our forecasts are right, core PCE 3-month annualized inflation will be above the 4% mark in February.
But don’t over-react to that strength, core inflation will likely decelerate from 2Q on.
The tariff push should fade, and seasonality might have artificially boosted PCE inflation in 1Q.
The effect of oil shocks on core should be minor, and the Fed will likely look through the push to headline.
We see risks skewed towards later -and potentially more - cuts. The bar for hikes is high.
Exhibit 1: 1Q acceleration in core PCE, but we forecast deceleration ahead.
March 13, 2026 MS Federal Reserve Monitor: March FOMC Preview: Oil Shocks: The Fed’s Playbook Is Hold or Cut, Not Hike
We expect the Fed to remain on hold and retain its easing bias, with the median member still projecting one cut this year and one cut next. The oil price shock should mean higher headline inflation forecasts, but models and past Fedspeak suggest the Fed will look through energy price pressures.
Key expectations
We expect the Fed to stay on hold in March while retaining forward guidance that it looks to cut rates by 25bp this year and 25bp next year to a terminal rate of 3.0-3.25%. We expect 3 dissents for a cut.
We expect the updated projections to show higher headline inflation, softer growth, but an unchanged “dot plot.” If so, we believe the Fed is prepared to “look through” oil-induced inflation.
The key question is how the Fed will respond to an oil price shock. We have high conviction that the Fed will not respond with rate hikes, or risks of rate hikes. Appropriate policy calls for the Fed to “look through” energy price pressures at the headline and stay on hold or cut rates if activity weakens.
Our rates strategists suggest investors maintain a neutral stance on US Treasury duration and curve, stay long 2y UST SOFR swap spreads, and stay received June FOMC OIS.
Our FX strategists see downside risks to the USD as Chair Powell may look through energy-driven inflation, but expect oil market developments to play a central role in FX markets. De-escalation in the Middle East could trigger a EUR/USD squeeze higher given stretched EUR short positioning.
Our agency strategists are focused on any comments regarding regulatory reform, preferring to own agency MBS to corporate credit for indexed investors.
HOLD long (10s, tgt 3.80 STOP 4.35%) … do NOT fade the move … YET …
13 March 2026 UBS Global Strategy Rates Map - Not fading yet: Delayed fed cuts and Italy pain
Fed cuts as 2027 story - SOFR Z6Z7 flattens further We think that the market will continue to delay expectations of Fed cuts, and open a SOFR Z6Z7 flattener targeting 40 bps of cuts in 2027 with a stop at 5 bps (currently 18 bps of Fed cuts priced for 2027). This trade has moved a lot but we think can go further in case of, e.g., a relatively hawkish FOMC next week.
The sell-off in US Treasuries was also about long positioning ahead of the Iran conflict, something also confirmed meeting clients in NY this week. But attitudes on the Fed are also shifting. Many clients think that incoming chair Warsh could struggle to reach a consensus at the FOMC in favour of 2026 rate cuts given unemployment at current levels and both CPI and PCE prints running above 3%. UBS projects that inflation rates will peak in the second quarter of this year with headline CPI inflation around 3.4% and core CPI inflation around 2.9%.
There was some debate on Fed communication potentially moving to a focus on an inflation measure ex tariffs but this was far from consensus. Similar to discussions in London, clients remain divided on how much lower rents on new leases could support disinflation.
US growth can take a hit - American exceptionalism 2.0 Consensus with clients in NY was that the US economy was likely to withstand any prolonged increase in energy prices better, with risks of a larger growth relapse in Europe. The uncertainties posed by physical constraints in energy supply were seen as potentially macro relevant but several clients pointed to the previously expected growth bump in the first half of this year on the tax refunds as providing a buffer.
US duration and SOFR spreads under fiscal clouds We have been constructive US 10y in the past year but have moved closer to our stop of 4.35%. We continue to believe that duration-adjusted US supply will be manageable in 2026 but keep an open mind on fiscal pressures from a prolonged military conflict with Iran. Clients were divided on the likelihood of the Trump administration passing a bill to cover extra defense spending through Congress, but numbers circulating were around ~$70-90 bn. There is also risk of a loss in tariff revenues but ~0.2pp of GDP in higher revenues estimates from the CBO for 2027-28 were seen as reasonable. We do think that the case for some bull flattening of the US curve remains if equity markets struggle further and the shock from oil prices settlesoth 2yand10 USyields gnralyf onsharp detiorans ketimn, butVIXhas bentradig levsbow 30.Wekly changes i2yand10 USTyields acrovius egmnwks hetVIXmoved higr. We closed our longs US 30y vs SOFR swaps at 70 bps on 16 Feb '26 (currently: 82 bps), but long spreads has also been a pain trade in the duration sell-off. For now, we would wait to go long spreads again.
Economic Comment: this is not 2022 A few FOMC participants have recalled their memory of 2022, and that summer's oil price spike. In 2022, nonfarm payroll employment expanded an average 377K jobs per month. Households had abundant liquid assets. The unemployment rate was low and still peeling lower. Now, households have much less liquid balance sheets. The unemployment rate is almost 1 pp higher. In 2025, nonfarm payroll employment expanded just 10K a month. To echo former Treasury Secretary Lloyd Benson, this is no 2022…
…March FOMC meeting preview: median still expects a cut this year We expect no change in the stance of monetary policy at the March FOMC meeting. We project the median FOMC participant would still assume that one 25 bp rate cut this year is appropriate. We expect Chair Powell to be fairly non-committal about the policy outlook. He's much more likely to stress the uncertainty over even the near term outlook than offer something close to guidance about the path ahead. We expect him to acknowledge the inflation risks from an energy price shock, but remain balanced in conveying the risks. The vulnerable labor market faces more downside risks too, even as energy prices may point to higher headline inflation ahead…
Maintaining call for now — 2 cuts (June, SEP). AND a look back at some of data …
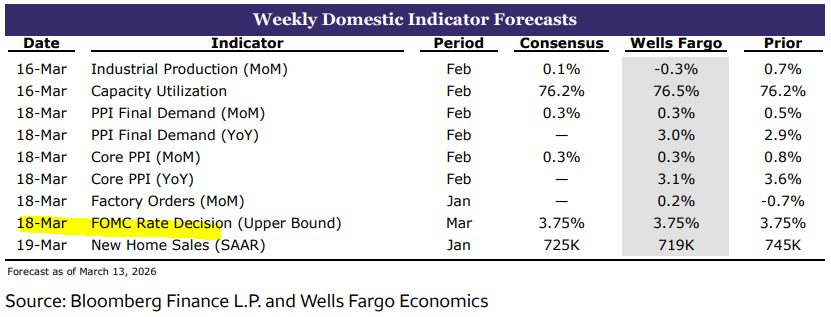
March 13, 2026 Wells Fargo: U.S. Weekly Economic & Financial Commentary
…FOMC Stagflation risks have increased since January, putting the FOMC’s dual mandate in tension. Volatile energy prices tied to the Iran conflict have induced uncertainty, but the net signal from recent data is little changed: the labor market is still muddling along, and PCE inflation remains stuck near 3%. We expect the Committee to hold rates steady next week and lean heavily on optionality, emphasizing that higher uncertainty argues for a data-dependent approach.
The Summary of Economic Projections (SEP) should tilt modestly in a stagflationary direction, with higher inflation forecasts extending into 2027, and slightly lower GDP projections and modestly higher unemployment rate expectations for 2026. We expect the median dot for the federal funds rate to remain unchanged, as the risks of higher inflation and lower growth are likely to offset each other. Our forecast continues to call for two 25 bps cuts in June and September, alongside a well-telegraphed slowdown in balance sheet runoff that should have minimal impact on longer-term interest rates.
March 13, 2026 Wells Fargo: Signs of Caution in January Consumer Spending Even Ahead of Iran Conflict
The January personal income and spending data feel even more dated in the wake of the ongoing conflict in Iran. Consumer spending momentum continued at the start of the year, but a modest pullback in discretionary services categories of spending signals some signs of caution among consumers, even ahead of the recent oil-price shock.
Strong growth in wages & salaries in January was an encouraging sign, and together with the annual social security cost-of-living adjustment, helped propel real disposable income growth, or purchasing power of households, to grow at the fastest monthly pace in about three years.
The modest 0.1% gain in real spending combined with some modest downward revisions to Q4 real personal consumption expenditures growth suggests real spending is tracking at a slower annualized clip (~1.5%) than we currently have forecast (1.9%) in Q1.
Consumer inflation remained contained at the start of the year. But the ongoing conflict in Iran is likely to dent households’ purchasing power in coming months amid higher gasoline prices, and we’ve marked down our consumer spending forecast in our recent update as a result.
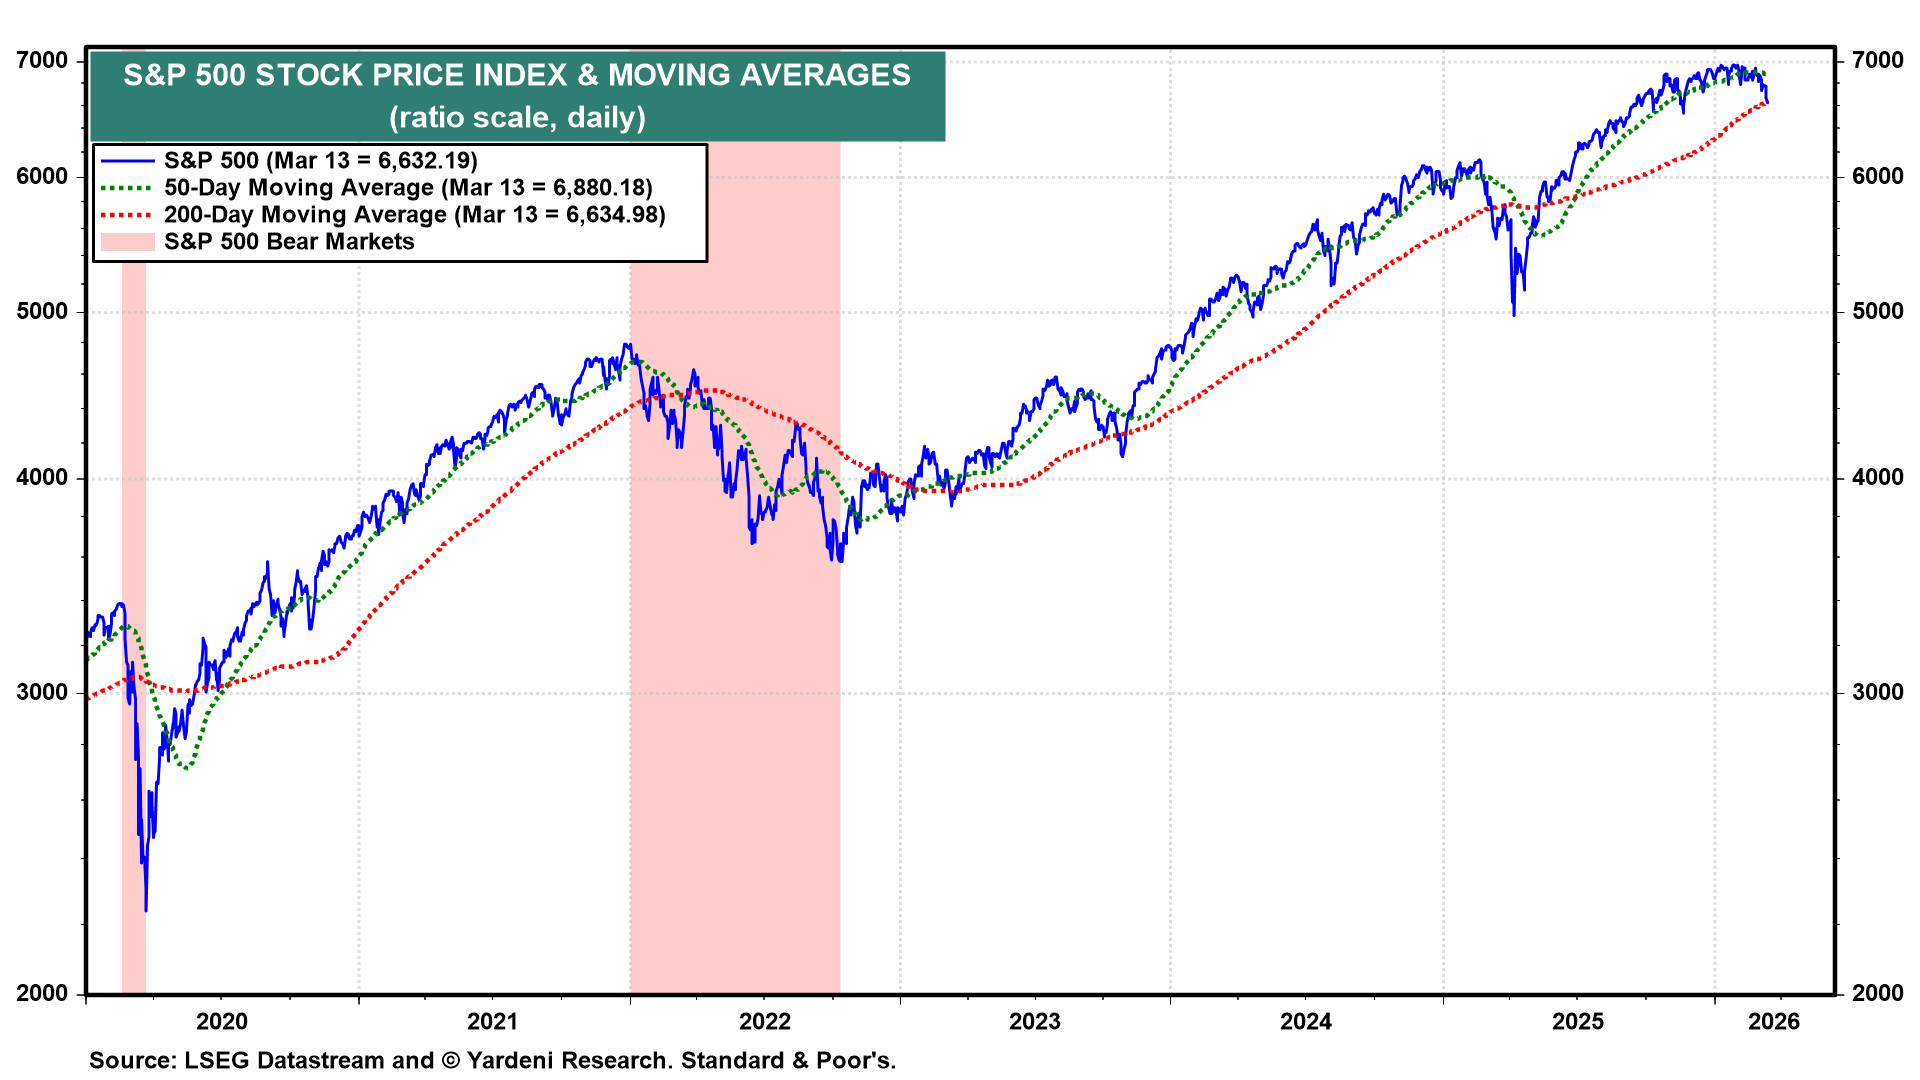
Why has the stock market held up so well since the start of the war? The S&P 500 is down only 4.96% from its record high on January 27 and 3.59% since the start of the war on February 28 (chart). It fell to its 200-day moving average on Friday and held it. The obvious explanation is that the market is discounting a short war. That was our initial assessment, but three days after the war began, we concluded it might last longer, leading to a 10%-15% correction, and warned that we could not rule out a bear market…
…Despite soaring oil prices and the closing of the Strait of Hormuz, recession fears seem more muted now than they were in 2022. We raised our odds of a recession from 20% to 35% a few days after the war started, when we concluded it might be longer than widely expected. More recently, we’ve become concerned that a weakening US economy might exacerbate the cracks in the US private credit market.
The apparent resilience in the S&P 500 is attributable to the increasing bullishness of industry analysts’ consensus estimates for earnings per share in 2026 and 2027 (chart). Apparently, they did not get the memo about the possible negative consequences of a protracted war and closure of the Strait. So S&P 500 companies’ aggregate forward earnings rose to a record high last week of $328.80 per share. At Friday’s close, that implied a forward P/E of 20.2, which is down from 22.0 on January 27. The 1.8% increase in forward earnings per share offset some of the 6.8% decline in the valuation multiple, resulting in the 5.0% decline in the S&P 500…
… Moving along TO a few other curated links from the intertubes. I HOPE you’ll find them as funTERtaining (dare I say useful) as I do …
Terminal DOT COM …
March 13, 2026 Bloomberg: BofA’s Hartnett Warns Markets Starting to Look Like 2008
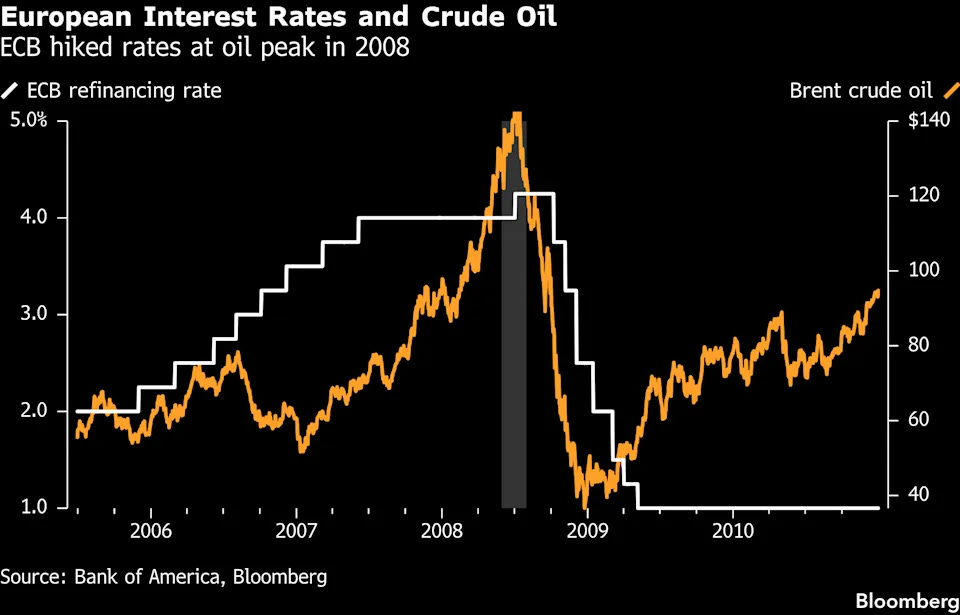
(Bloomberg) -- The spike in oil prices and growing concerns around private credit are causing market activity to resemble the lead-up to the global financial crisis, according to Bank of America’s Michael Hartnett.
The strategist flagged how oil doubled to $140 a barrel by August 2008 from $70 in July 2007, accompanied by the start of the “subprime tremors” that engulfed the likes of Northern Rock and Bear Stearns. The Iran war that erupted Feb. 28 has pushed oil prices more than 60% higher this year.
“Asset performance in 2026 is more ominously close to price action seen from mid’07 to mid’08,” Hartnett said in a note. Wall Street is “ominously trading ‘07-’08 analog,” he added.
Worries are increasing around banks’ exposure to private credit, an asset class grappling with fund redemptions, scrutiny of underwriting standards and the impact of artificial intelligence on some borrowers. At the same time, soaring energy costs caused by the Iran war are driving fears of stagflation, where increasing price pressures force central banks to raise interest rates, just as economic growth stalls.
The Middle East conflict and its impact on inflation risk pushing the European Central Bank to raise interest rates sooner than anticipated, Governing Council member Peter Kazimir said earlier this week…
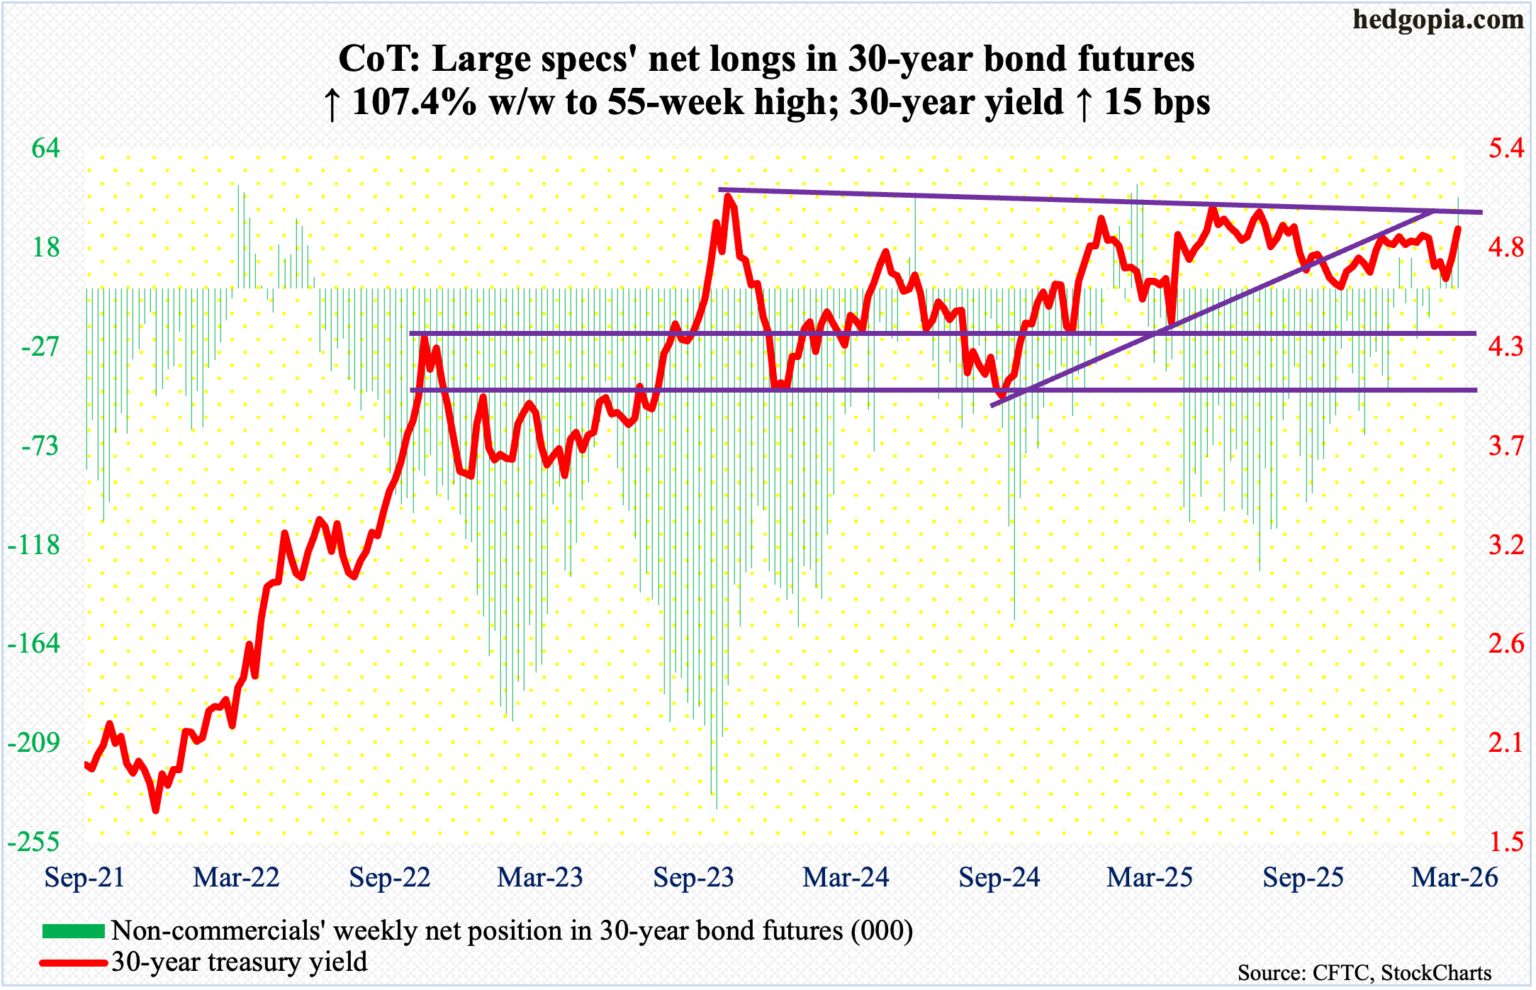
POSITIONS matter, even those of the ‘evil speculators’ who apparently have decided to BUY BONDS …
14 MAR 2026 Hedgopia CoT: Peek Into Future Through Futures, How Hedge Funds Are Positioned
13 Mar, 06:10 NORDEAMacro & Markets Forecast Edition - from expecting cuts to duscussing hikes
The potential energy shock we are facing is challenging for central banks. Still early days of the situation, but risks are rising.
Chances of a cut from Fed is fading – hiking could become appropriate, but not popular
We have for quite a while been arguing for no more cuts from the Fed. Seems like we could be right for the wrong reasons. Even if we still struggle to see much weakness in the us labour market, it is the potential energy crisis that is the most important driver right now. On the other hand; it matters what kind of environment such an impulse is received in. Our forecasts now do not assume a full blown energy crisis, but we try to elaborate on the consequences of one.
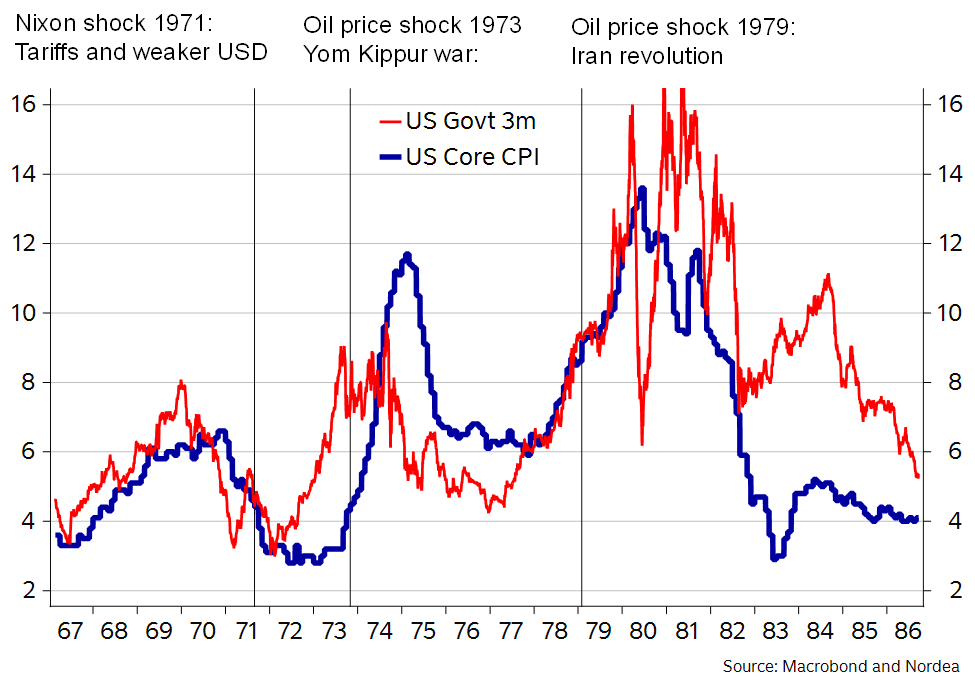
The gas crisis in Europe in 2022 is probably the most relevant example for implications of an energy crisis these days, but comparing the situation in the US today with the one in the seventies may also shed some light on what we are up against. According to FederalReserveHistory.org these were the reasons why inflation in the sixties and seventies became such a big problem:
Large budget deficits to finance the Vietnam war, the cold war and social reforms like Medicare and Medicaid
Too low interest rates often due to interference from politicians (Fed was not independent)
The Nixon Shock in 1971 trying to regain American competitiveness and reduce the trade deficit:
Import tariffs of 10%
Broke the gold standard to weaken the USD which eventually led to the breakdown of the Bretton Woods system
Energy shock 1 - 1973: Yom Kippur war reduced oil supply by 7% for 6 months
Energy shock 2 - 1979: Iranian Revolution reduced oil supply by 5% for 2 years
When going through these bullet points it is hard not to see the resemblance with today’s situation. The potential energy crisis we are facing is only a small part of this picture. It is also very true that wages in the seventies were to a larger extend indexed to prices so wage/price spirals were more likely back then compared to now. Energy intensity was also much higher so impulse on prices from energy was higher than today. On the other hand; that should also mean that growth would take a larger beating from high oil prices than they would today. Perhaps it even means that oil prices today need to rise more than they did back then to take out enough demand.
This situation could be challenging for today’s version of Fed; balancing higher unemployment with higher inflation is never easy. The cuts that Warsh has promised to deliver will probably be even harder. The lessons learned in the seventies will probably make quite a few FOMC-members argue for hikes, but given the potential for higher unemployment some might also draw the same conclusion as many did back then and try to induce as little pain as possible. In the seventies core inflation topped out above 13% and interest rates peaked at 17%. Neither we nor the market is implying such an outcome, but the risk of such an extreme is now higher than before and perhaps the probability should be seen as higher than what the market is pricing in.
The stagflationary impulse this potentially is could also be met by stimulus from the government to ease the pain inflicted on consumers. The downturn it produces is likely to increase the, already too high, budget deficits in the US. It seems likely that bond investors will demand higher interest rates to meet record high supply and increasing inflation. We already see quite some pressure from the supply side in the bond markets and have for quite a while been arguing for the upside in long end bond yields.
…Vanguard’s How America Saves 2025 report shows that hardship withdrawal activity “increased to a new high” of 6% in 2025, up from 4.8% in 2024 and about 2% before the pandemic.
The increase marks the sixth straight annual rise since Congress eased the rules in 2018 by removing the requirement that participants first take a 401(k) loan. Vanguard said the median hardship withdrawal was about $1,900 for avoiding foreclosure or eviction (36%), paying medical expenses (31%), and covering tuition (13%)…
… AND for any / all (still)interested in trying to plan your trades and trade your plans in / around FUNduhMENTALs, here are a couple economic calendars and LINKS I used when I was closer to and IN ‘the game’.


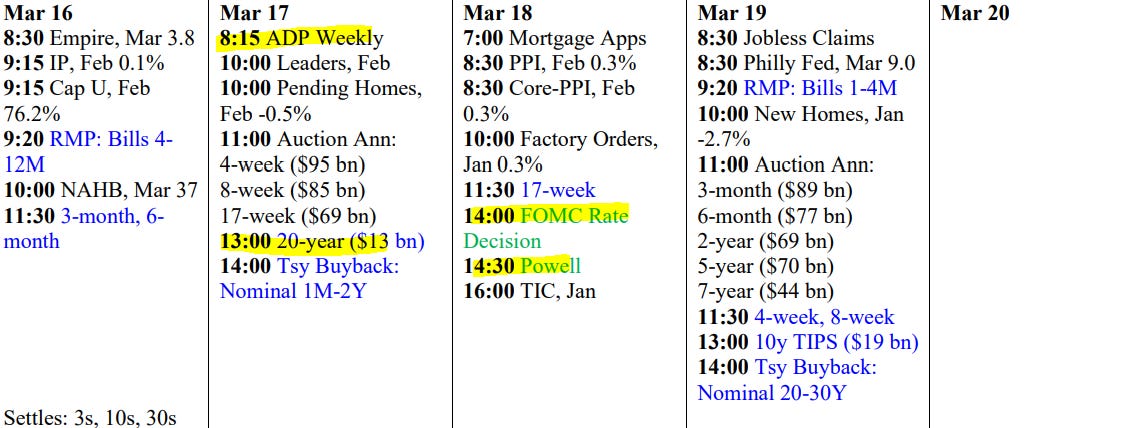