weekly closes; 2s5s 'red alert'; sellside observations and the week ahead (a few)calendar(s) of events
Good afternoon.
On this solemn anniversary of the original WTC attack back in 1993, as we pause to remember our past, study that history and adapt to our current historical chapter (thoughts and prayers to all those impacted at THIS moment), hopeful we aren’t doomed to repeat the evils of our ways.
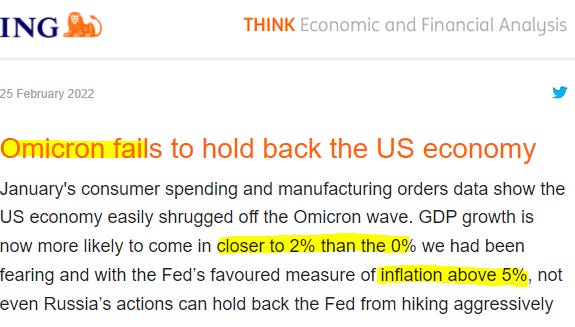
In light of yesterday’s stellar data (puttin the FUN in funDUHmentals AND markets), this from ING summarizes it best, Omicron NOMICRON …
HERE for more
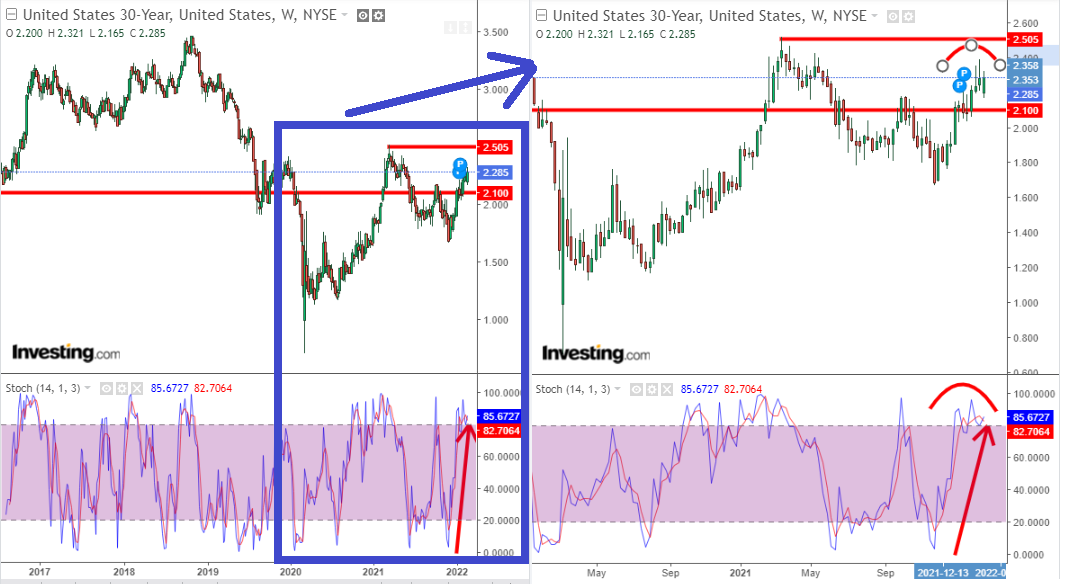
I’d like to begin with a simple weekly chart of 30yy given what has been reported as ‘still-challenging liquidity’ conditions (at least o/n)
It seems to ME that we’re in middle of a range — call it 2.50 and — wait for it — 2.10% which then would put us now @ 2.30% or so, well, smack dab in the MIDDLE.
With the above WEEKLY visual in mind, it DOES appear that momentum about to turn in favor OF the bond market and this will be disturbing to ALL the haters who are simply always gonna hate.
Clearly this moment in history has many sources of input which combine to create price action (and opportunity) and you don’t need me to list them here.
And I know more than a few who’ve capitalized on the past (couple)weeks of vol in rates markets…Well done, I say.
I WILL say that high and rising energy costs of this moment are not solely due to Russia / Ukraine tensions. I’ll note as a student of more recent / modern financial markets history, when the Fed takes it upon themselves to tighten / hike / quantitatively reduce it’s balance sheet (commonly referred to as ‘taking the punch bowl away’), something breaks. Always has. Likely always will (until such a time we completely overhaul the system and go full block chain).
Nothing happens without a consequence.
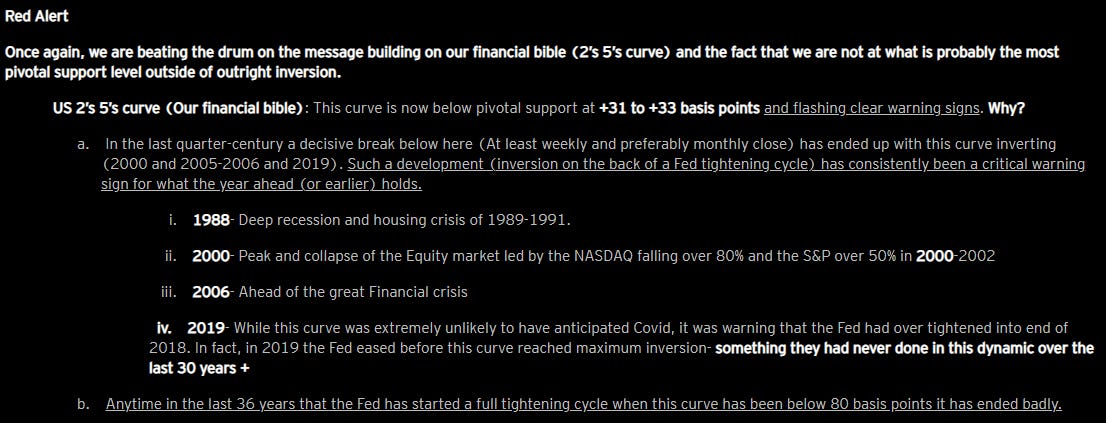
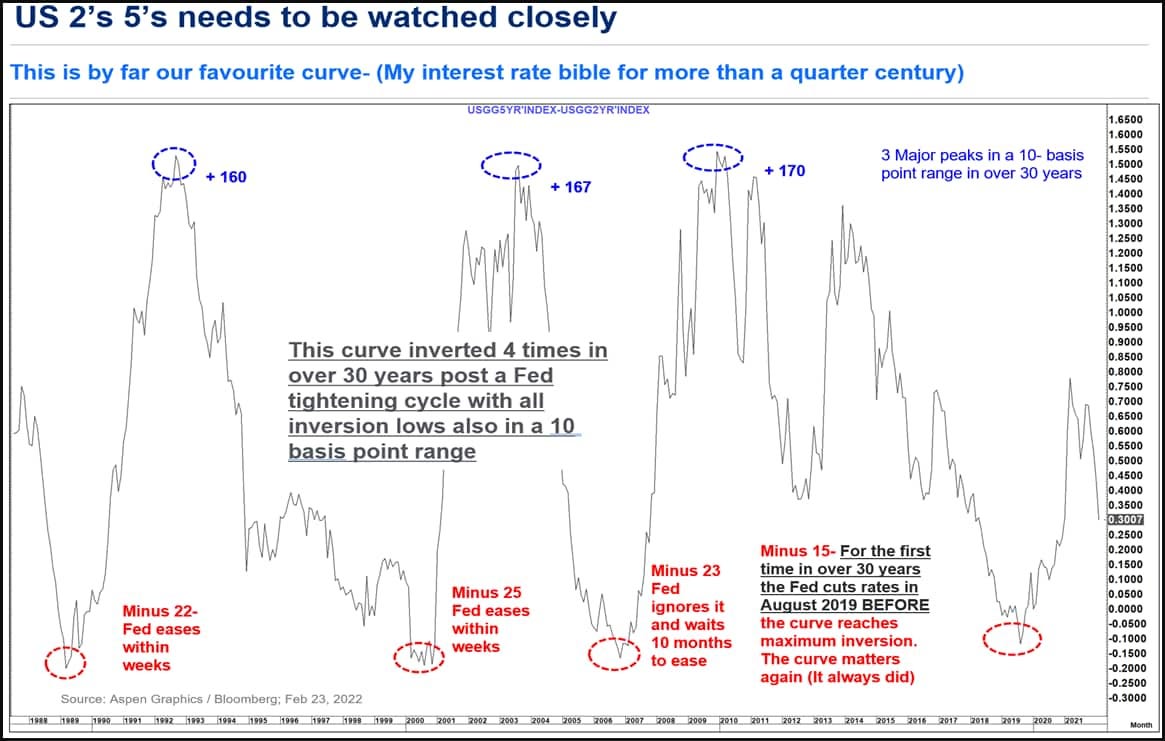
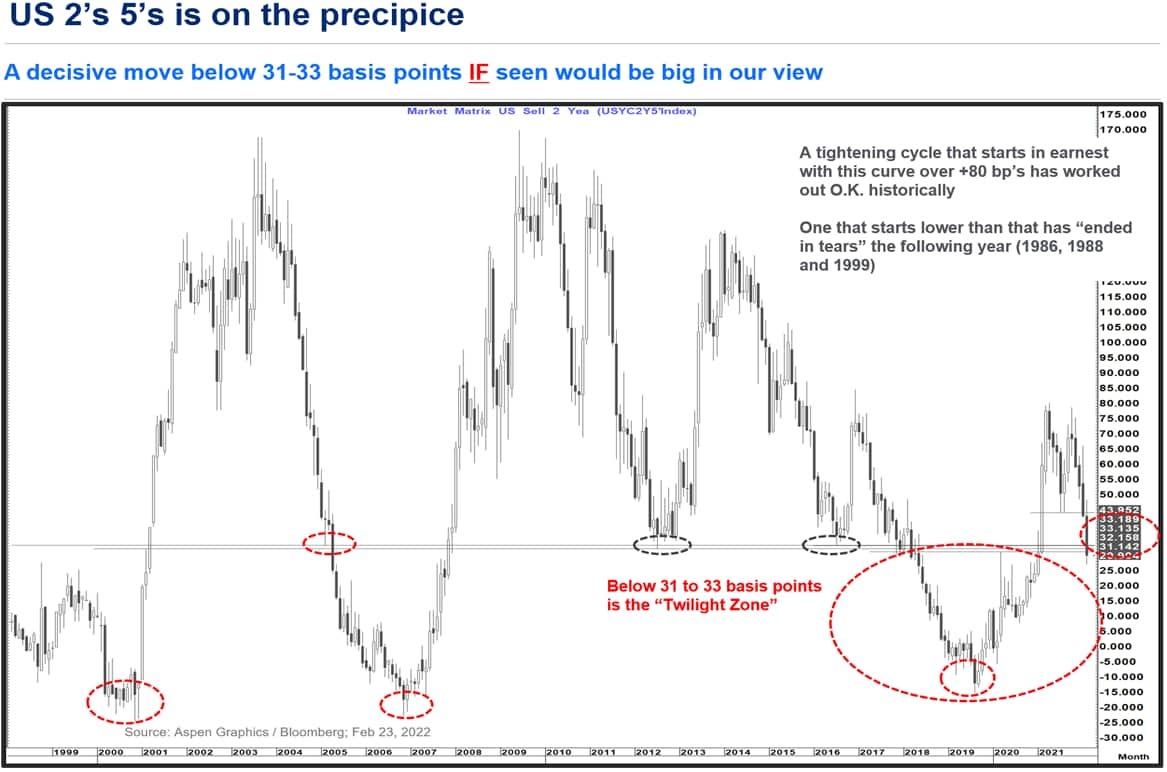
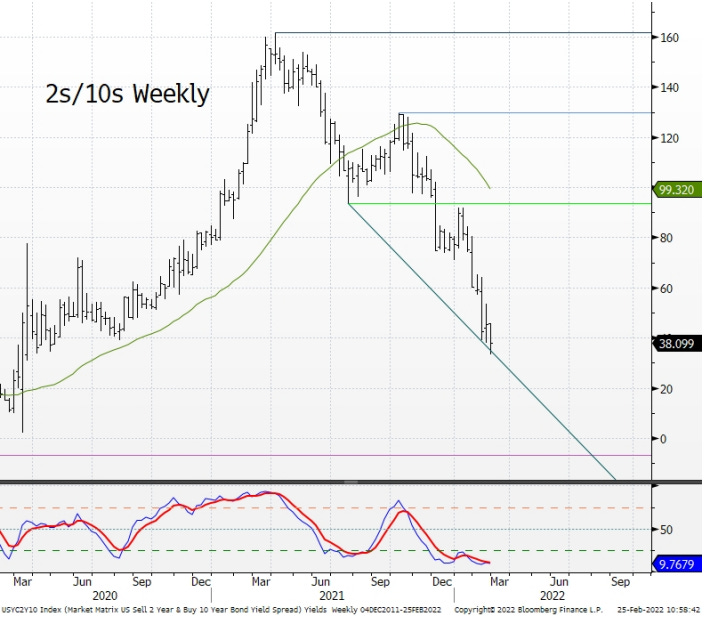
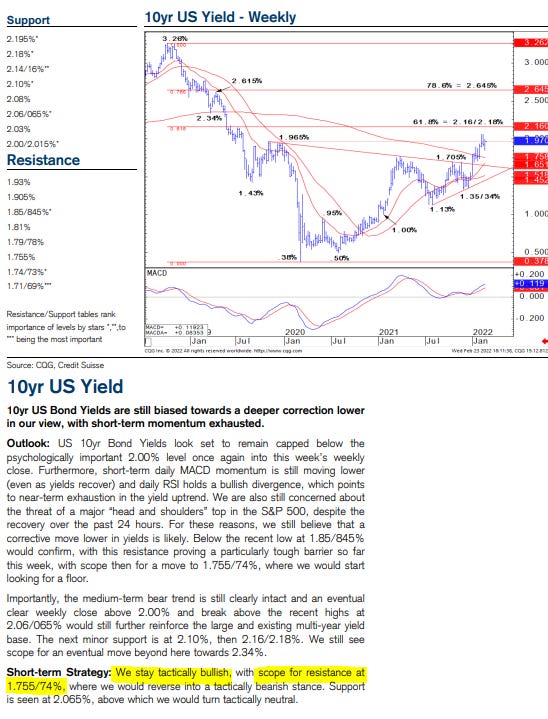
For somewhat MORE informed view on rates with a keen sense of TECHAMENTALS, this from a large, bulgebracket US bank (and author of what happened while we slept) … a RED ALERT of sorts,
Read thru the note and again lets hope / watch / LEARN from history of this specific interest rate bible,
WHICH … is starting to sound alarm bells
And a LESS (or more)informed view of rates, this from ‘All Star Charts’ askin,
…The US Aggregate Bond ETF $AGG is down more than 4% year-to-date. Treasuries can’t manage to catch a bid. And High Yield Bonds $HYG have fallen off a cliff.
But this could all change quickly. Especially if stocks continue to sell off.
Money has to go somewhere as it flows out of equities. And with many bonds testing critical levels, it would make sense to see prices mean revert, at least in the near term.
Let’s take a trip around the bond market and discuss some of the key levels on our radar.
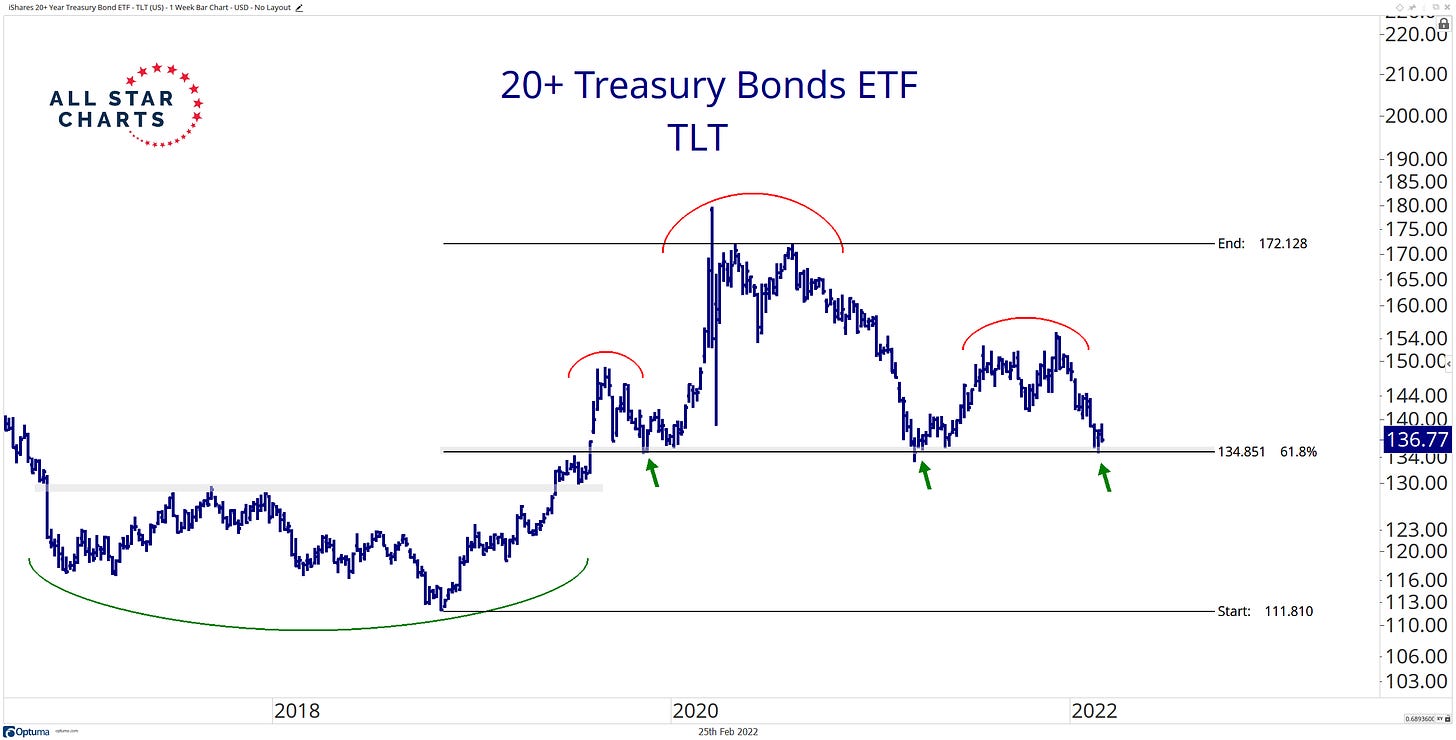
First up is the long duration Treasury Bond ETF $TLT:
After dropping 5.4% in the last three months, TLT has paused at a logical area of former support ~135. This the same level price rebounded from late 2019 and early 2021.
The last time TLT bounced off these levels was when many risk assets peaked back in May of last year. We’re watching to see if we get a similar reaction from markets this time around.
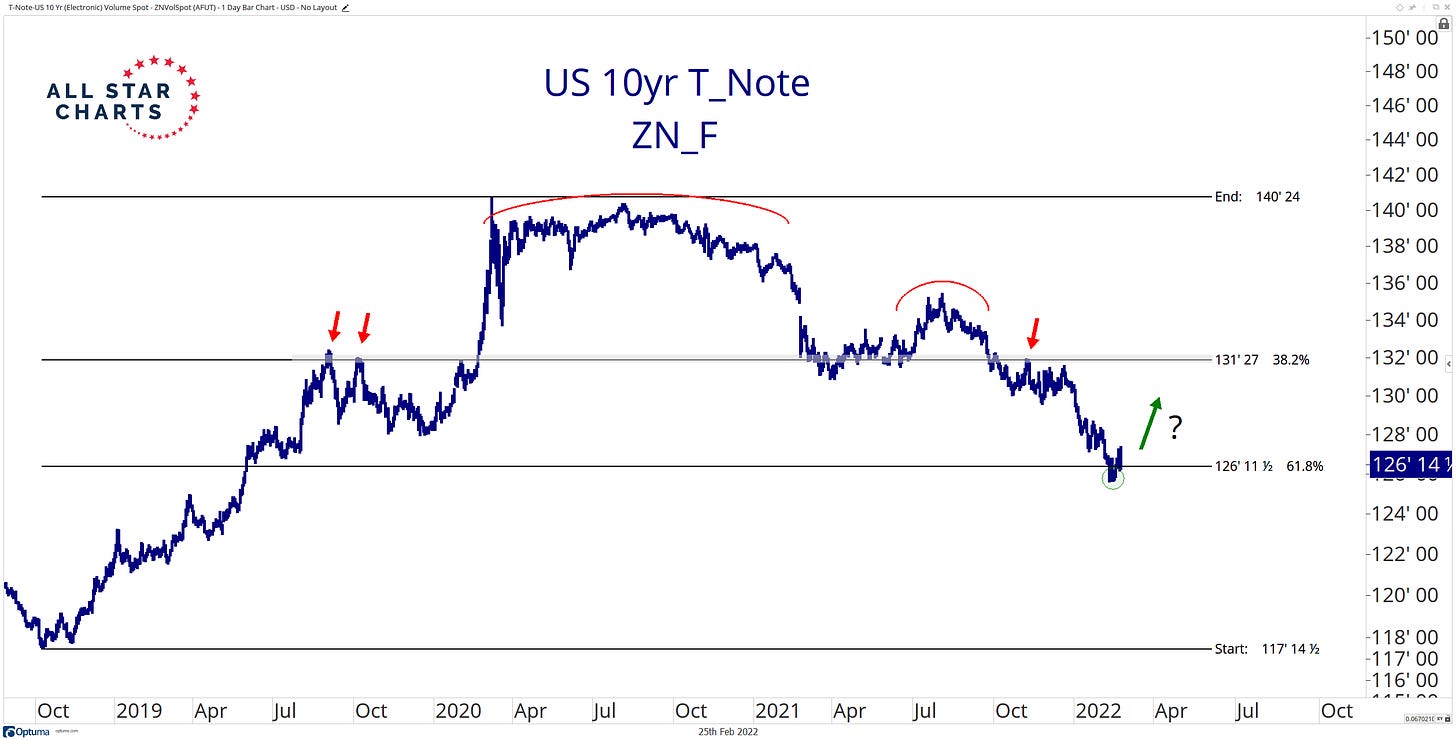
When we move down the curve, the 10-year T-note is also finding support at a logical level.
… Regardless of duration or credit rating – bonds have reached a point where we no longer want to press shorts. We’re much better served to feed the ducks at these levels.
For now, we want to take some money off the table and wait for the trend to either resume or reverse.
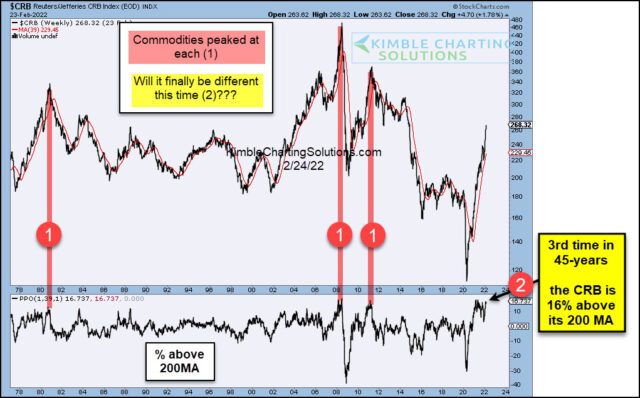
I’d ALSO add that as ‘Earl goes, so goes, well yields, breaks, expectations for inflation, fears, anxiety and all else I’ve forgotten so … with idea being in price there is truth and expanding a bit beyond just ‘Earl, well, this:
Commodity Price Index Near Most Overbought Level In 45 Years!
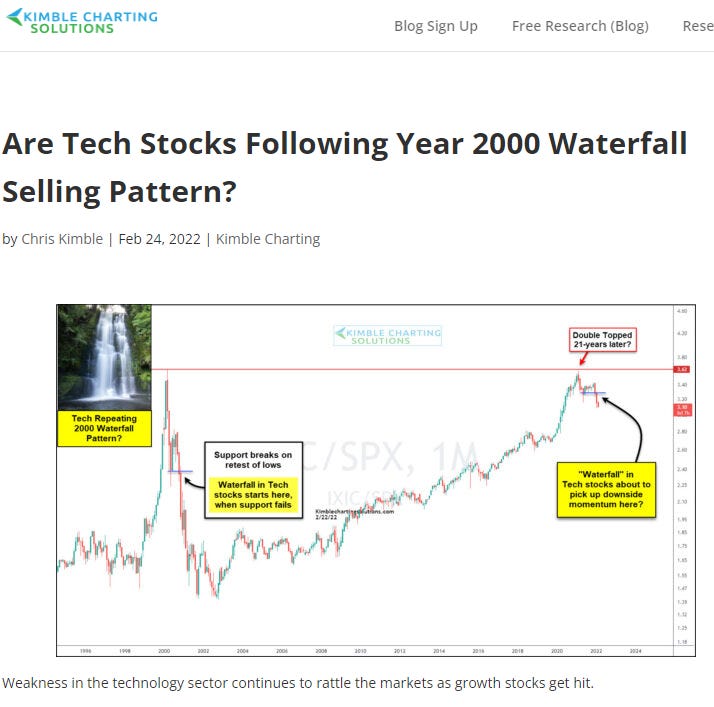
Idea here being that while ‘Earl is of utmost important, lets not forget about the REST of the commods complex and if/when there is any sort of signal (signs of relief?) just ahead where things about to turn, we’ll ALL want to know. Kimble chart helpful on that from, IMO (which you didn’t ask for.
For MORE from Chris Kimble specifically on TECH STOCKS, well
On to just a few, handpicked, curated and insightful sellside observations, then.
A large Canadian operation — and home of the best in the biz (as per IIs annual popularity contest and ritual) — is BMO’s weekly (Assume, Reality, Revise) thoughts and musings ALWAYS the place to begin, suggesting they’ll maintain FLATTENING BIAS and that maybe, just maybe the front end where it needs to be (hawkishly speaking/pricing) before March FOMC.
The shop booked profits on long 10yy and for new trade this week is lookin’ to ‘join a flattening move in 2s/10s beyond this week’s recently established flat at 33.4 bp…’
In ENGLISH, thru 33bps, get yer flattener groove ON, tgt 25bps
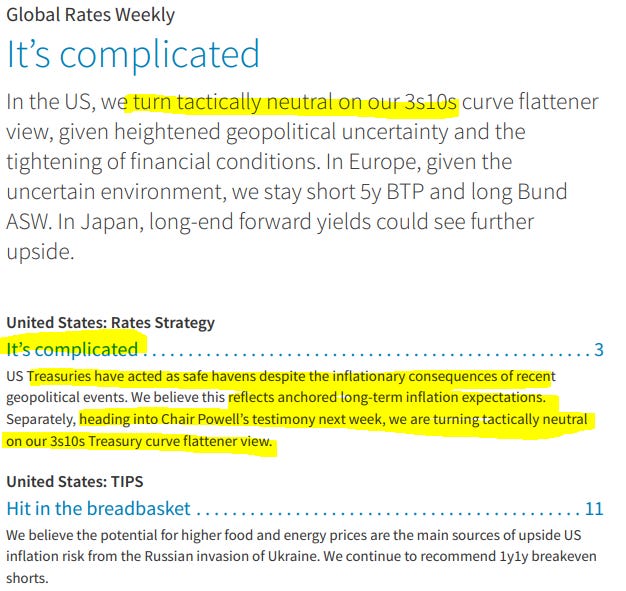
Continuing along in alphabetical order, sorta, from a large British operation
AND … reminding us all it’s NEVER bad idea to put some hay in the barn,
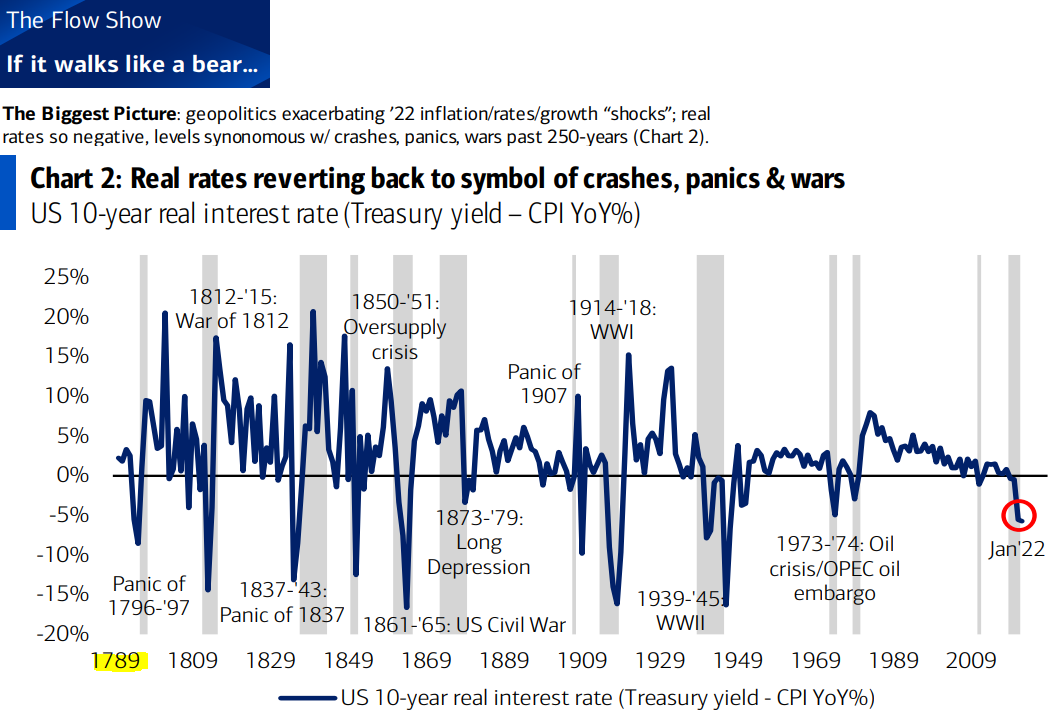
From everyone’s favorite bank (at least from the USA) and who’s known for visuals of rates going back several hundred (sometime thousands) of years (and I’ve doctored this up just a bit to get TO the rates point…)
Here and from the ‘artist formerly known as 1stBOS’, is this one which SHOULD make one / all feel better.
US growth well insulated from a global energy shock
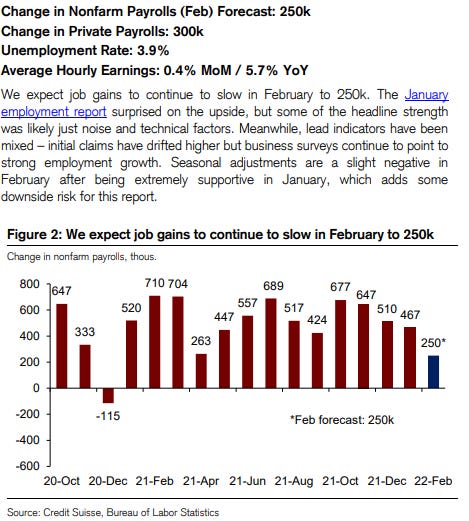
Let me know if how minimal our trade is with Russia, you know, helps ease the pain when yer fillin’ up your gas tank or grocery cart this weekend. Be that is it may, same operation with a look ahead at this weeks NFP
Spot a trend? As a side-note, this same firm technically staying neutral 5yy and 30yy while remaining LONG 10s
Moving right along, a large GERMAN bank offered a couple of interesting items into the weekend…
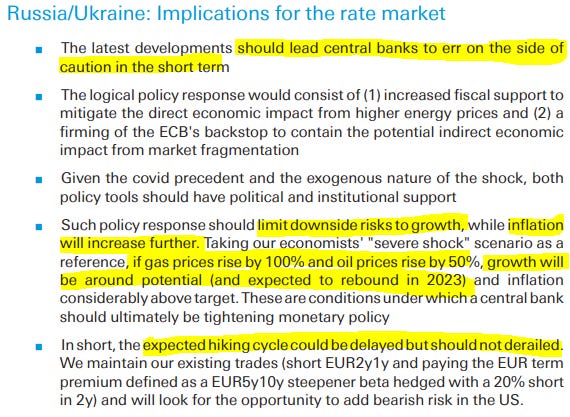
Bond Market Strat, Russia/Ukraine: Implications for the rate market
FULL. STOP. Let that sink in … severe shock scenario and growth will be around POTENTIAL and rebound? Imagine if you will, gas prices (already high) and well, you know, the price of THINGS were to continue their ascent. Unless, of course, you are going to get a … 30% (temporary) pay RAISE, it seems to my (no longer even remotely professional)eyes to defy logic that growth will be ‘round potential and rebound next year.
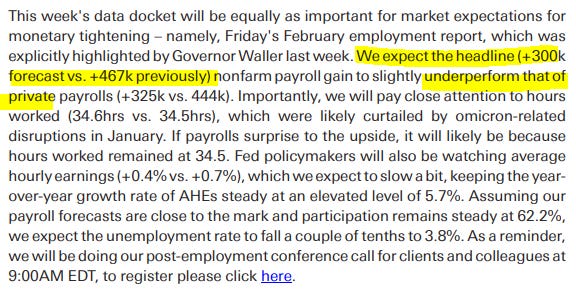
In a word, delusional. HOPE is not a strategy…but my views aside, same large German bank views on this weeks coming NFP
You’ll ALSO note, Investor Positioning and Flows: Is Geopolitical Risk Priced In?
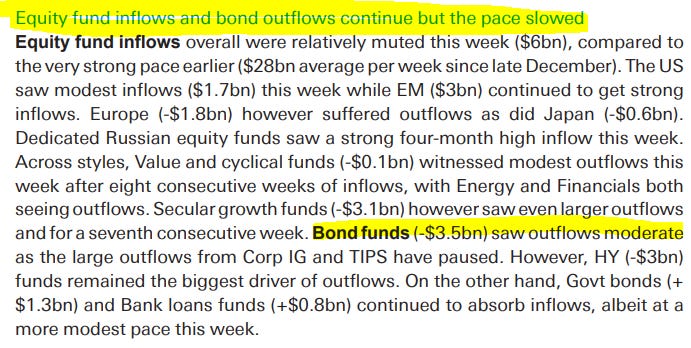
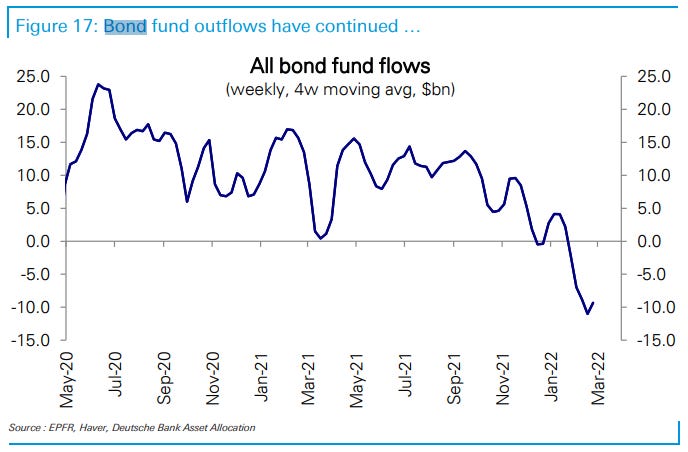
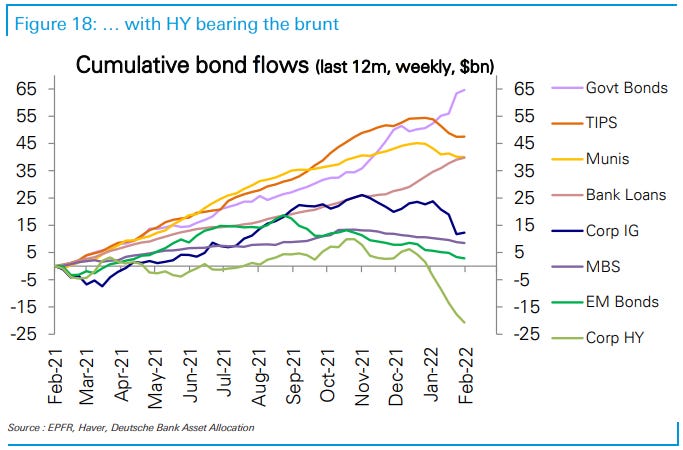
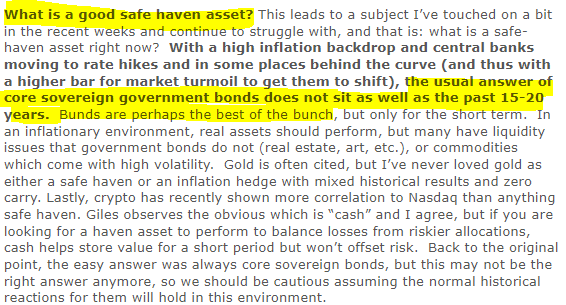
One large British bank weekly thematic review looking for alternatives and places to hide, if you will, repeats a most common refrain. Sov bonds simply aren’t what they used to be.
BUNDS? Last I checked (BBG) 10y Germany yielding 23bps … Cash, they say, maybe, but it doesn’t offer any offset to loss of capital only a store of value.
Free Willy, anyone?
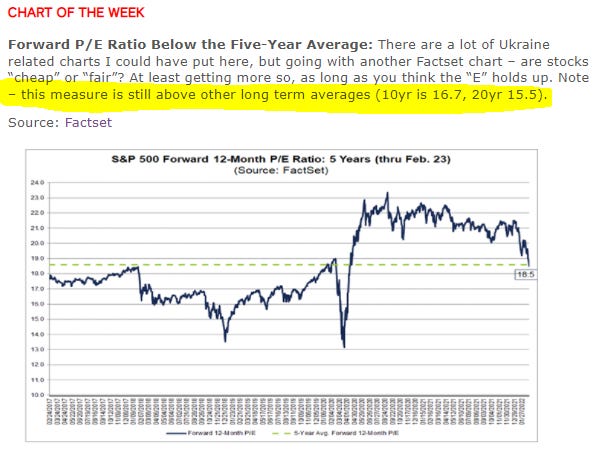
That large British bank weekly thematic review goes on to offer an interesting chart of the week — STOCKS in P/E form via Factset,
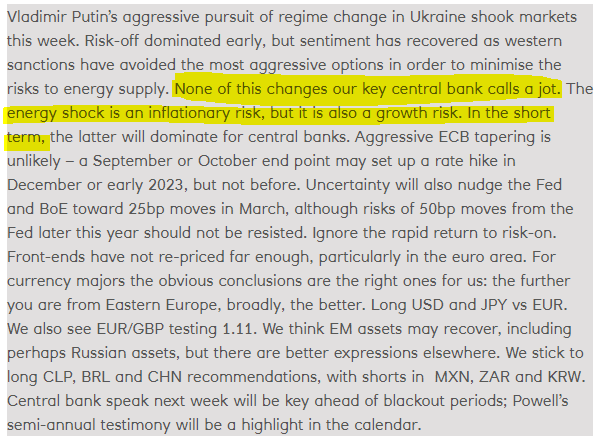
Pick your poison, I suppose. Same outfit offered it’s global MACRO thoughts and again, it’s full steam ahead (damned the torpedoes') for CBs,
Central banks won’t be derailed by a Ukraine crisis
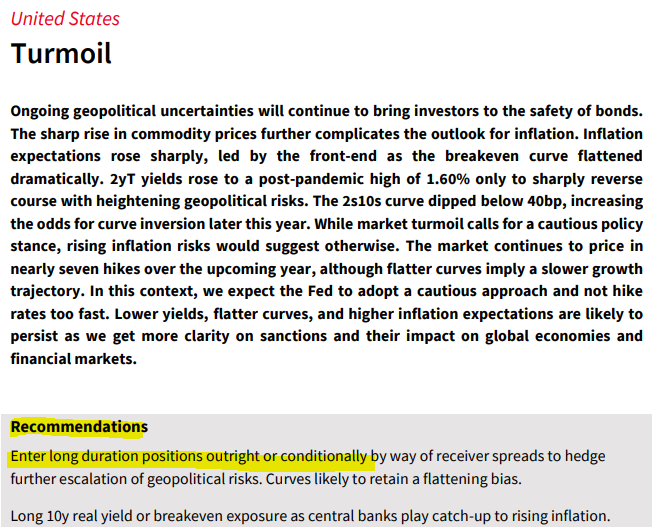
Last, but not least, is this snippet from one of the more exclusive sellside operations on Global Wall Street (and one with a French background), which provides something you really don’t see much if at all, these days …
Conditionally, enter a LONG DURATION? You gotta read it to believe it but there it is…
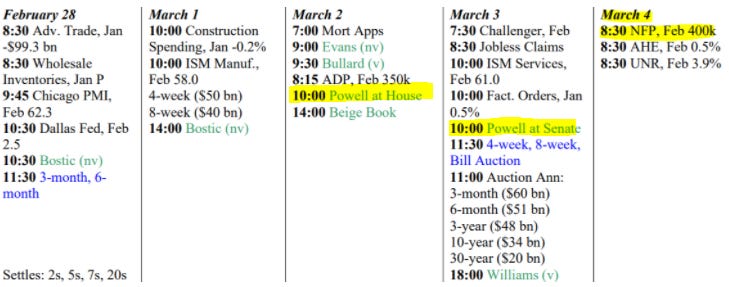
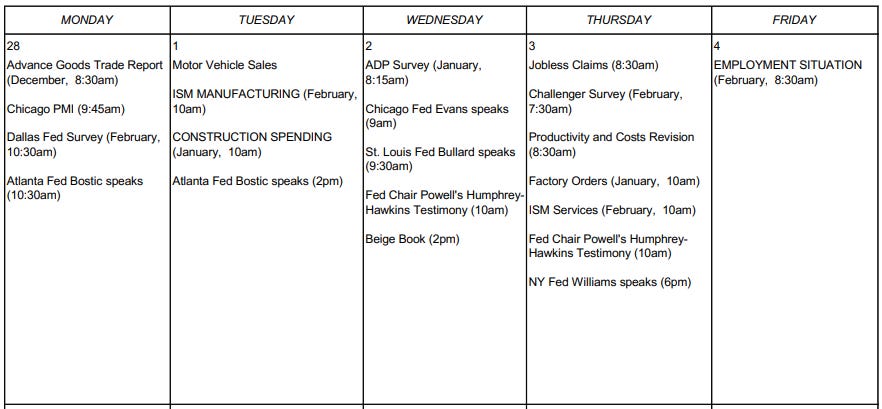
Finally, as I attempt to put this exhaustive post to bed, a few economic calendars I used to use when in a somewhat different seat.
First up is calendar I used to cut / paste into my daily 2pg PDF,
Here’s JEF’s calendar
…Then there’s this from Zentner’s MS
with some details of the firms NFP f’cast,
Employment Situation (Friday, 8:30am): Following a strong 467k beat in nonfarm payrolls in January, we forecast another strong month for jobs. Total nonfarm payrolls are expected to increase 730k in February, while private payrolls should increase 690k vs. 444k prior. We expect job gains to be most concentrated in sectors adversely impacted in January from Omicron, such as retail trade, leisure and hospitality, and transportation. An increase in the employment in line with nonfarm payrolls would imply a 8bp increase in the labor force participation rate to 62.3%, lowering the unemployment rate 30b to 3.7%. Average hourly earnings are forecasted to soften somewhat, in part driven by a reversal of the upside calendar bias in January. When the 15th of the month falls within the payrolls survey week (including 12th of the month) there is a 15-30bp upward bias that gets reversed out the following month. We forecast earnings increased 0.4%M, keeping the y/y at 5.7%. The average workweek should increase from 34.5 to 34.7.
… And from Wells (where again, NFP takes center stage Friday)
As always, EconOday links (among the best available and most useful IMO), GLOBALLY HERE and as far as US domestically (only) HERE …
Russia-Ukraine Headlines Trigger Market Volatility As Biden, Putin Plot Their Next Move!
THAT’S all for now.
Enjoy what ever is left of the weekend.
Until we ‘meet again’ and learn whatever it was we missed ‘while we slept’ … that’s all for now.


