('very respectable' UST volumes o/n) while WE slept; 5yy over 4.00%; Goldilocks CUTS S&P tgt by 16%; The Ice Age Is Over (Really); 10yy (monthly), 30yy (weekly)
Good morning … GS CUTS 2022 S&P target by 16%! Reuters,
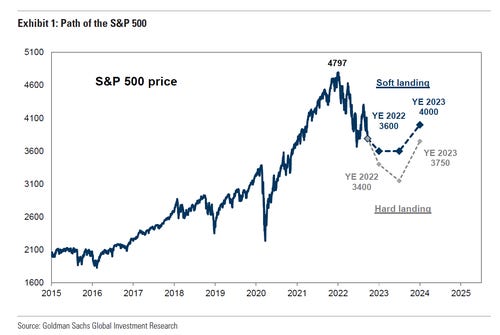
Sept 23 (Reuters) - Goldman Sachs has cut its year-end 2022 target for the benchmark S&P 500 (.SPX) index by about 16% to 3,600 points, as the U.S. Federal Reserve shows little signs of stepping back from its aggressive rate-hike stance.
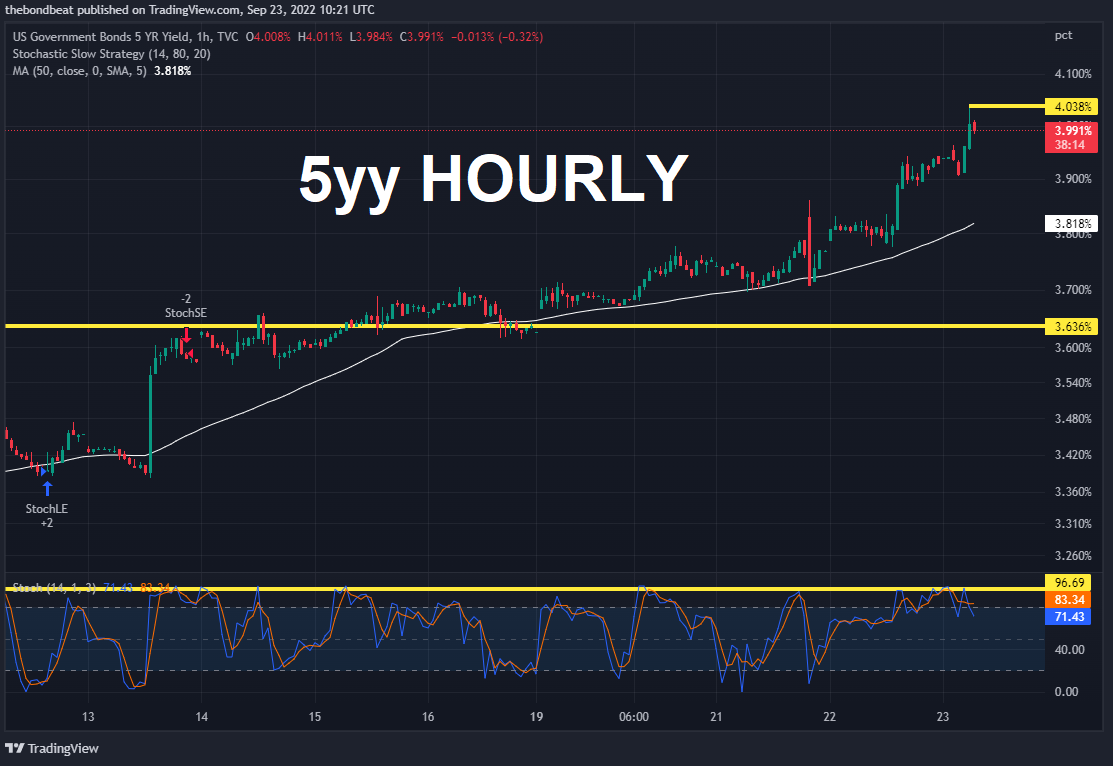
Looks like a call for a bottom … Guessing that we’ll be coming back to this one at a later date but for now … and hey, completely UNRELATED news, 5yy printed OVER 4% a short while ago
AND in a bit more (DAILY) context,
Yields continue to GRIND HIGHER and in this case, it’s my belief UST yields are following along GLOBAL yields and so … here is a snapshot OF USTs as of 705a:
… HEREis what this shop says be behind the price action overnight…
… WHILE YOU SLEPT Treasuries are notably lower and the curves generally flatter with an unprecedented sell-off in UK 5yrs (historic tax cuts just announced amid historic inflation) dragging most/all sovereign bond markets lower this morning. DXY is notably higher (+0.66%) while front WTI futures are sharply lower (-3.5%). Asian stocks were all lower, EU and UK share markets are 1.5% to 2% lower and ES futures are showing -1.3% here at 6:50am. Our overnight US rates flows saw overall flows quiet in the early going with Japan out. The curve bear flattened on limited flow until the UK market dumped on the UK mini budget reveal. Earlier better buying flipped to heavy selling on that announcement. Overnight Treasury volume was a very respectable 140% of average with Japan out.
… Leaning Indicators YoY%: We got the YoY decline we thought was a risk yesterday and, using a recession overlay, a YoY decline in LEI YOY has been a really reliable (but not perfect; see mid-90's) hint that it's time to start the recession countdown clock... The recent plunge and the levels look very 2007-like to this observer.
2yr real yields (inverted scale) and SPX: A two-scale alert may be warranted but, still, the divergence between reals and SPX is quite striking for sure. Could it be that this is a picture that spurred Jay to rip up his Jackson Hole speech and to deliver a short and clipped one instead? Jay in the car with his wife Elissa: "Honey, I'm trying to shift into third but I can't. I think we need to get the transmission checked..."
… and for some MORE of the news you can use » IGMs Press Picks for today (22 Sep) to help weed thru the noise (some of which can be found over here at Finviz).
We’ve reached that part of the programming where I’ll bring forward a couple / few things — sellside or widely available on the intertubes (ZH, etc) which, in my former institutional FI role, might have some funTERtainment value…
First up is this one from BBGs John Authers with a long-term look / thought on bonds
The downward trend in 10-year Treasury yields that has persisted ever since the Fed under Paul Volcker slew inflation is over. There have been false alarms before. Dig through the archives and you’ll find I wrote at very great length about what appeared to be the end of the trend during a bond selloff as long ago as 2007. But that market seizure triggered the credit crisis, which would bring Treasury yields to previously unimaginable lows. High inflation in 2022 will make that prohibitively difficult to repeat.
There are many ways to measure a trend, and I want to resist any temptation toward pseudo-scientific technical analysis. But on any sensible approach, the trend has been broken. If Jerome Powell and the Fed succeed as they hope, and replicate Volcker, then maybe they can start another downward wave. But that will be a new trend, not a resumption of this one.
The following chart (a screenshot from the terminal because I had problems with my graphic software, for which I apologize), shows various trend lines that might link the high points for the 10-year yield since Black Monday in 1987. Any version of theline has been breached. And critically, after a series of lower highs, this cycle has left the yield significantly higher than at the top of the previous cycle. Traders can no longer rely on the post-Volcker momentum behind falling rates, which explains why the Fed feels the need to replicate its illustrious former chairman:
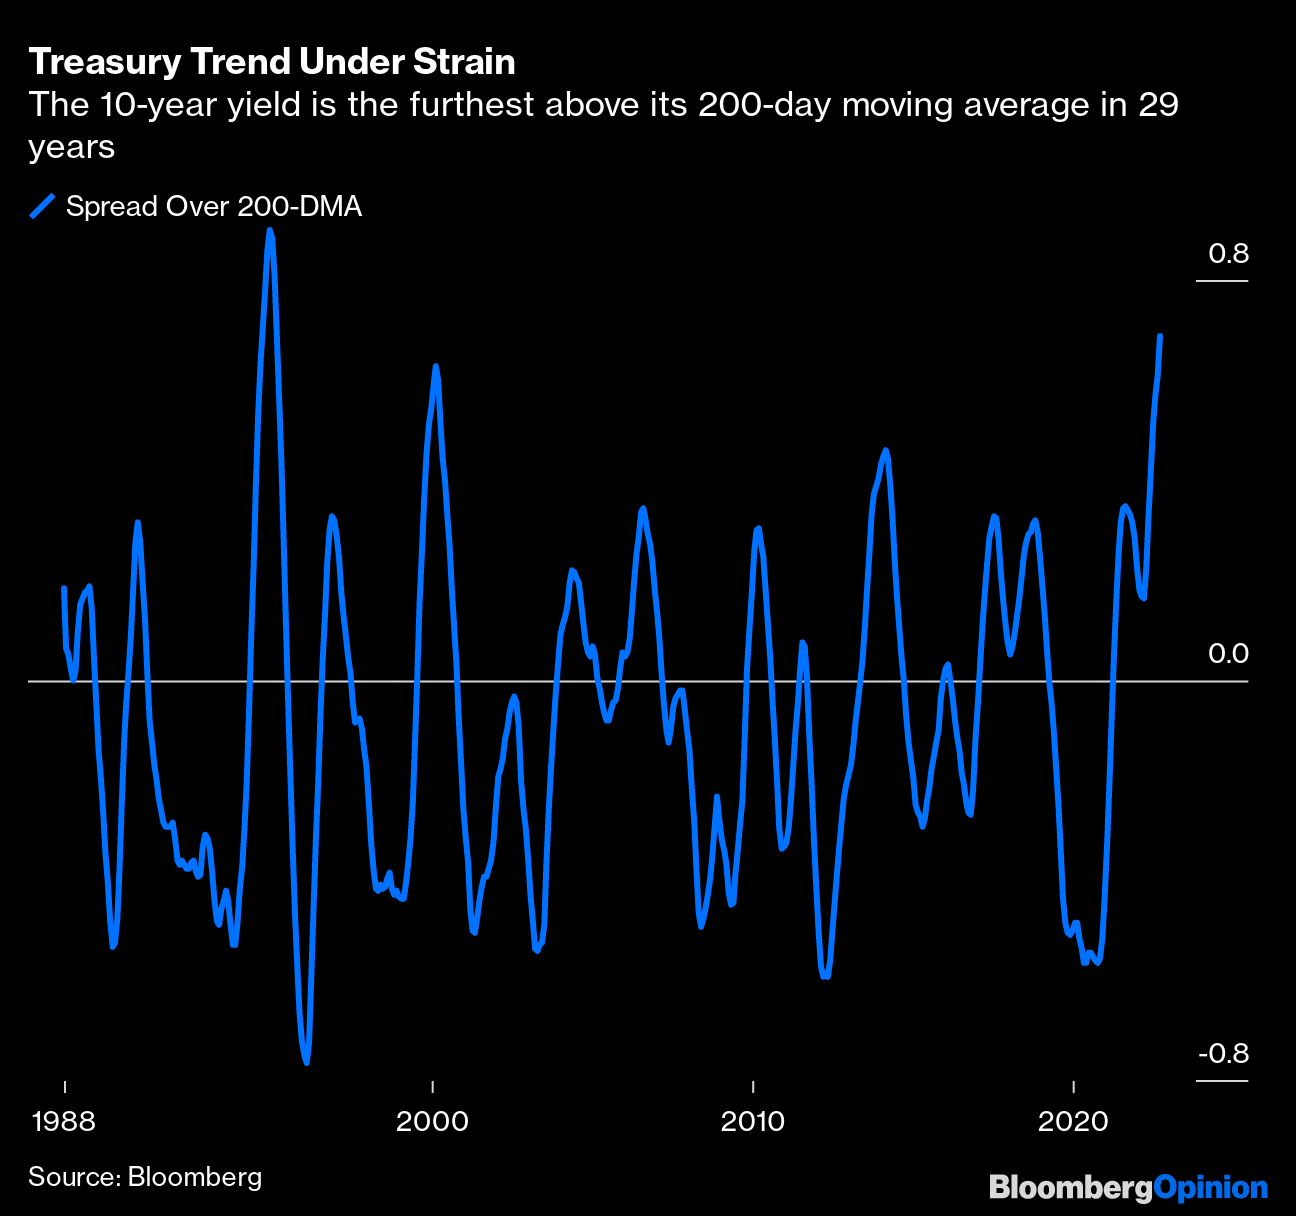
The yield is now well above its 200-day moving average, a measure of the long-term trend. To illustrate that more clearly, this is how the gap between the yield and the moving average has shifted since 1987:
The 10-year yield broke slightly further above the long-term trend in 1994, which not coincidentally was the last time the Fed — under Alan Greenspan — surprised the market with an aggressive series of rate hikes. But it’s still a big deal that the most important measure in finance is the furthest above its trend in 28 years.
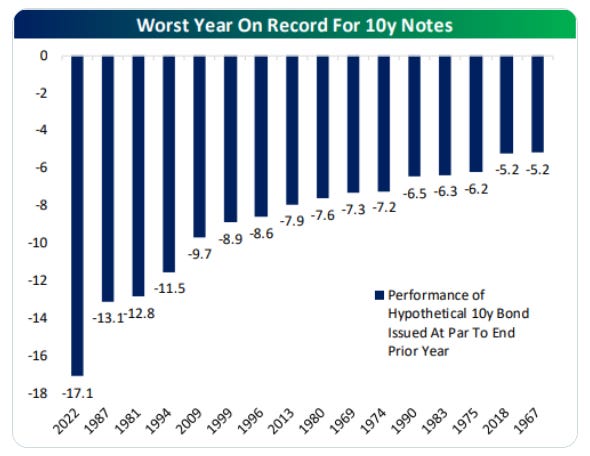
For another indicator that the ice has been broken, just look at the losses that this selloff has inflicted. The joys of bond math mean that a rise in yield from a lower level can inflict a greater dent on the price, and that shows up in spades this year. The following chart, from Bespoke Investment Group, shows the biggest calendar-year losses that holders of 10-year bonds have suffered since 1961. With 2022 not quite three-quarters over, this is already the worst year for bond investors in six decades:
For a final critical indicator, read the latest opinions of Albert Edwards. Societe Generale’s chief investment strategist is (slightly unfairly) known as an inveterate perma-bear. He’s certainly been negative on equities for a long time, but he’s also (correctly) been bullish about bonds. His thesis, inspired from his time in Japan in the 1990s, was that the US and the rest of the developed economies faced an “Ice Age” in which yields stayed permanently low. So psychologically, it means a lot that he is now prepared to declare the Ice Age over. He thinks bond yields will keep rising. But don’t worry, that doesn’t mean that he’s gone positive on stocks:
The theme of secular stagnation which underpinned our Ice Age thesis for so long has been dealt a fatal blow as politicians begin to shed their fiscal shackles. Until recently, economic ideology had prevented them breaking free from fiscal austerity. That had caused central bankers to fill the economic void with super-expansionary monetary policy. Those days are now over and aggressive fiscal activism reigns supreme, most visible currently in the UK. This will bring higher growth, higher inflation, and higher interest rates across the curve. The party for investors is over. The Great Melt will not only melt the ‘Ice’ in ‘Ice Age,’ but investor returns are set to melt away too.
I’ll look for the actual note and post over the coming weekend … But for now, with this longer-term thesis and visual in mind … and an ice age being over, here are some shorter-term visuals / thoughts for the more tactically / STRATEGICALLY minded, from the shop formerly (and perhaps once again) known as 1stBOS,
10yr US Bond Yields have surged higher today, in line with our view that a break above 3.50% could trigger a short-term move higher.
Outlook: 10yr US Bond Yields surged higher following the break above the 3.50% highs and post last night’s FOMC meeting, in line with our previously stated view that a break above 3.50% could trigger a short-term burst higher as momentum players chase the move and/or investors stop out of long positioning, with the market now close to the next medium-term support at 3.77%. Despite the latest move higher, our broader medium-term view remains unchanged that this is unlikely to be the start of a sustained trending phase to the upside given the large weekly momentum divergence on both weekly RSI and MACD, which has characterized 4 out of the previous 5 major peaks in yields. Therefore, we believe this move higher will ultimately prove to be relatively short lived and we are watching for signs of exhaustion and/or reversal in order to turn bullish, although there are certainly no signs of this yet. First resistance moves to the latest breakout point at 3.51/50%, then a very well defined intraday uptrend from the August low at 3.445%, below which would remove the recent upward pressure on yields.
In contrast, we see the next support on a closing breakout above 3.77% at 4.005/4.02%.
Short-term Strategy: We stay tactically neutral for now as we await signs of exhaustion to turn bullish.
The firm remains NEUTRAL on 5yy AND also tactically BULLISH BONDS at the very same time,
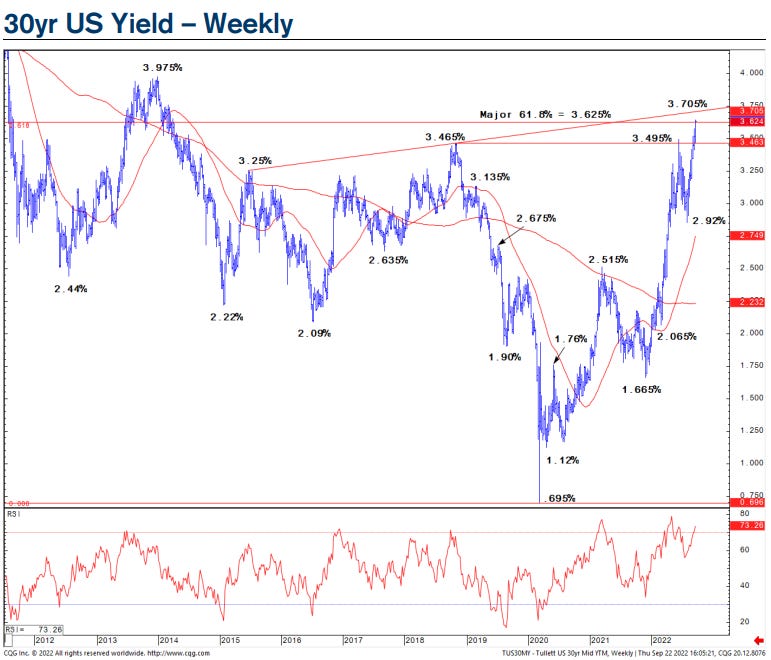
30yr US Bond Yields have reached the next major support at 3.625% and we stay tactically bullish despite the push higher in yields.
Outlook: 30yr US Bond Yields moved higher in a more decisive fashion on Thursday, breaking more clearly above 3.495/50%, which is the 2022 highs and a psychological support. A bear steepening in the curve post the hawkish FOMC yesterday is a surprising market reaction today, and we believe it is unlikely to be sustained, especially given the terrible medium-term momentum picture following this latest push to new highs. Furthermore, the market has also now reached important medium-term support between 3.625/705%, which is a potential long-term trendline and retracement level, where we are still biased towards a cap.
Short-term resistance moves higher to 3.50/485%, then to 3.445%, below which would confirm a false breakout and reinforce our rangebound outlook. Next resistance is seen at 3.19/18%, below which would turn the risks lower within this range.
Short-term Strategy: We stay tactically bullish for now and still look for a move to resistance at 3.05%, where we would turn tactically neutral.