… HEREis what this shop says be behind the price action overnight…
… WHILE YOU SLEPT Treasuries are close to UNCH as holiday-like conditions prevailed in Asia, risk appetite still on the mend, led by tech (HSTECH +0.67%; CSI 300 +0.16%). Japan shares slightly pared gains after news of restrictions on chip exports (Nikkei +1.13%). Modest selling was seen in long-end, but overall activity was limited. Month-end extension expectations also seem uninspired, with treasuries heading into the London open near Tokyo's start-of-day levels. Volumes at 50% averages. In Europe, there was a mixed reaction to French and EZ CPI, and German employment data, the net impact being peripheral outperformance (BTP 5s -6.5bps) and EURUSD weakness (-0.3%). DAX futures are +0.4% and SPX futures are +0.2% here at 7am.
… and for some MORE of the news you can use » IGMs Press Picks for today (31 MAR) to help weed thru the noise (some of which can be found over here at Finviz).
From some of the news to some VIEWS you might be able to use. Global Wall St SAYS:
First up from BBG … umm, no, I mean a large French bank … discussing their REVISED May FOMC call…
US: Hike in May, then go away Carl Riccadonna, Andrew Schneider, Yelena Shulyatyeva , Andrew Husby, Luca Pennarola
KEY MESSAGES
The tightening of US financial conditions - and likely further tightening in lending standards and reduction in credit provision - raises the prospect that the Fed will have to do less with the policy rate, all else equal.
To gauge the degree of potential substitution, we model three scenarios based on realized moves in and projections of risk premia. The analysis implies that the fallout from recent events should knock about 50bp off our terminal fed funds forecast.
We revise our fed funds call accordingly, and now see a terminal rate of 5.25% reached with a final 25bp hike in May. We continue to expect 175bp of cuts next year.
… Hard credit data also raises concerns. As Fig. 6 shows, bank commercial and industrial (C&I) lending growth slowed over H2 2022, and contracted in February 2023. The most recent data – running through the week of 15 March (SVB collapsed on 10 March and Signature Bank was closed by regulators on 12 March) – showed a spike in lending. In our view, that most likely reflects companies drawing down revolving credit facilities to get ahead of a lending pullback. In other words, the spike could indicate deterioration, not an all-clear.
Deposit data supports this notion. Small banks (defined by the Fed as all domestically chartered banks below the top 25 by assets) saw their deposits plunge by 2.4% over the week of 15 March (see Fig. 7). Meanwhile, overall deposits continued to decline, now pressured not only by quantitative tightening (QT) but also by more visible competition from money market mutual funds (see Fig. 8).
… Before the banking sector shock, we expected fed funds to hit a terminal rate of 5.75% by July 2023. We take signal from our modeling exercise, and lower our terminal fed funds forecast by 50bp to 5.25%.
This implies one more 25bp hike, which we expect to come at the May policy meeting. This remains a relatively low-conviction call, with the risk that it could turn into a pause, depending on financial and credit developments in the interim…
Here’s one for our inner stock jockey from a large British operation,
The economy is in a precarious state post-banking crisis. Yield curve inversion is a classic sign that a recession is on the horizon, but inversion followed by a sharp re-steepening (as we've seen over the last 2 weeks) should be cause for greater alarm, as this tends to signal that a recession is imminent.
Figure 1. Yield curve flattening signals recession is on the horizon, but flattening followed by sharp re-steepening means a recession is imminent
For somewhat MORE on what happens if / when curve resteepening begins in earnest (trade of the year and many suggest it’s already begun), from a large German operation
US curve steepens: what happens to FX, equities, credit, gold, oil & vol ?
In macro circles it has become popular to talk about potential US curve "steepener" trades. This piece looks at what asset markets have historically done, when the US yield curve (10y -2y) hits its most negative/flat point and starts to steepen.
On average once the inflection point in the curve is reached, 2y yields are off close to 150bps on a median basis within 6m, which looks extraordinarily sharp, but not when placed in the context of recent events. The 10y tends to decline by roughly half the move in 2year yields over both a 6m and 12m time horizon.
Among the strongest and most important signals is that the curve inflection point has presaged significantly stronger equities in the year ahead, and that any risk appetite negativity, has been concentrated in credit markets and a widening in credit spreads. This is consistent with equities leading the business cycle, and credit spreads lagging the cycle.
12 months after a curve inflection has been reached the S&P is up by a median 13.2%, and was up in 6 of 7 rate cycles. BAA - 10y yields have tended to be wider 6 out of 7 cycles in the 6 months after the inflection point.
In terms of FX signals as per the Tables below, the USD tends to weaken against the EUR and this signal is pretty consistent over the longer-term (2 years). This USD weakness is not evident in the likes of the Aussie or yen. In general FX signals are less consistent as shown by the relative lower 'hit ratios.'
As the curve inversion reverses and the curve steepens, gold typically trades well. Gold strength in these circumstances has been most evident in the last couple of cycles when the rate cuts were particularly sharp, and ZIRP with QE came more quickly into focus.
Oil also shows a significant upside bias after the curve inflection point, consistent with a recovery signal as the curve shifts more positive.
On the vol side, Bond vol was down sharply a couple of years after the curve has tended to steepen, with the big exception 2008, when vol exploded.
On FX vol, the medians show if anything some increase in realized G10 FX vol, and the charts below show, that two of last five cycles have also seen brief episodic spikes in realized (CVIX3R) FX vol consistent with an unstable macro landscape that often typifies the transition to a steeper curve.
…The Tables below uses weekly data to establish the timing of the shift to a steeper, curve, and monthly data to track the market responses. Figure 1 illustrates the cycles chosen, where inflection points were looked at in relation to the funds rate cycle.
Stock jockeys alongside other macro tourists, right now everywhere across the land, in meetings with therapists,
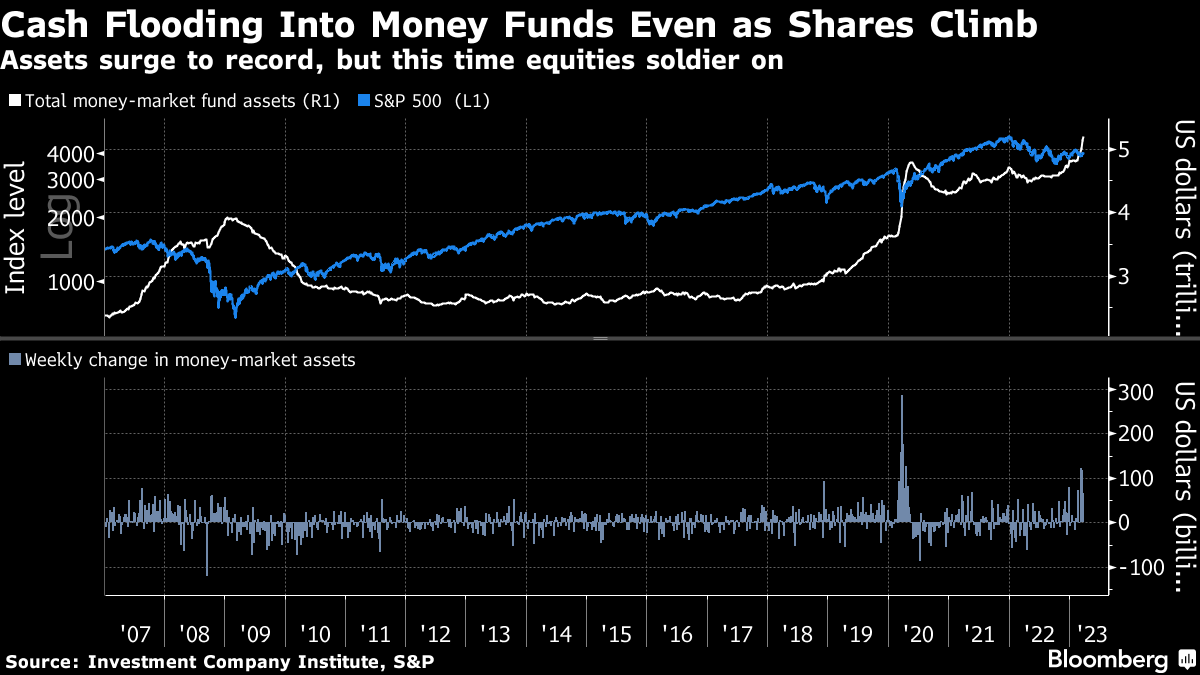
Whats a person to do, then, with their CA$H? BLOOMBERG,
… On the surface of it, the banking crisis looks to be fading rapidly enough that it will soon disappear from the rear-view mirror. Global and US equities are heading for decent March gains — a stunning achievement given they faced the Scylla of hawkish central bankers and the Charybdis of the banking crisis. Even Michael Burry — a self-described Cassandra to extend the Greek mythology theme — just congratulated dip buyers.
All the same, there are plenty of investors hunkering down against the potential for further turmoil. The surge in funds parked at US money-market funds continues apace, with the amount stashed there hitting a record $5.2 trillion. Inflows exceed the pace seen in the lead-up to the 2008 crash, indeed only the pandemic spurred a stronger flight to the funds. Unless the dash into cash eases, the omens aren’t great for equities, given those antecedents, and they also underscore concerns about further banking turmoil. Or perhaps such flows will also help restrain yields to fuel further tech-stock gains.
AND as far as couple OTHER things from intertubes … BBG (via ZH),
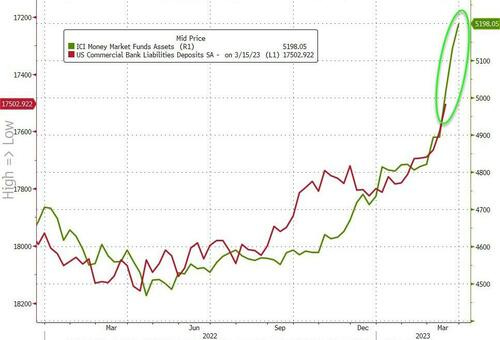
… This call for tougher regulations comes as outflows from bank deposits into money markets (which hit a new fresh record highs of $5.2 trillion today - with 54.5bn of inflows last week) continue to accelerate (thanks to The Fed)...
The last 3 weeks (including SVB's exodus) has seen $304 billion of inflows, a record surge outside of the COVID lockdown crisis. As TD Securities strategist Gennadiy Goldberg said regarding last week's data:
"This is consistent with ongoing deposit flight from the banking system as depositors indirectly invest their cash into government securities via money funds and shun bank credit," adding that,
"This answers the question of ‘where is the money going once it leaves the banking system?"
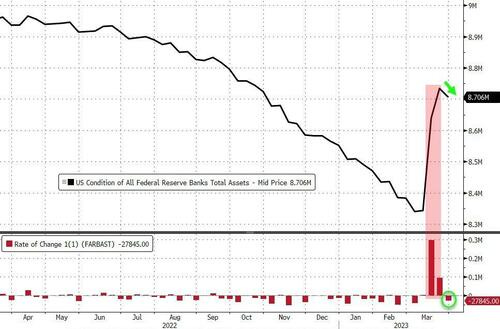
Meanwhile, the most anticipated financial update of the week, the infamous H.4.1, or the Fed's weekly balance sheet update, showed that the world's most important balance sheet actually shrankmodestly last week by $27.8 billion (helped by a drop in TSY and MBS of $10bn as part of the ongoing QT)...
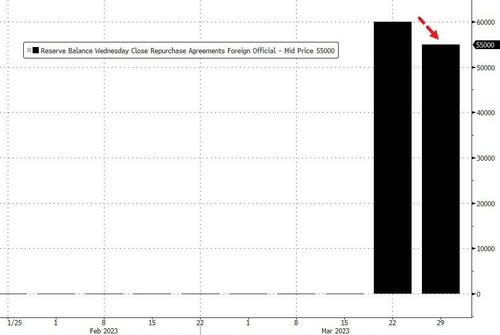
… But just like last week, this is meaningless since at least one bank parked a whopping $55BN in the Fed's foreign repo facility. The bad news: the dollar shortage continues; the good news: at least it's less than last week's record $60BN.
Balance sheet aside, there’s supply (of MONEY) side of the story, referencing Matt King of Citi
… Fed data on Tuesday showed that M2 money supply, a benchmark measure of how much cash and cash-like assets is circulating in the U.S. economy, fell a non-seasonally adjusted 2.2% to $21.099 trillion in February from the same period a year earlier.
In seasonally-adjusted terms, M2 money supply fell 2.4% from the same month last year to $21.063 trillion.
That was before the March failures of Silicon Valley Bank and Signature Bank – both in the top 25 banks in the country – which fanned fears of a credit crunch, stoked market volatility, and prompted temporary emergency liquidity measures and backstops from the Fed worth hundreds of billions of dollars.
Matt King at Citi in London, an expert on capital flows and liquidity, says if money supply growth can reasonably be seen to expand liquidity and fuel inflationary pressures, then the opposite should be true.
“M2 is a driver of broader asset price inflation, consumer inflation, equities, and real estate. It is sending quite a negative signal for all of those now, and will likely feed through to broader economic weakness,” he said.
Bond market volatility is cooling off as the banking collapses and the March Fed meeting fade from the front page.
And it appears the volatility has left big unresolved bases in US Treasuries in its wake…
Let’s dive in!
Check out the US 30-year T-Bond futures carving out a multi-month reversal pattern:
If and when it breaks above 132’18, I’m long with an upside objective of 143’00. Simple!
It’s the most attractive setup due to the bullish momentum regime and clean breakout level – two attributes short-duration bonds lack.
Why? …
… Bonds across the curve are forming tradeable lows. If and when they resolve higher, other long-duration assets most likely follow suit. These assets include tech stocks and growth names, in general.
But it’s not that simple for the broader stock market. The S&P 500 fell 5.0% on the initial bullish thrust in bonds earlier this month.
On the flip side, the S&P 500 has recovered roughly 5.0% since March 13 as bonds began to simmer down.
While bond investors welcome any and all rebounds in US Treasuries, the stock market would prefer a steady and controlled climb over anything else.
Stay tuned!
Finally, with Trump now under indictment, yet another piece of the puzzle offered thankfully as another crisis happening at exactly the perfect time…I’m certain it’s all coincidence ( :) )
White House released statement detailing how “the weakening of common-sense bank safeguards and supervision during the Trump Administration for large regional banks should be reversed”.
AND removing my tinfoil hat for the time being, hoping to have something out before the month of April gets under way but … THAT is all for now. Off to the day job…