Bloomberg: Yellen Says Yield Surge Is Due to Strong Economy, Not Deficits
Benchmark US Treasury yields have climbed to pre-crisis highs
Treasury chief downplays idea budget worries drive yield rise
… Yellen also cautioned it’s not clear that long-term yields will stay higher over the long haul. The trends that had produced low levels for yields before the pandemic are “still there,” she said.
So with war machines cranking up (Putin ‘forming axis of terror’ as he welcomes Hamas and Iran to Moscow -Telegraph) and wars abroad as well as the economic battles CHOSEN to be fought here at home — supply announcement IS coming next week — exactly WHO believes rates up SOLELY because of Bidenomics … other than those running on and trying to sell to America how well it is working?
Bidenomics in bond market parlance,
Except instead of car keys, YOU get a 5% yield and YOU get 5% … calling all vigilantes like,
I’ll get back TO an update of what happens when rates offered concession (ie go UP and 7yy nearly touched 5%,
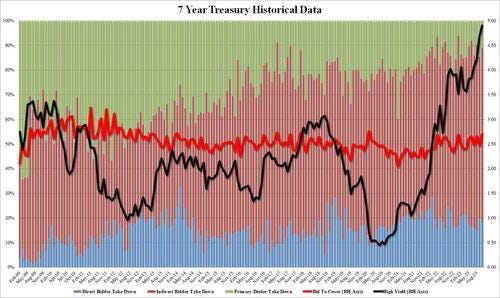
ZH: Yields Slide After Stellar 7Y Auction With Highest Bid-To-Cover Since March 2020
… The bid to cover of 2.704 was a solid improvement to last month's 2.465 and was the highest going back to the March 2020 bond market rollercoaster.
The internals were also solid with Indirects awarded 70.6%, just above the recent average of 70.4%, and with Directs taking down 18.4%, Dealers were left holding just 11.0% below the 6-auction average of 12.0%.
The strong auction took the market, which has gotten used to expecting fire and brimstone on every auction day, by surprise and pushed 10Y yields down to session lows around 4.86%, down more than 10bps from the session highs hit earlier in the session.
Welp the ECB DID set the table for this as it passed (on hikes) and so a dovish (?) start TO the morning…
ZH: After 10 Straight Hikes, ECB 'Pauses' (As Expected); Warns "Inflation Still Expected To Stay Too High"
… That was nice…As was the early look at GDP (flation, specially) and CLAIMS … (?)
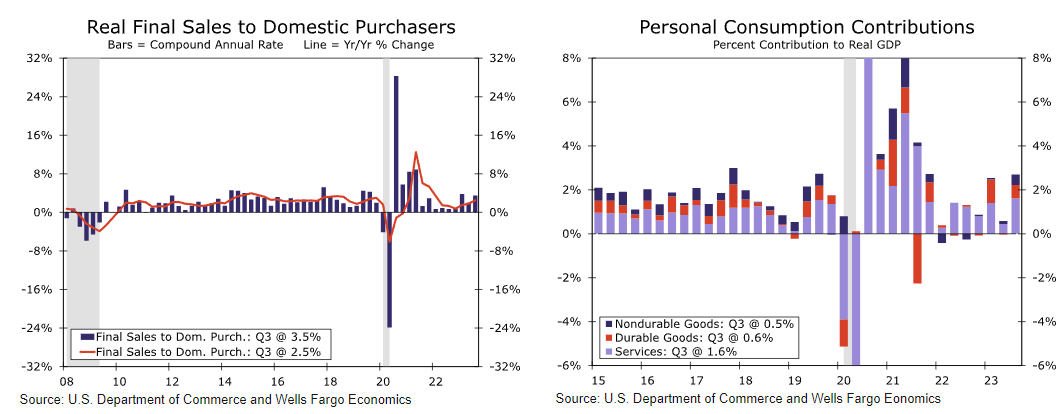
GDP growth was just shy of 5% annualized in the third quarter, once again a much better result than the surveys implied
ZH: Bidenomics "Bailed Out By Taylor Swift And Barbenheimer": Q3 GDP Soars 4.9%, Highest Since 2021... It's All Downhill From Here ZH: Continuing Jobless Claims Jump To Highest Since May ZH: US Durable Goods Orders Soared In September By Most In Over 3 Years ZH: 'Better' Data Sparks Big Bond Bid; Batters Mag-7 Stocks To Trillion-Dollar Tumble
POINT IS … data dump made things even MORE clear as mud. Evidence the knee jerk reaction TO stronger growth (GDP) and jump in CONTINUING claims with rates DOWN a touch, early…
ZH: Stocks & Bonds Rip, Dollar Dips After Anti-Stagflationary GDP Data
… here is a snapshot OF USTs as of 705a:
… HEREis what this shop says be behind the price action overnight…
… WHILE YOU SLEPT Treasuries are modestly lower with the curve a hair steeper ahead of PCE, Monday's Tsy financing estimates, Tuesday's BOJ outcome and Wednesday's Treasury refunding announcement. Need to grab some Zz's this weekend. DXY is little changed while front WTI futures have rebounded (+2.1%). Asian stocks rose smartly overnight, EU and UK share markets are mixed while ES futures are showing +0.45% here at 6:55am. Our overnight US rates flows saw muted price 'action' overnight where, despite net overall selling, 5's continue to trade well on curve (Tsy 2s5s10s 'fly -1.6bp) with some interest to fade that out-performance earlier today. Fast$ also showed interest to flatten 2s10s curve. Overnight Treasury volume was again notably subdued at ~60% of average overall.
… and for some MORE of the news you can use » The Morning Hark - 27 Oct 2023 in effort to to help weed thru the noise (some of which can be found over here at Finviz).
Moving from some of the news to some of THE VIEWS you might be able to use… here’s SOME of what Global Wall St is sayin’ (in a similar sorta way you’ll find content if you pay for ZH PREMIUM … except different … I think, as they seem to be selling others research and I’ve never been quite sure how they can do that … anyways, another time …)
The US economy has been unquestionably strong, but the strength in Q3 is exaggerated by one-off factors. Volatility in GDP growth is the norm, historically speaking, and we expect significant payback in the Q4.
Apollo- Incorrect Fed Expectations (a prior life fan fav chart of how poorly how wrong those who are supposedly IN THE KNOW (with Terminals) are often quite WRONG ‘bout flation…)
The market is currently pricing that the FOMC will start cutting rates in June 2024, but the chart below shows that the market is almost always wrong about what the Fed will do beyond the next FOMC meeting.
Looking at the chart, it is remarkable how mean reverting the error is.
When rates are low, the market is systematically pricing that the Fed will soon hike.
When rates are high, the market is systematically pricing that the next move from the Fed is to cut.
Maybe the Fed will cut rates next summer. Maybe not.
For now, investors should be planning on rates staying higher for longer.
BloombergBNP US GDP: Q3 consumer resilience faces a critical test in Q4
KEY MESSAGES
The composition of a stellar 4.9% q/q saar gain in Q3 GDP was heavily skewed towards the consumer, making the future growth trajectory overly dependent on disposable personal income growth prospects. Our projections for a consumer downshift in Q4 and into 2024 take into account a rapid rise in consumer debt servicing costs amid gradually slowing wage growth.
Business fixed investment was unchanged, after an earlier boost in H1 2023 driven by Bidenomics stimulus. Rapidly falling capex intentions and swiftly rising interest rates amid significant uncertainly in the economic outlook will prevent a significant rebound in business sector growth, in our view.
The first increase in residential investment in more than two years will likely be short-lived given the recent spike in mortgage rates. Poor affordability is set to impair demand in the new housing sector, despite tailwinds from severe inventory scarcity in the existing home market.
We retain our projection for growth to moderate in the current quarter and estimate a rise in the vicinity of 1.5%.
We expect the FOMC to keep the fed funds rate unchanged at 5.50% at the upcoming meeting.
Recent comments from Fed officials suggest they see tighter financial conditions mitigating the need for further increases in the policy rate.
We look for Chair Powell to maintain optionality for further rate hikes under specific circumstances, including a destabilization of inflation expectations, stalled progress on the path toward 2% inflation, or if the tightening of financial conditions is not “persistent”.
The tone of the statement and press conference will likely show more substantive/abrupt changes relative to recent history, in order to acknowledge an impressive resurgence of growth and job creation in Q3 2023.
We remain of the view that the July hike was the last of the cycle, with the cutting cycle only commencing (in June 2024) after a mild downturn in H1 of next year.
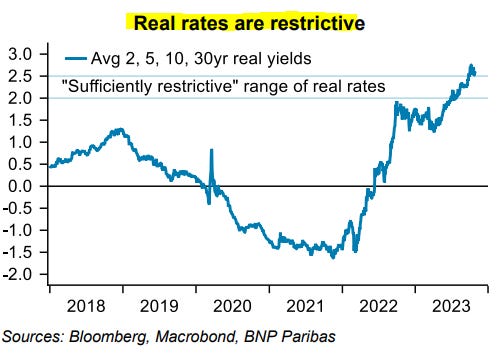
… The Treasury component of our index shows significant restriction relative to history (chart at right, below).
CitiFX Techs - As The Sun Rises: Inflection points (2 charts — 2s and SPOOS — and I’ll leave you with 2s and suggest you find yer way through entire report IF you got it AS … ‘stocks look increasingly vulnerable …)
US 2yr yields
Price is again testing the pivotal 55-day MA, having posted a bearish outside day on Thursday.
Why it matters? A decisive weekly close below opens up a >40bps move lower, and would add to our conviction of a bull steepening move (discussed in CitiFX Techs - Watch for the bond turn).
The techs building blocks:
While we are not very fond of daily reversal indicators for US 2s, we did post a bearish outside day and test support at the 55-day MA.
We have not seen a weekly close below 55-day MA since May 2023
There is a 55-200 day MA setup potentially in play. IF we see the weekly close below as mentioned earlier, it would suggest a move towards 200-day MA at 4.58%.
Interim support is at 4.92% (October 10 lows), and 4.75% (September 1 low)
Upside resistance remains stiff around 5.2%-5.25%
Some caution warranted: With higher for longer still the main narrative, and noise around month-end, we are cautious about false breaks. We would need to see a decisive weekly close below at the minimum, and would prefer to see a monthly close below to confirm.
DB - Early Morning Reid (Jim describes ARMY bonds … LEFT, Right, LEFT…)
… However concise we try to be, there's no getting away from spending yet more time on the zig-zagging nature of bond yields with the volatility continuing yesterday. 10y Treasury yields were down -11.1bps to 4.85%, outperforming a decent rally for 2yrs (-8.1bps) and 30yr (-10.0bps) yields. Most of the gains happened before a firm 7yr auction but this did help flatten the curve late in the day.
This rally came even as Q3 US GDP was strong yesterday with the PCE deflator having more influence as it came in a tenth below expectations. Meanwhile, US equities suffered, led by the tech sector with the Magnificent Seven down -2.98%. All this overshadowed a relatively dull ECB meeting as they paused for breath after 10 successive hikes…
… Turning back to the US data, core PCE for Q3 came in below expectations at 2.4% quarter-on-quarter (vs 2.5% expected), down from 3.7%. This brings the measure to its slowest pace since 2020, a promising sign for the Fed. We have the September PCE data today, which will bring further colour to the pace of falling inflation. Yesterday’s quarterly data suggests a touch of downside risk to our US economists’ projection for a +0.3% month-on-month core PCE deflator print today …
… Taken together, yesterday’s data reaffirmed the likelihood of a Fed pause next week, and the Fed rate priced in by fed fund futures for the final meeting of 2023 in December fell -1.7bps, which equates to a 19% likelihood of a hike before we move into 2024 …
DB - Fed Notes - How much work is the market doing for the Fed? (an excellent and timely note as its something on many folks minds … and frankly I am kinda surprised at what they suggest … FCI tightening equal to 3 hikes?)
Over the past several months, financial conditions have tightened sharply, led by a significant rise in long-term interest rates. Fed officials including Chair Powell have taken notice, suggesting that, if this tightening is sustained, it could substitute for additional rate increases. A key question for the Fed, and markets, is how many rate hikes this additional tightening could be worth.
In this piece we present a simple model replicating the Fed staff's recently released financial conditions index, and then use a daily version of this model to quantify the recent tightening of financial conditions. Using daily data, we find that since September financial conditions have tightened by an amount equivalent to a roughly 60bps drag on growth over the next year. Based on recent research, this is roughly equal to three rate increases.
Our analysis aligns with Powell's assessment that the recent tightening of financial conditions has been "significant", supporting the desire to proceed carefully with policy in the near term, including by holding rates steady at the November meeting. A critical question for the policy path beyond November will be whether this tightening is sustained, in addition to how growth, the labor market and inflation data evolve. Our daily version of the FCI will help to track the evolution of financial conditions on a high frequency basis during this critical juncture.
… To assess how many hikes the recent tightening may be worth, we first need to derive a higher frequency estimate of the FCIs. Here we focus on the Fed's baseline version, which is the three-year lookback. We use daily data for all indicators except the Zillow home price index for which we apply the monthly value to each day within the month. We then apply the weights from the regressions outlined in the previous section to the daily data to derive a daily FCI. This is shown in Figure 6.
So far for October, our daily version has averaged a reading of 1.3, this is about a 60bp greater drag on growth than the average read for September. The latest daily read is 1.4, though these are volatile. Based on recent research by Sack and Swanson (2023), the Fed’s FCI tightens by initially about 20 points on a policy induced 25bp rise in the two year Treasury yield. 1 Using this equivalence, we find that the recent tightening in financial conditions is roughly equivalent to the impact of about three 25bp rate increases…
Goldilocks - GDP Growth Hits 4.9% on Strong Consumer, Government, and Inventories; Durable Goods Up; Jobless Claims Rise (laundry list report which did result in some updated dart throwing results … )
BOTTOM LINE: Real GDP rose 4.9% annualized in the third quarter, four tenths above consensus and the fastest pace since the reopening boom of 2021. The composition was not quite as strong, as inventories contributed a quarter of the growth and should weigh on the Q4 pace. Nonetheless, demand growth proceeded at a strong clip, with final sales rising 3.5% annualized led by consumer and government spending. Core PCE prices rose +2.4% annualized in Q3, below consensus expectations. Following today’s report, we lowered our September core PCE estimate by 1bp to 0.27% (mom), corresponding to a year-over-year rate of +3.66%. We similarly lowered our September headline PCE estimate by 1bp to 0.33% (mom), corresponding to a year-over-year rate of +3.43%. The goods trade deficit widened slightly in September, driven by an increase in both exports and imports. Durable goods orders increased 4.7% in September, above consensus expectations for a moderate increase, and core capital goods orders also grew by more than expected. Wholesale inventories were flat, slightly below consensus expectations for a modest increase. Initial claims increased by more than expected, while seasonal distortions likely boosted continuing claims. Pending home sales rose 1.1% month over month in September, above expectations for a decline…
JEFF - Q3 GDP Up 4.9%... An Impressive Quarter, but Tough to Repeat
■ Q3 GDP rose 4.9%, stronger than the consensus forecast of 4.5% and the biggest q/q increase since Q4 2021 when growth rose 7%. ■ Overall, there are few surprises. The bulk of growth was driven by strong consumer spending as PCE rose 4% q/q and contributed 2.7 ppts to top-line growth. This was right in-line with expectations, and consistent with the monthly retail sales and PCE data that we have seen in Q3 so far. However, inventories generated a surprisingly strong 1.3 ppt contribution, the biggest since Q4 2022. Inventories tend to be mean reverting over time, especially at this point in the cycle, so we do not expect that this will be a dependable source of growth going forward. ■ The Q3 growth data is extremely impressive, but it sets a very high bar for Q4. ■ Bottom line, the consumer went nuts in Q3, spending tons of money on vacation, entertainment, and recreation experiences. Student loan payments starting up this month will very likely tamp down this spending in Q4, so we remain steadfast in our view that a recession is coming early in 2024.
Housing CPI accelerated in September, mostly driven by Owners Equivalent Rent (OER). Is this an inflection point? It is hard to tell with only one print, but we highlight key points to bear in mind as new data become available.
Key takeaways
Our models have been forecasting housing disinflation well and, as a result, we are not changing our near-term forecast.
There are no signs of a structural break pointing to the end of disinflation, but 4Q23 housing CPI prints above 0.41%M on average would raise a red flag.
The recent rebound in OER likely does not reflect labor market strength.
Although it is hard to quantify the effect given the lack of detail, the recent methodological change in OER CPI might mean stronger prints. We explain why.
Resilient economic growth this year means upside risk to our 2024 forecasts if labor markets cooling stalls.
We expect the Fed to hold the policy rate at 5.375%, to recognize recent strength in the economy, but to soften its forward guidance. We continue to see it remaining on extended hold into 2024. Our strategists stay neutral duration, and long SFRZ4 on SFRU3Z4Z5 fly…
… In the press conference, we anticipate a similar tone to Chair Powell's speech at the Economic Club of New York: balanced risks to the outlook, little appetite for near-term rate hikes amid tighter financial conditions.Since the September FOMC meeting, our Financial Conditions Index has tightened by the equivalent of a ~76bp rise in the funds rate (Exhibit 1). We expect Powell to reiterate that "uncertainties, both old and new, complicate our task of balancing the risk of tightening monetary policy too much against the risk of tightening too little." With those uncertainties comes caution.
… Ultimately, the last FOMC meeting left the US rates market without an anchor, with the Fed offering no concrete guidance on r*, while optically raising the dots. To that end, we do not expect much of an anchoring effect at the upcoming meeting either, and expect long-end Treasury yields to be driven by technicals, flows, and data surprises (see Exhibit 3).
Given this type of market, alongside falling bank stocks, investors will keenly watch every word around the topic of QT, and if the Fed has any guardrails around what could cause QT to be reconsidered.
Scotiabank- U.S. Economy Beats, Core PCE Misses — Which One To Emphasize? (GREAT question…)
US GDP growth beats again...
...and other readings were simultaneously strong...
...but yields rallied...
...perhaps by placing more attention upon core PCE
We need tomorrow’s September PCE to assess pressures at the margin
The FOMC might not see it the same way as markets did
… Core PCE, however, missed consensus expectations by a tick and landed at 2.4% q/q SAAR. We can’t tell if that was due to revisions to prior months or a signal that tomorrow’s reading for core PCE in the month of September will land weaker than expected. We need to see tomorrow’s data in order to evaluate inflationary pressures at the margin using the Fed’s preferred gauge. For now, chart 2 largely just tells us what we know about the soft patch in monthly core PCE readings mapped onto the Q3 tally.
… WILL THE FED SEE IT THE SAME WAY AS MARKETS? So did markets react the way they should have? I’m uncertain, but think that Chair Powell's argument is that persistent strength in GDP growth amplifies future inflation risk even if that output gap and augmented Phillips Curve approach to gauging future inflation has frankly been a dud to date. The US economy is showing few signs of slowing down and is therefore driving persistent capacity pressures that could be keeping inflation risk very much alive regardless of the summer/Q3 soft patch.
UBS- GDP jumps & continuing claims trend up (devils always in details)
… Core PCE prices rose 2.4% in Q3, one tenth slower than the consensus expected, though that was in line with our expectations. While GDP surprised consensus to the upside, the magnitude may not have been sufficiently large to cause front end yields to rise, and the easier core inflation data may also have eased some fears for a hotter run of data this morning, as the two-year yield has fallen back following the data releases.
We expect the FOMC stays on hold in November, at their meeting next week. As we wrote last week, Chair Powell said the FOMC was prepared to proceed carefully with two-sided risks to the outlook. However we also wrote that we expect December could be a tougher call for the FOMC than current market pricing suggests. While we expect slower economic data ahead and thus do not expect a rate hike in December, the economic data needs to cooperate. Lately it hasn’t…
UBS (Donovan) - The hedonism of the US consumer (while I may agree with what he’s saying, I dunno … I detect a note of jealousy in his tone … is it just me?)
When the economic history of the early 21st century comes to be written, the opening sentence in a bold font should be “never go short the hedonism of the US consumer”. Middle-income consumers have lower inflation than consumer price data implies, giving them more spending power. Historically, this would have sent them flocking to the shopping mall—nowadays, they are spending enough at Taylor Swift concerts to reportedly make the singer a billionaire.
Consumer strength supported yesterday’s third quarter GDP data (though there were signs of soft demand for goods, and the numbers overall are subject to a lot of revision). Today’s personal income and spending data should show consumption resilience. The PCE deflator (a broad consumer price measure) is still distorted by the fictional owners’ equivalent rent measure.
University of Michigan consumer sentiment provides entertainment of the slapstick comedy variety, with Republicans and Democrats metaphorically hitting each other with their prejudices. The value of this is not economic, but is a reminder (ahead of 2024 elections) of the depth of partisan division.
UBS- US Big Data: Yield rise exceeds data improvement(so … btfd?)
Big Data Nowcasts indicate stable US growth momentum. Stability favours risk, but growth resilience to higher rates currently weighs on sentiment.
Growth remains resilient… Risk assets do well in stability but growth resilience is increasingly questionable… Expect above-consensus growth surprises…
Wells Fargo - Economic Resilience on Display in Q3 GDP
Summary U.S. economic growth accelerated in the third quarter to a 4.9% annualized pace, signaling the economy remains resilient in the face of higher rates and still-elevated prices. While persistent strength in demand could put the inflation descent in jeopardy, we do not anticipate this report changes much for policymakers, and we expect the FOMC to leave rates unchanged at next week's meeting.
… Policymakers had anticipated the strength exhibited in today's report based on strong monthly data, with little of the underlying details coming as much of a surprise. Inflation also continued to moderate with the core PCE deflator easing to a 2.4% annualized pace in the third quarter. Separately released data on jobless claims showed a slight uptick in initial claims for unemployment as well as those continuing to make claims. While both measures remain low and consistent with a tight labor market, the more persistent rise in continuing claims adds to some signs of moderation. The recent upward move in longer-dated yields can also add to financial tightness in the economy. We thus anticipate the FOMC will remain cautious to take further action at this point. We also ultimately still anticipate the economy will show more meaningful signs of slowing later this year and early next year as tighter financial conditions more meaningfully materialize and begin to weigh on spending and investment decisions.
Yardeni- Are Stock Valuations Rerating? (victory laps and I told ya so’s … they are part of the game … and not for nuthin, after years of helping guide many on Global Wall St, the good Dr. here deserves to remind us occasionally he’s called it)
… Of course, the recent selloff may reflect a downward rerating of the market's valuation multiple as a slightly delayed response to the jump in the bond yield to 5.00% (chart).
While the valuation multiple has been declining since early September, the earnings outlook remains quite good in our opinion. S&P 500 forward earnings per share continues to rise to new record highs suggesting that S&P 500 operating earnings per share either rose to a new record high in Q3 or will do so in Q4 (chart). Nominal GDP rose to another record high during Q3. So did nondefense capital goods orders during September. And last week's, initial unemployment claims remained low at 210,000.
We've been anticipating a correction in the S&P 500 since mid-August. We remain in the correction camp, for now.
… And from Global Wall Street inbox TO the WWW,
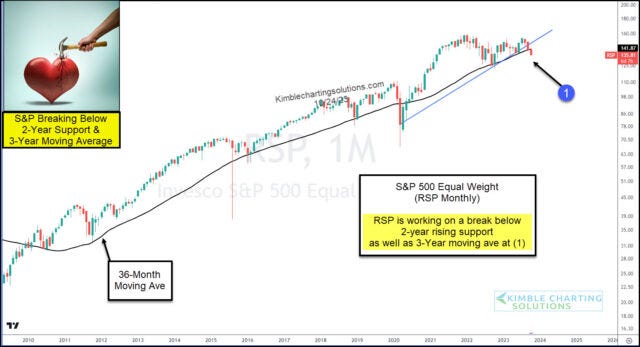
KIMBLE- Is Major Stock Market Index Warning Trouble Ahead?
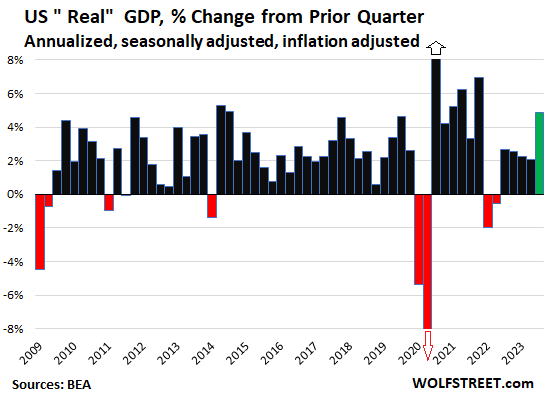
WolfST- Our Drunken Sailors – Consumers, Governments, Businesses – Have Blast, GDP Spikes in Q3, Powell Seen Tearing out his Hair
… GDP, adjusted for inflation (“real GDP”), jumped by an annualized rate of 4.9% in Q3 from Q2, following the 2.1% increase in Q2 and the 2.2% increase in Q1, according to the Bureau of Economic Analysis today.
All major categories, except the trade deficit (which worsened), increased sharply, adjusted for inflation:
Consumer spending (69% of GDP): +4.0%.
Gross private investment (18% of GDP): +8.4%.
Government spending (17% of GDP): +4.6%.
Private inventories increased and added to GDP.
But the trade deficit got a little more horrible and an bigger drag on GDP.
Finally, before hitting SEND a note that this weekend with Thing 1 in town for only about a ‘NY minute’ I’m unsure if I’ll have time to organize any sort of competent (or otherwise) weekend note ahead of Sunday night futures opening. Sorry for that. IF you require a refund, just reach out and we’ll figure something out :)
For now, though
Investing.com Stocks Revisit March Lows as U.S. 10-Year Yields Exceeds 5% for the First Time Since 2007!
… AND, on that note … THAT is all for now. Off to the day job…


Great analysis of the Q3 GDP !!!
Equivalent to 3 hikes...sounds about right...
Comrade Yellen has presided over an Explosion of National Debt and will be remembered
as the WORST Treasury Secretary is HISTORY...
She is DELUSIONAL and INCOMPETENT !!!
December FED Rate Hike, now, unnecessary......see LT yields....Powell needs to understand this...
Thank you..........
I want my car Oprah! FUNNY!