Good morning … unless yer short Earl (and sellin’ SMRs (Strategic Midterm Reserves)
Dunno ‘bout you but I’m sure wishin’ admin refilled the Strategic MIDTERM Reserves when they had chance (and when they said they would) … But then again, maybe, just maybe now are shorts time to shine? Momentum (stochastics, bottom panel) suggesting ‘Earl overBOUGHT and ripe for SOME retracement?
Whatever the case may / may NOT be, bond jockeys likely to be watching ‘Earl as one input to NEXT weeks CPI cuz, you’d think the Fed will be watching, too … But for now,
ZH: Oil Soars To New 2023 High After Saudis, Russia Shock With Extended, Expanded Production Cut
… Following this announcement Brent Nov’23 lifted from USD 88.50 to above $90 for the first time in 2023, while WTI Oct’23 rose from USD 85.55/bbl to USD 87.00/bbl, also the highest price of the year, and about to crush the Fed's hopes for a decline in headline inflation.
Bottom line: we now know that a year and a half later, the OPEC+/BRIC+ reaction to Biden's weaponized dollar is weaponized oil; may the least hopeless man win.
As for Biden, we wish him the best of luck refilling the SPR now that oil is about to hit $100 and rise above the price where the senile president sold most of the US strategic oil…
I know, I know, ‘Earl not going to be as big an input TO CPI and inflation expectations (or heck, since we’re denying everything, to consumer confidence and expectations, either RIGHT?) so why bother? I know, keep our focus on CPI super core and rent ‘flation … whatever it takes to NOT notice how much more prices at the pump gonna take OUT our paychecks … hey, at least we’ll get a cost of living raise.
We are gettin’ (another)one of those, right? I missed the first one so this NEXT one will be super helpful … Forget it … here is a snapshot OF USTs as of 647a:
… HEREis what this shop says be behind the price action overnight…
… WHILE YOU SLEPT Treasuries are slightly higher with the curve little-changed this morning- similar to their overseas brethren. DXY is modestly lower (-0.12%) while front WTI futures are too (-0.3%). Asian stocks were mixed, EU and UK share markets are all lower (SX5E -0.6%) while ES futures are showing -0.2% here at 6:30am. Our overnight US rates flows saw 2-way flows in intermediates during Asian hours amid super light volumes (60% of ave). In London's AM hours, a feature there has been three block flatteners (FV-US) added in futures totaling $1mln/01. Overnight Treasury volume was decent again (130% of ave) so the London session appeared quite active...
… Our first attachment shows the beautifully-defined (3+ points at each edge) bear channel that 10y Treasury yields have risen through since early May. This bear channel didn't catch the eye until playing around yesterday, but it shows Treasury 10's still comfortably in their bear phase which is news to nobody. It would take a >25bp rally from spot to reverse trend; so there's that.
… and for some MORE of the news you can use » The Morning Hark - 06 Sept 2023 and IGMs Press Picks (who CONTINUES to be sportin’ that new, fresh look) in effort to to help weed thru the noise (some of which can be found over here at Finviz).
From some of the news to some of THE VIEWS you might be able to use… here’s SOME of what Global Wall St is sayin’ …
Argus - Beware September (spooky seasonals at play — or is it gonna be different this time?)
The U.S. stock market tends to rise, not withstanding the performance in August 2023 (which featured a 2.1% slide in the S&P 500). The long-term upward trajectory has a foundation in the country's democratic political system and its market-based, capitalist economic system. In theory, the stock market efficiently allocates the nation's capital, generating solid returns. And then there is September. Indeed, our analysis of monthly returns going back to 1980 indicates that September is now the only month with an average loss. Not every September is negative. The month has a "win percentage" of 47%. But there have been some bombs, including 1986 (-8.5%), 2001 (-8.2%), 2002 (-11%), 2008 (-14%), and 2011 (-7.2%). Last year, the S&P 500 fell 9.3% in the month, and 2022 was a clunker with a loss of 4.8%. September is a transition month: the August doldrums are over and corporations get back into gear after Labor Day; the IPO market typically picks up; and the Federal Reserve meets, which can add to volatility. And sometimes, ominously, the third-quarter earnings season approaches. By the end of the third quarter, companies are pretty sure if they are on track to meet their financial targets. If they are not, and they pre-warn about disappointing results, investors can be quick to sell not just a company but an entire sector.
Losing momentum: We expect the global economy to catch its breath in Q4 as monetary policy weighs on demand and post-pandemic buffers wear down. We see the US sliding into recession, stagnation in the eurozone, a shallow recovery in China and tepid growth in emerging markets.
Last mile the hardest: Headline inflation is looking stickier after a swift decline, but our base case is that the growth slowdown will allow it to return to central bank targets, albeit over a long period and with the risks skewed to the upside.
Planning the route: We are bullish on rates through 2024 – especially in the US and especially at the front end – while lower liquidity and high bond issuance are set to lift term premia and steepen curves. Once core yields stabilise, we expect EM to perform, particularly Latam. We are moderately and selectively bearish on the USD.
In risk assets, we expect equities and credit to be range-bound in Q4 until specific trigger points are met. We think developed-market equities remain biased to the downside as earnings erosion weighs, with room for upside in EM and China.
… US rates: Around peak yields, cyclical considerations take over
US asset managers turned slightly overweight on equity risk in Q2, but increased the defensive tilt in their sector allocation, with utilities and healthcare favoured over financials or materials, our cross-asset positioning monitor found.
Similarly, in credit, funds increased their up-in-quality bias, with a significant underweight in high-yield but higher exposure to investment-grade credit.
Across regions, Europe remains an overweight position among equity funds although this trend is fading with positioning dropping over the quarter. Emerging markets are still least in favour.
In duration, portfolio changes were limited in Q2. Asset managers remain largely neutral in the US and hold a large short in Europe.
US long positions are concentrated in the front-end of the curve, while short exposure is most pronounced in the 10y and back-end segments of the curve in Europe.
US TIPS screen as one of the most under-owned asset classes in fixed income.
In FX, the long USD position was reduced marginally in Q2, primarily against the GBP and to a lesser extent the EUR. They remain long commodity-exporters in G10 (except Canada).
Favoured EM longs are the BRL, INR and MXN, while favoured shorts are the TWD, CNY and ZAR.
DBs - Early Morning Reid (with an excerpt / expert opinion on EARL and rates)
…This run-up in oil prices continues a trend that’s been going since the end of June, back when Brent was still only at $72/bbl. At the lows in June, Oil was c.-45% YoY. Now it’s nearly flat, down about -3% YoY as I type. The move has already had a clear impact on gasoline/petrol prices, and is expected to lead to some hot CPI reports in August, so the risk is that this further run-up will only add to those pressures in the September/October numbers. This could pose a tricky dilemma at a time when several growth indicators are already turning lower, particularly in Europe, since central bankers will have to decide whether to focus on above-target inflation, or whether they should ease up on rate hikes given the downturn in growth. It’s true that this won’t directly show up in core inflation since it's energy, but the risk is you ultimately get second-round effects in other categories. In addition, since central banks’ targets are still measured in headline terms, it’s going to be harder for them to pivot in a dovish direction the longer inflation stays above target.
Another factor that has likely added to the recent bond sell off has been the anticipation of unusually high corporate bond issuance, with over $36bn of debt coming to market in the US as it returned from the Labor Day weekend. The $120bn of dollar IG issuance expected this month is just a shade over the median September issuance in recent years, but we've gotten off to a flyer with perhaps some strong front-loading given corporate blackouts and the FOMC meeting later in the month. The pressure on US Treasury yields then comes as investors hedge the interest rate risk.
Coupled with the negative news on inflation, this drove a sell off across the curve. 10yr Treasury yields were up +8.3bps by the close to 4.26%, which builds on their +7.1bps move on Friday after the jobs report. This is the largest 2-session increase since early July. In the meantime, real yields were back near their highs for this cycle, with the 10yr real yield up +3.9bps to 1.96%, which is just shy of its post-GFC closing high of 1.98% on August 21…
DB - Monthly Chartbook: Back to the School of Hard or Soft Landings.. (for us visual learners, this chartbook a keeper)
Recent months have seen speculation build about a soft landing, with consensus expectations for a US recession down from 68% to 47% since May. Friday’s payroll number shows that things have now completely normalised on a spot and 3m moving average basis. But, to be a perfect soft landing, the rapidly declining momentum and downward revisions will need to stop soon. Otherwise, a soft landing will just be a pathway to a hard landing.
Indeed, if history is to be believed, we are entering the riskiest period for the economy over the next 6 months, when you the consider the usual lags from monetary policy or the 2s10s yield curve. Few cycles have already rolled over by this point, but many cycles have done so in this equivalent period coming up.
Elsewhere in the pack, we look at what happens after the last Fed hike in the cycle over the last 70 years, which is topical given the market now considers that the last Fed hike probably came in July. We also look at the extremes of US housing data, the tick up in delinquencies, the much higher-than-expected US budget deficit, the headwinds facing US treasuries, the recent weakness in Europe and China, and a look at the latest employment and inflation picture.
… Historically, the period around the last rate hike in the cycle marks the peak for the 10yr Treasury yield…
In conclusion, the soft landing story has gathered momentum and the data has softened nicely towards one. But, we are entering the peak lag period from policy tightening, and the crossfire from history will be most intense over the next couple of quarters. So, bear in mind that even if the data does look promising for a soft landing, unless there’s a sudden shock, any journey to a hard landing has to come via a stop off at the soft landing service station first.
… Fed Funds are becoming increasingly restrictive as headline inflation generally falls…
… A sharp uptick in gasoline prices is setting us up for a stronger August headline CPI print and perhaps beyond as base effects roll off for commodities.…
…Oil is approaching flat YoY for the first time since YE 2022. Was -45% YoY in June..
But over the last 3 months, core PCE inflation has been the slowest since this current upsurge began
Can the economy refuel enough to have a smooth journey ahead? The next few months are the most important. Any US recession before now would have been very early historically given all the lags. We’ll likely no longer be able to say that in 6 months’ time.
DB - How to unwind Treasury basis trades (sounds like a summer read / essay / homework assignment to ME and before eyes roll back into your head, thinking you should check this one out…)
Treasury basis trades are in the spotlight again. In Treasury futures, leveraged fund shorts, matched by institutional asset manager longs, have risen to new record heights, where they are now 23% and 12% above their 2019 peaks, respectively. Extreme short futures positions are a telltale sign of basis trades.
… An adverse scenario would be a rinse out of these positions. This could happen if futures suddenly rise in price – say if rates rally on the back of a significant weakening of the economy, as futures tend to lead in a rally – or if Treasury securities cheapen dramatically, for example due to a significant liquidity event where investors sell securities to raise cash. Such a move could trigger VAR limits and position stop-outs, potentially forcing a rapid unwind of the trade. This would be a repeat of the March 2020 scenario and is something that the Fed wants to avoid.
It's also possible that financial regulators act preemptively to clamp down on these positions out of concern for financial stability risks. However, as the Fed does not have direct supervisory power over hedge funds, it’s not entirely clear how they might go about addressing this.
This Friday, we get an update of the Q2 Flow of Funds data. We’ll be paying close attention to Treasury holdings by the Household sector, which captures hedge fund activities and where they have been rising sharply over the same period as the increases in leveraged short futures positions.
FirstTrust - Monday Morning Outlook - Fiscal Madness (the conclusion…reminds of that idea of laws of gravity NOT YET having been repealed … still it is so that we’re debating HARD landing now SOFT or NO landing whatsoever … )
Back in the 1980s, President Reagan took enormous political heat (Sam Donaldson comes to mind) for being fiscally irresponsible. His offense? Presiding over a budget deficit that peaked at 5.9% of GDP in Fiscal Year 1983….
… We are supply-siders. We think the key to long-term economic growth is removing barriers and disincentives to work, save, and invest. We do that with lower tax rates, smaller government, and less regulation. We think institutions matter, like democracy, property rights and freedom of contract. We are not Keynesians. But even John Maynard Keynes must be rolling over in his grave. No serious or intellectually honest Keynesian can support a deficit at 6.5% of GDP (much less 7.8%) in a year when the US is at peace and unemployment is averaging 3.6%.
… We think that the unprecedented surge in the deficit this year is a key reason why a recession has yet to materialize. A surge in the deficit this large can sometimes artificially maintain growth in the very short-term. But, given higher interest rates on government debt, this kind of support can’t last. The party continues for now, but a hangover looms in our future.
BOTTOM LINE: Saudi Arabia and Russia announced an extension of their unilateral additional output cuts by three additional months through December 2023, exercising elevated OPEC+ pricing power. As markets did not fully anticipate the news, Brent rallied 2-3% to $91/bbl. We see two bullish risks from today’s news to our oil price forecast of $86/bbl for December 2023, and $93/bbl for December 2024. First, the mechanical upside risk to our December 2023 forecast from a 500kb/d Saudi Q4 supply miss (vs. our balances) is roughly +$2/bbl. Second, a bullish scenario where 9 OPEC+ countries do not reverse half of the 1.7mb/d cut announced in April 2023 in January 2024 suggests a mechanical $14/bbl of upside risk, which would put Brent in December 2024 at $107/bbl. This is not our baseline view because we think the producer group is unlikely to pursue prices well above $100/bbl given the strong supply and investment response to the 2022 energy crisis, our high-frequency tracking of US shale, and the political importance of US gasoline prices.
Goldilocks - Global Markets Daily: Historical Bear-Steepening Episodes and Cross-Asset Performance (I’d have thunk the idea / title of BEAR steepening would have spoiled this one’s conclusions …whatever the case MAY / may not be, bear steepening isn’t your average steepening… )
… Most bear-steepening episodes have been characterized by a supportive US macro backdrop, with positive macro surprises, improving growth momentum, and low inflation. As a consequence, bear-steepening regimes have generally been risk-on: equities delivered strong positive returns as higher growth expectations helped them digest rising real rates. That said, the equity/bond correlation often turned less negative and even shifted positive for short periods of time (for example, during the 'taper tantrum' in 2013).
While further bear-steepening episodes are possible, we think a prolonged bear-steepening regime remains unlikely. If there is renewed bear-steepening, it might drive a less 'risk on' rotation across assets compared with the past as below-trend growth limits the ability of risky assets to digest further real rate increases. The drivers of the bear-steepening will matter the most: higher growth optimism would be supportive for equities, while a rise in fiscal risk premium (for example, due to concerns around higher long-run fiscal deficits in the US) could weigh on risky assets.
… While periods of steepening are not unusual for the US yield curve, bear-steepening episodes have been relatively rare (7 since 1950) and tend to be shorter (half of them lasted less than 6 months) than bull-steepening episodes (Exhibit 1)
INGs - Rates Spark: Dis-inversion from the back end (not sure I’m a fan of RATIONALIZING any sort of move BUT we all do it each and every day so why not with regards TO rates moves…)
We rationalise why US longer tenor rates are rising – basically, the curve is inverted and getting used to discounting structurally higher rates. If so, reversion to a normal curve must mean dis-inversion from the back end. When something breaks, that will change. But for now, it's more of the same: upward pressure on long yields
The Brent crude oil benchmark moved above USD90 per barrel, following reports of an extension to production cuts by Saudi Arabia and Russia. This will likely trigger angst about inflation. Oil prices in late 2022 were moving around USD80 per barrel. However, deflation forces for durable goods and disinflation forces as profit-led inflation is squeezed are still in place. If the oil price persists at current levels, it may slow disinflation rather than reignite inflation.
Slower disinflation may worry markets focused on Federal Reserve Chair Powell’s policy gyrations. Past evidence does not inspire much confidence. However, Fed governor Wallace—a hawk—was sounding quite benign about the necessity of future rate hikes in comments overnight…
Yardeni asks - What Could Go Wrong In September? (dunno if i wanna know his answers here … good thing EARL is behind the paywall, amIright? whatever the case, have at visual of EARL just above)
On Sunday, we observed that September is a good month for picking apples. It is widely viewed as a rotten month for stocks, which has been true during 55% of Septembers since 1928. But those selloffs have often turned out to be good opportunities to pick fallen stocks just in time for a yearend Santa Claus rally.
The S&P 500 fell today back towards its 50-day moving average (chart). What could cause the index to drop below that to find support at the 200-dma, which is currently at the bottom of the bull market's channel? Consider the following seven possibilities:
(1) Bond yield. The 10-year Treasury bond yield closed back above 4.25% today. It did so in response to rising oil prices. In addition, investors and traders are jittery about next Wednesday's CPI report for August. And, of course, there is the uncertainty about what the FOMC will decide to do on September 20. Meanwhile, the Citigroup Economic Surprise Index has been falling recently, which should be bullish for bonds, though it did edge up today (chart).
(2) Oil prices. Today, Saudi Arabia said it will extend its voluntary production cut of 1.0 mbd through yearend. The oil bulls may also be betting that China's government will stimulate the Chinese economy, boosting oil demand. These developments heighten inflationary concerns. Meanwhile, US crude oil field production jumped to 12.8 mbd at the end of August (chart).
AND from the intertubes in response to YESTERDAYS recession probabilities being SLASHED by Goldilocks,
ZH: Three Reasons Why Goldman Is Dead Wrong In Slashing Recession Odds To Just 15%
AND in response TO Saudi news driving EARL
WolfST: Crude Oil WTI Jumps to Highest since November, as SPR Gets Refilled, Saudi Arabia & Russia Extend Production Cuts WolfST: Gasoline Prices Rise Year-over-Year for First Time since Feb 2022: CPI Inflation to Feel the Heat this Year
Last week, signs of a cooling labor market strengthened conviction that the Federal Reserve is done hiking rates and the economy is headed toward a soft landing. But there was no bond rally. Instead, 10-year Treasury yields have risen and aren’t far below August’s peaks. That suggests the recent trend of pushing long-term rates higher remains intact. How high could they go? As high as the fed funds rate, which means we should be thinking of 5.5% more than 4.5% as the upper bound.
Long-term yields could hit 5.25% or higher
It’s interesting. The Fed has been raising its short-term interest rate for a year and a half. But only in the last few months or so have long-term interest rates responded decisively. After a breakout in late 2022, longer-term yields wobbled as fears of a recession dominated the markets. These concerns peaked with the Silicon Valley Bank crisis in March. But since that situation was resolved, long-term rates have drifted steadily higher as an economic downturn is priced out of the market.
To be clear, I’m still not in the no-recession camp yet. I think the economy will still falter, maybe as soon as the end of this year. But that doesn’t matter for investors, since the operative question is the same regardless: how high can these rates go?
Some investors are talking about 4.5% for a 10-year Treasury, which not only would mean debtors would be still paying less to issue riskier, longer-maturity debt, since short-term rates are still higher than that. It’s also only just a smidgen higher than where we are today at around 4.25%. Bank of America Corp. has gone all the way to 5%. Me, I’m sticking to my 5.25% bogey. And rates might go even higher still, if this business cycle continues to surprise to the upside.
That’s bad news for those taking out a new mortgage and for lower-rated corporations looking to refinance debt. But it’s a blessing for savers and lenders.
Chart of the Day: Brent Crude Oil has been well supported above its rising 55-day average, and also maintains its break above its long-term 200-day average to leave the market undergoing a concerted test on the upper end of its medium-term range at $88.10/$89.37. As we highlighted in our spotlight back in August – The Energy threat – a close above here would be seen to mark an important base to turn the broader trend higher, with just initial resistance then seen at the 38.2% retracement of the 2022/2023 downtrend at $96.48. Such strength would likely be accompanied by higher Inflation expectations and likely higher US Bond Yields, which would likely in our view pressurize equities.
The S&P 500 recovery has been capped just ahead of resistance at 4551/77 and we look for the near-term risk to turn lower from here.
Nasdaq 100 is seen at risk to a fall back to support at 15220.
The Weekly S&P500 #ChartStorm - Off-Topic ChartStorm: US Treasuries (oh boy) Bond market update: drawnout drawdowns, bond yield outlook, cash rates, macro indicators, inflation risks, and implications for the stockmarket...
Learnings and conclusions from this session:
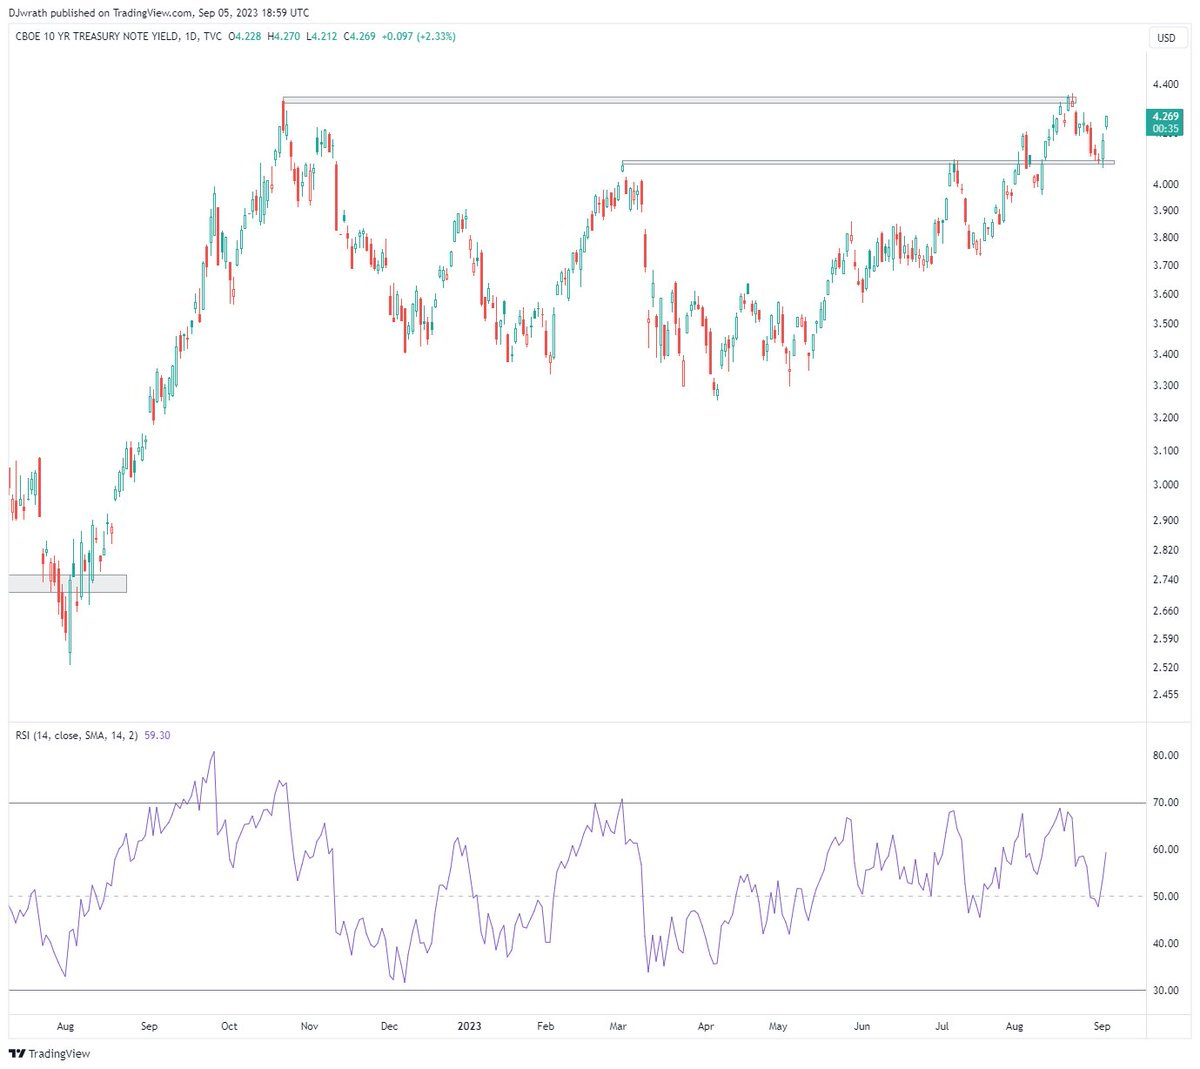
On the technicals, bond yields are caught between short-term support and resistance, but the upward momentum is fairly clear and compelling.
The PMIs however point to (much) lower bond yields ahead.
Yet the long-term inflation model says higher for longer.
History tells us treasuries outperform in recession and bond bulls need to wait for the Fed to pause and/or ideally pivot to rate cuts.
Meanwhile, stocks look stretched vs bonds (+at risk if yields push higher).
Overall, there’s definitely a case to be made for some further upside in bond yields, but equally building evidence for the downside case. I would say it’s just a matter of timing, and in that respect we need to listen to price while keeping macro in mind.
1. Bond Yield Technicals: I thought this one would be a good starter as it lays out the tactical situation for US 10-year bond yields. The first point to note is actually the steady uptrend that began off support from around May this year (which also involved it breaking above its 50-day moving average, and flawlessly maintaining that textbook breakout ever since). But of interest with the annotations in the chart is the recent initial rejection of resistance, and bounce off short-term support. These are important trigger levels in my view, if we break that upper resistance level then we go to new highs in bond yields, while a break of support (and the 50dma) would place a move lower in yields on the table. Given the strong upward momentum in yields, the odds would favor a break higher.
6. Cash Rates vs Bond Yields — Global Perspective: Indeed, it’s not just the Fed, if we look across developed markets through time, for bonds to sustainably perform and yields to move lower, you really do need to see cash rates peak and for central bankers to shift into rate cutting mode (which, by the way, EM central banks are already in the early process of doing so, after being first to pivot to hiking back in 2021).
no such thing as bad question (wife's a teacher!) and prolly stoopid of ME but something I picked up from working with my dad for YEARS ... slang. think of it bein' said with accent and referring TO it - CRUDE - as a person, dunno ... really doesn't make much if any sense at all just something I cannot get OUT of the habit ... NOT something i've seen / heard others mimic SO ... it's not you its ME
Thank you for great article, it’s a great way to start the morning! i would be interested in reading the DB article on steepners if there’s anything else to it.