(USTs 'sharply steeper after the 20y JGB auction saw a historic tail (+7bps)')while WE slept; HARD landing becomes NO landing; FOMC minutes SAY ... whatever you wanna see?
Good morning … There was a situation overnight in Japan which may very well go underneath the radar screens but with BoJ top of mind as of late and supply / demand INBALANCE, generally speaking (more below) I offer a couple resources from the www
An horrible 20-year JGB auction today tailed the most since 1987, showing that investors require a higher yield to buy JGBs. Rising JGB yields threaten bonds worldwide, so we see EU and US sovereign yields accelerating their rise this morning.
…What happens in Japan never stays in Japan ... Japanese 20yr bond auction had the longest tail since 1987 overnight, which induced a buyers strike globally in duration and, in particular, aided the steepening of the US2s10s curve. If the Japanese investors are getting more yield at home, then their compression of global yields will be less... more fromThe Gryning Times
Rates are up ‘round the globe this morning producing h’lines such as this from BBG
Global sovereign yields reach highest level since 2008 Global yields on government bonds have surged to their highest levels since 2008 as robust economic data dashed investor expectations of a halt in central bank interest-rate hikes. Resilient economic conditions in the US and other countries are challenging predictions of a recession, prompting investors to shift allocations towards riskier assets, while concerns about supply and liquidity continue to drive the selloff in longer maturity notes
GLOBAL RATES UP - including 5yy US — up and OVER 4.38% and it will be important to check in at weeks END to see how / where things are in relationship. For some bigger picture context, a WEEKLY look at the belly
Clearly things are breaking bad for those who are LONG of bonds … For a look at THOSE,
… Treasury yields keep marching higher despite signs there is plenty of demand from investors betting the dips on the market are worth buying because the Federal Reserve will soon cease interest-rate hikes. The Bloomberg index tracking total returns on the debt is now down 0.1% for 2023, after indicating a 4% year-to-date gain in early May.
This month’s rout has come even as two of the three increased auctions held so far this month went off smoothly, and as a range of investors and strategists said 10-year yields above 4% are a good buying opportunity. Taking the longer view, the extra interest payments they are getting could let many buyers ride out the current turmoil. Still, with those yields now within 10 basis points of last year’s multi-year high of 4.3354%, the concern is that at some stage we will see a capitulation that would set off a steeper sell-off. For all of the pain delivered this month, volatility has remained relatively contained. Asset managers lifted their net longs to a fresh record in the week to Aug. 8, the latest CFTC data show, underscoring the level of exposure out there…
AND … here is a snapshot OF USTs as of 705a:
… HEREis what this shop says be behind the price action overnight…
… WHILE YOU SLEPT Treasuries are sharply steeper after the 20y JGB auction saw a historic tail (+7bps), with heavy trading through the Asia session (>150% 30d volumes). While there was a 645k/01 FV buyer in early London, the market recovery was only temporary as we trade back to lows into the US open. USTs are underperforming, but Gilts and Bunds are also retesting cycle extremes on convicted volumes, curves uniformly steepening (UST 2s10s +5.5bps). APAC risk-aversion was seen, perhaps a bit more reserved, as SHCOMP eked out a 0.4% rise, while other regions were marginally in the red: NKY -0.4% and KOSPI -0.2%. DAX futures are close to flat here, and S&P futures are marked at +6pts currently.
From some of the news to some of THE VIEWS you might be able to use… here’s SOME of what Global Wall St is sayin’ …
MOST of what follows BUT NOT ALL will be related TO yesterday afternoons FOMC meeting minutes (SOURCEin case you have any trouble sleeping at night…) and while I have NOT YET read them in their entirety, cover to cover, it would seem to me to be a somewhat more HAWKISH set of meeting minutes than I would have expected especially given the HARD, SOFT … wait NO LANDING narrative that has grown in support … To wit, NO LANDING gathering some support from Atlanta
The GDPNow model estimate for real GDP growth (seasonally adjusted annual rate) in the third quarter of 2023 is 5.8 percent on August 16, up from 5.0 percent on August 15. After this morning's housing starts report from the US Census Bureau and industrial production report from the Federal Reserve Board of Governors, the nowcasts of third-quarter real personal consumption expenditures growth and third-quarter real gross private domestic investment growth increased from 4.4 percent and 8.8 percent, respectively, to 4.8 percent and 11.4 percent.
The next GDPNow update is Thursday, August 24. Please see the "Release Dates" tab below for a list of upcoming releases.
Hmmm ok then on TO what Global Wall Street is sayin / sellin…
Barcap - July minutes: 'Critical' that policy be sufficiently restrictive (interesting turn of phrase … and nothing beats Fed watchers counting words … )
The minutes of the latest FOMC meeting reveal that policymakers were facing a hot economy when they raised rates in July. As they seek a sufficiently restrictive policy stance and below-trend growth to bring inflation back to 2%, we maintain our call that the FOMC will proceed with a 25bp rate hike at the November meeting.
… Since the minutes were first published in 1993 in their present form, we think it is the first time the minutes refer to the word "critical" in reference the monetary policy stance. In the past, the word "critical" was used in describing the need that inflation return to the inflation target, or in other contexts, but not in reference to the policy stance (Figure 1).
Bloomberg / John Authers OpED (Fed MIGHT be finished but what ‘bout bond market … asks and attempting to answer, visually, just below…)
…Minutes Waltz The minutes from a Federal Open Market Committee meeting rarely surprise. Those from last month’s gathering, published Wednesday, were no exception. But they couldn’t be ignored.
The main concern was — and still is — the persistence of inflation, which may merit more rate hikes. After all, Fed Chair Jerome Powell, following the July decision to raise rates by 25 basis points, emphasized that each meeting will be “live,” meaning open to evaluation depending on the data at hand.
In the minutes, “most” FOMC members still see significant upside risks to inflation and “several” still believe significant disinflation is yet to become evident in the “super-core” measure (services excluding shelter). But they continue to suggest a committee that’s cautious of being too hawkish, said Bloomberg Economics’ Stuart Paul. “Though the post-meeting statement and votes showed a united committee, the minutes confirm there’s a dovish contingent and that bond-market bets on a finished rate-hike cycle are likely accurate,” he wrote. Paul added that a pause is likely in September to preserve the unanimous voting block.
That judgment is shared by the fed funds futures market, which has been remarkably stable for the last two months. It’s consistently seen a small chance of another hike by November, when the terminal rate is predicted to be reached. The FOMC meeting didn’t shift that expectation, and neither did the publication of the minutes:
The benign Consumer Price Index reports of the last two months are not “sufficient” for the Fed to “feel comfortable enough to stop hiking,” said Stephen Stanley, chief US economist at Santander US Capital Markets. The unsolved part of the equation is the labor market. “Fed officials are Phillips Curve adherents to their core, so they are not likely to ignore the red-hot labor market.” (Phillips Curve is an economic theory that states inflation and unemployment have an inverse relationship.) For hawks, Stanley highlighted this line, which suggests the Fed is ready to over-tighten:
Participants continued to view a period of below-trend growth in real GDP and some softening in labor market conditions as needed to bring aggregate supply and aggregate demand into better balance and reduce inflation pressures sufficiently to return inflation to 2% over time.
“Resilience in the incoming data was the main cause for optimism, while concern about tighter credit conditions was an important reason for caution,” wrote Michael Feroli, chief US economist at JPMorgan Chase & Co. “Both the staff and the Committee appeared to be similarly unsure about the direction of growth and inflation.”
Based on quarterly projections last updated in June in the so-called “dot plot,” most FOMC members favor another increase in 2023. But the minutes suggest they’re in no rush to hike again in September, said Paul Ashworth, chief north America economist at Capital Economics. And yet, bond yields have risen since the FOMC three weeks ago, and rose more after the minutes came out. They’re at their highest for the year — and almost since 2007 — topping the peak that prompted the brief banking crisis back in March:
So even if the Fed is done hiking, it appears the bond market isn’t. That implies that the market perceives a risk that inflation isn’t going to come all the way back to 2%, and that higher rates will be bedded in. That's the issue that Powell and his colleagues, and the money markets, will increasingly have to deal with.
BMO - FOMC Minutes: More Tightening Possible, but Risks Two-Sided (would seem to counter THE main headline — of “SIGNFICANT UPSIDE RISKS…” … worth noting as these folks ARE the best in the biz…)
The FOMC minutes reiterated many of the core themes that Powell delivered at the July press conference. While the Committee acknowledged the lagged impact of monetary policy and the delayed credit tightening implications of the banking crisis, that will not prevent future tightening given the significant upside risks to inflation. "With inflation still well above the Committee's longer-run goal and the labor market remaining tight, most participants continued to see significant upside risks to inflation, which could require further tightening of monetary policy."
However, there were some participants that could have supported no hike in July, "They judged that maintaining the current degree of restrictiveness at this time would likely result in further progress toward the Committee's goals while allowing the Committee time to further evaluate this progress." There was also the observation offered that the risks to the Fed's goals are becoming more two sided, and labor demand is easing, which should help bring the jobs market back toward equilibrium.
Yields were at the highs of the day going into the minutes and the market has responded modestly bearishly, although the limited new information within the release failed to inspire a dramatic price reaction. There was nothing here to derail our assumption that September will be another "skip", although another hike in November or December is firmly on the table if the data warrants.
Bloomberg BNP - US July FOMC minutes: Confident in monetary restriction, uncertain on the timing
KEY MESSAGES
The July FOMC minutes showed a committee that believes policy has turned sufficiently restrictive to slow the economy, but continues to see the timing of this impact as highly uncertain.
The minutes contained notably fewer counting words than recent editions – perhaps reflective of this uncertainty.
Data since the July FOMC meeting has been mixed, with inflation and payroll growth moderating while other activity metrics accelerated.
We continue to think the Fed reached its terminal rate for the cycle in July and will hold rates steady at 5.5% until Q1 2024.
… Notable reduction in counting words: The July minutes contained a stylistic change, wherein they used conspicuously fewer counting words than past editions. The chart below shows the number of words such as “a few”, “several”, “most” and “many” declined from June, whereas “participants” without any counting qualifier was used with considerably greater frequency …
DB - Q3 GDP update: Appetite for consumption (we interrupt this FOMC minutes recapAthon for a few words on consumption + investment + govt spending + net exports = … commentary … and looks to me to be quite an UPGRADE)
The July retail sales report indicated a significantly stronger start for Q3 consumer spending. In particular, retail control increased 1% month-over-month in July (vs. +0.5% previously) , which was the strongest monthly gain since January (+1.7%).
Given that the July level of retail control is tracking up 6.2% annualized relative to its Q2 average, we have revised up our Q3 forecast for real PCE growth to 3.6% (from 1.1% previously). This upgrade had the effect of lifting our Q3 real GDP growth projection to 3.1% annualized (from 1.5% previously).
At this point we have not made any changes to our broader outlook. Indeed, as we discussed recently (see “Consumer outlook: Living (longer) in a material world?”), there are several headwinds facing US consumers over the coming months. However, the undeniable resilience over the first half of the year and strong start out of the gate in Q3 have raised the probability that the economy may avoid slipping into recession – at least in the near term (see "Recession or soft landing: Is disinflation different this time?").
Goldilocks - FOMC Minutes Highlight Range of Views Over Extent of Tightening and Stress Data Dependence
BOTTOM LINE: The minutes to the July FOMC meeting noted that “almost all” participants agreed that a 25bp hike at the July meeting was appropriate, while “a couple” of participants preferred leaving the federal funds rate unchanged. Participants emphasized that “the data arriving in coming months” would help clarify the extent of additional tightening needed to return inflation to the Fed’s 2% target. Although participants continued to see “significant” upside risks to inflation, they noted several tentative signs that price pressures were easing. The Fed staff no longer expected the economy to enter a recession, although it saw downside risks to growth stemming from “additional monetary tightening” that could be needed in response to “higher and more persistent inflation.” FOMC participants noted that GDP growth remained resilient in the first half of 2023, but that “a gradual slowdown in economic activity … appeared to be in progress” and that tighter credit conditions would likely weigh on growth in coming quarters.
The Federal Reserve cites inflation concerns as a reason to keep further rate hikes on the table, but splits are starting to form. We expect a September pause that will end up lasting well into the first quarter of 2024 when rate cuts will come onto the agenda
Last week’s release of the Consumer Price Index (CPI) was the second month in a row that showed inflationary pressures were falling at a faster pace than economists’ estimates, which is undoubtedly good news. Additionally, the fall in inflationary pressures likely means the Federal Reserve (Fed) is close to the end of its aggressive rate hiking campaign, which we outlined in our recent Midyear Outlook, has historically been good news for core fixed income investors. So why haven’t Treasury yields fallen (prices increase) alongside the fall in inflationary pressures? The main reasons, in our view, are listed below:
Supply/Demand Imbalance: Because of larger than expected budget deficits, the Treasury department announced recently that it seeks to borrow an additional $1 trillion in the third quarter alone (and nearly $2 trillion over the rest of the year). This is on top of the $1 trillion of new debt that has been issued since the debt ceiling was removed in June. The increase in supply is coming at a time when the largest owner of Treasury securities (the Fed) is reducing its footprint in the market.
Non-U.S. Central Banks: While inflationary pressures are indeed falling in the U.S., the Eurozone and the United Kingdom are dealing with still elevated inflationary pressures. As such, those respective central banks are likely not done raising interest rates. Moreover, the Bank of Japan (BOJ) recently announced it would “conduct yield curve control with greater flexibility”. Essentially, this means the BOJ will allow the yield on the 10-year government bond to increase by another 0.50%. Higher yields on non-U.S. domestic government bonds impact U.S. Treasury yields, to certain degrees, as well.
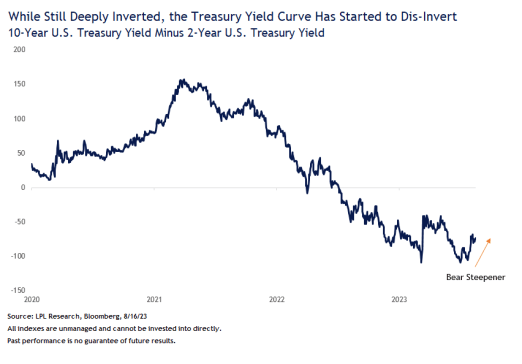
Better U.S. Economic Data: As evidenced by the inverted yield curve (chart below), the U.S. Treasury market has been pricing in an economic slowdown for several quarters now. However, economic data continues to surprise to the upside. The continued strength of the U.S. economy, in spite of one of the most aggressive Fed rate hiking campaigns in decades, has caused the bond market to start to price out the immediate risk of recession. Moreover, it is pricing out the immediacy of interest rate cuts as well. The higher-for-longer narrative by the Fed has put upward pressure on intermediate and long-term yields. Historically, these “bear steepener” trades don’t tend to last very long, but as long as the U.S. economy outperforms expectations we could continue to see upward pressure on intermediate and longer-term yields.
Our base case remains that the U.S. economy will slow down/contract due to the elevated interest rates caused by the Fed rate hiking campaign. So, while we still think the 10-year yield ends the year lower, as long as economic data continues to surprise to the upside, Treasury yields may remain above our 3.25%–3.75% target range in the interim. However, it’s important to remember that, over time, starting yields are the best expectation of future returns and that the coupon income, and not price appreciation, is the largest determinant of total returns regardless of what happens to interest rates in the near term. And with starting yields for most fixed income markets well above longer-term averages, we think the prospects for fixed income are as attractive as they have been in quite some time.
MS - FOMC Minutes: Teeing Up Jackson Hole (wait, what? they play golf at Jackson Hole? I thought they only fished and talked policy…)
Bottom line: The minutes of the July meeting revealed continued disagreement over policy lags and the need for further tightening. While there was a unanimous vote to hike in July, there were two participants among the FOMC that would have dissented. Participants remain highly attentive to inflation risks, but there is no decision made yet for the September FOMC Meeting, commenting "upside risk to inflation could require further tightening." This tees up Chair Powell for Jackson Hole next week where we expect him to maintain that September is a live meeting based on incoming data and policy lag uncertainty remains high. We continue to see a path to a consensus on no further hikes.
AND for those of us who are visual learners,
AllStarCHARTS: 3 Charts You Need to Watch
… there are 3 main charts that we have on our radar.
The first one is in credit. If we're enterring into a new bear market, or an aggressive period of high volatility, you are likely to see that stress in the bond market. If Treasuries begin to outperform High yield, it's evidence of that stress.
The next one is in High Beta vs Low Volatility stocks. This ratio tends to move very closely with the averages. If you start to see a bid in Low Volatility stocks relative to High Beta, then this correction is likely to be more severe.
And finally the Consumer Discretionary vs Staples. Similar to the High Beta / Low Vol ratio, this tends to signal rotation into more defensive areas of the market.
Here's what that looks like:
This is what's on the radar.
The correction we're seeing in the major indexes is perfectly normal for this time of the year, and setting us up for a November-December rally to finish up 2023.
Global bond yields have started to worryingly rise again and as we highlighted last week, of most concern technically is the move higher in 10yr US Real Yields, where a large bearish continuation pattern looks to now be in place above the 1.82% high of October 2022. We believe such a meaningful rise in Real Yields is likely to signal a broader “risk off” phase, with CS Global Risk Appetite now also seen even closer to establishing a top. This would reinforce further our current tactical negative outlook for Equity markets, as well as we think likely lead to further strength in the USD.
We thus look for further weakness in the S&P 500 and for a break of its medium-term 63-day average at 4,392 for a test of support next at 4,328/4,302. Failure to hold here would be seen to expose the 38.2% retracement of the 2022/2023 uptrend at 4,181.
Bull-Bear “Retail” sentiment has also risen to the beginning of what we see as its “typical” extreme, further reinforcing a cautious stance for US equities.
US Macro Surprise Data is also showing tentative signs of rolling over…
… Whilst this key support should continue to be respected, resistance at 4.10/08% holding can keep the immediate risk higher to suggest weakness can extend to the upper end of this zone at 4.40/4.405%. A weekly close above 4.405% would be seen to mark an important break higher with next support then seen at 4.50% ahead of 4.72%.
Below 4.08% can ease the immediate pressure off long-term support, but with a move below 3.95% needed to mark a near-term yield top and more concerted turn lower again.
Today’s Chart of the Day was shared by Liz Ann Sonders (@LizAnnSonders). The US 10-year Treasury yield broke out to a 15-year high today. It peaked last October, around the same time the S&P 500 bottomed. It's formed a 10-month base since then, and it looks ready to resume its uptrend. Stocks have pulled back on the heels of this resurgence in yields. Growth stocks are particularly sensitive to rising yields, as the opportunity cost of holding these long-duration assets becomes greater as yields rise. To make matters worse, the US dollar is also putting pressure on stocks as $DXY reached a two-month today. The wrecking balls of 2022 are making an ominous comeback, and stocks are starting to notice.
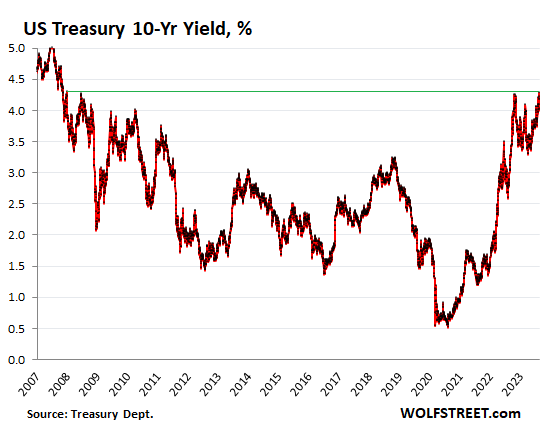
WolfStreet- Ten-Year Treasury Yield Hits 15-Year High, Market Wades out of Denial, Sees “Higher-for-Longer,” Tsunami of Issuance, QT
The 10-year yield closed at 4.28% today, according to Treasury Department data, the highest since, well, let’s look here, November 14, 2007, so about 15 years ago, having edged past November 2022 and June 2008 by a hair. 2007 is notable in that it was the last year before the arrival of QE …
… The entire sucker-rally from November last year through May this year has now been mopped up.
… And when inflation gets bad enough, and keeps dishing up nasty surprises as it did in the 1970s and early 1980s, well then 5% may not be enough either to entice enough buyers to absorb the tsunami of new issuance. Ironically, looking back over the long term, that 5% to 6% range wasn’t a bad place to be for the economy, such as in the 1990s (circled in the chart below), but asset prices were relatively speaking a lot lower.
Great point and questions and saw Yardeni getting more Bobble Head TV time — not alone in askin bout vigilantes .. should be an all points bulletin. And I’ll be honest I’m thankful u didn’t suggest BITC as flation hedge 😀
Serious question: this notion of the Bond Vigilante seems a romanticization at this point. Where is this mythical beast to be found in the wilds? I have my own theory-that they're retired and/or departed. And if age didn't get them to tap out, then subsequently there was this IMO Extinction Event that took place circa 2008: The advent of QE. QE's even slayed Gold, for a time anyways. But may I suggest (excluding my Gold-Bug bias), NEVER count out Gold. Just ask the BRICS nations. Thanks Steve!