Good morning … Unless yer still hoping for economic miracle and global inflation to be sponsored BY China,
RTRS: China's July factory activity swings back to contraction - Caixin PMI
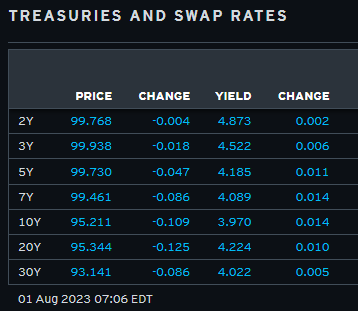
… here is a snapshot OF USTs as of 706a:
… HEREis what this shop says be behind the price action overnight…
… WHILE YOU SLEPT Treasuries are sharply mixed this morning with the Tsy curve pivoting steeper around a little-changed belly. The overnight events/releases are summarized above, DXY is higher (+0.3%) while front WTI futures are lower (-0.6%, see attachments). Asian stocks were mixed, EU and UK share markets are lower (SX5E -0.9%, SX7E -1.2%) while ES futures are showing -0.25% here at a way early 6:25am. Our US rates flows saw a modest bull-steepening during Asian hours, helped along by the RBA's somewhat unexpected hold on rates at 4.1%. We had fast$ buying in intermediates and buying from real$ in the long-end. We were too early for London hours color and overnight Treasury volume was ~90% of average overall and through 6:30am NY time.
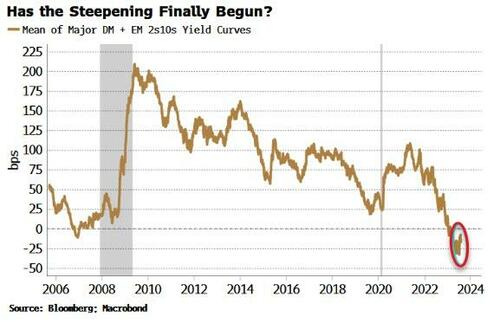
… US 2s10s real rate (TIPS) curve, weekly: Over the past ~16 months, this curve has flattened a remarkable -375bp, peak to trough. Now our short and medium-term momentum work hints of an increasing upside skew of risks for this curve. This weekly chart shows medium-term momentum in the lower panel and how it appears on the cusp of confirming a new upside-steepening signal as soon as the end of this week. If achieved, such a reversal would no doubt offer needed cheer to those in the curve steeper camp...
S&P Div Yield - 3mo Bill rate, monthly: Last night Ed posted an article discussing how stocks look increasingly over-valued versus bonds, hinting of a risk to equities via the portfolio balance channel. Well, we post this time series as a companion to that piece because this series goes back to ~1970 to provide some historical context.
… and for some MORE of the news you can use » Finviz …
From some of the news to some of THE VIEWS you might be able to use… here’s some of what Global Wall St is sayin’ …
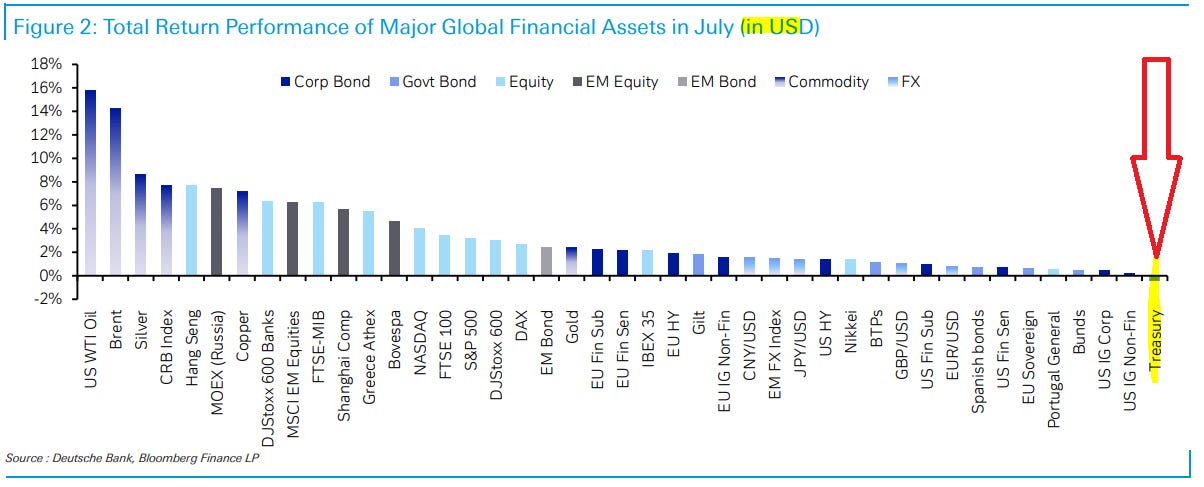
After a mixed performance in June, July was largely positive for assets across the board. Oil stole the show, as supply cuts spurred upward pressure on prices, and the AI excitement saw the S&P 500 and the NASDAQ extend their rally, both securing their fifth consecutive month of positive total returns. However, fixed income took a hit in July, as central banks continued their hiking cycle. Although the market expects that this is likely the last hike for the Fed and ECB, risks remain to the upside, particularly for the latter, as the euro area continues to face inflation far above its target level. All-in-all, we had one of the strongest month in performance terms since January, with 32 of the 38 non-currency assets in our sample ending July in positive territory. In YTD terms, 36 out of 38 non-currency assets are in the green.
Month in Review - The high-level macro overview The first half of July was largely mixed. The US payrolls number for June came in at +209k, the softest since December 2020. Even with the deceleration in the headline number, the overall report remained relatively firm, and it was clear there was still heat in the labour market. Indicative as such, the unemployment rate came down from 3.7% in May to 3.6%. However, positive inflation news arrived in mid-July when the US economy recorded its weakest core CPI result (+0.16%) since February 2021, for the month of June. Following this was the PPI for June, which came in at just +0.1% month-on-month, taking the year-on-year PPI close to deflationary territory at 0.1%, down from 1.1% in May, its lowest level since August 2020.
Taking these developments together, the Fed elected to remain cautious, hiking by 25bps in July and lifting the policy rate to 5.375%, just above the peak that occurred prior to the GFC. The decision was affirmed by subsequent strong data, with US Q2 economic growth at +2.4% (vs +1.8% expected) and US weekly jobless claims recommencing a downward trend…
… Faced with mounting evidence of a robust US economy and a relatively hawkish Fed, US fixed income largely sold off over the month. US Treasuries fell -0.4%, the worst performing asset for July. Bunds also fell back but saw a somewhat more modest decline of -0.3%. In contrast, UK gilts relatively outperformed (+0.8%) after the largest downside surprise in two years in the CPI data for June, which fell from 8.7% to 7.9%…
… Which assets saw the biggest losses in July? US fixed income: US Treasuries fell back -0.4% as investors became increasingly sceptical of Fed cuts occurring anytime soon following hawkish commentary during the latest policy meeting, even as the policy rate reaches what is likely the end of the Fed’s hiking cycle.
AND from the month that was to the SLOOS which was and I offer this all to you as IF we all don’t know ZeroHedgeexists!!
Barcap US Economics: July SLOOS shows some incremental tightening in lending conditions
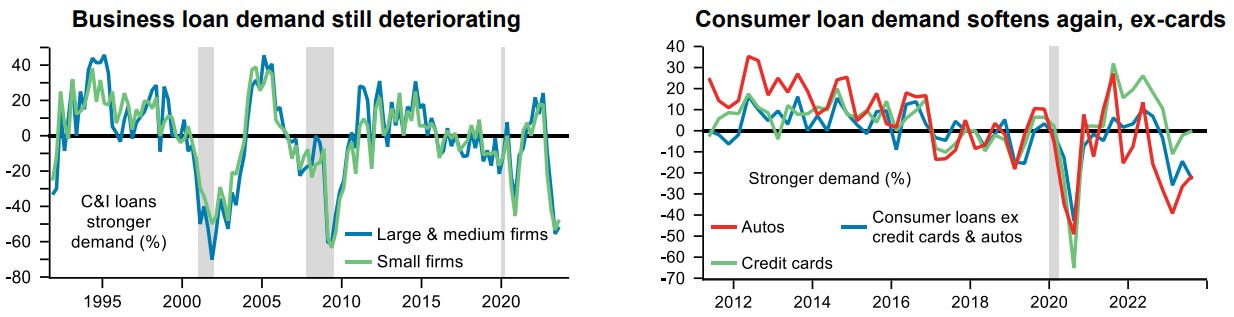
The July Senior Loan Officer Opinion Survey on Bank Lending Practices (SLOOS) showed some additional tightening in lending standards and weaker demand for loans, except for credit cards loans, in the second quarter.
The Fed’s latest Senior Loan Officer Opinion Survey (SLOOS) supports the notion that past policy tightening is still percolating through the US economy, leaving intact our view that additional policy rate increases are unlikely.
The data indicated that banks tightened standards at an elevated intensity roughly similar to the past year, across loan categories: commercial and industrial, consumer and real estate.
Weakening demand for credit and bankers’ concerns about the outlook imply a broader slowing in economic activity in response to previous policy tightening – not simply a supply-led response to banking sector developments at the end of Q1 2023.
Tighter standards for C&I loans are consistent with GDP growth slowing to recession territory in coming quarters.
GS: Lending Standards Tighten at Slightly Faster Pace and Demand Weakens for C&I and CRE Loans in Q2
BOTTOM LINE: The Federal Reserve’s July 2023 Senior Loan Officer Opinion Survey—conducted for bank lending activity over the second quarter of this year—reported that standards tightened on net at a slightly faster pace and demand weakened for both commercial and industrial loans for firms of all sizes and for commercial real estate loans. On the household side, banks reported tighter standards for all categories of residential real estate loans and for all consumer loan categories on net. They also reported weaker demand for all residential real estate categories, weaker demand for auto and other consumer loans, and basically unchanged demand for credit card loans. Almost no banks expected their lending standards for C&I loans to ease over the remainder of 2023, as uncertainty remains somewhat high regarding the timing of tightening in the current episode.
INGBanks put the squeeze on US economy as lending conditions tighten further
The Federal Reserve's Senior Loan Officer Opinion Survey shows banks are being increasingly restrictive in their lending practices while households and businesses are wary of taking on additional borrowing. Given how important credit flow is to the US economy it boosts the chances of a slowdown that will bring inflation back to target
… Taking the latest SLOOS data a step further in trying to help attempt to gauge the potential impact on output, we estimate results close to today’s backdrop of more stringent lending standards, less willingness to make loans, and less demand for loans from both consumers and businesses clearly suggests further slowing in the broader economy. A rule of thumb we’ve cited in the past is that a net 25% of banks tightening lending standards on C&I loans to large and medium size firms is typically associated with about a one point drag on real GDP growth in the following quarter. In turn, the 46% in April and the latest 50.8% of banks tightening lending standards on C&I loans to large and medium-sized firms could associated with a drag on GDP two points or so on both Q3 and Q4 growth rates. If anything, the drag on growth is likely larger than suggested by C&I standards alone, given the breadth of tightening across all loan categories.
A composite index of lending standards* (through Q2) showed further pervasive net tightening
… The Federal Reserve’s Senior Loan Officer Opinion Survey showed tighter lending standards and slowing demand for commercial borrowing. The tighter lending standards seem to reflect the economic cycle, not banking problems. Cyclical and structural factors are likely to be reducing loan demand …
From SLOOS to RATES
BNP US rates: Hedging higher for longer via SOFR flies
Chair Powell’s emphasis on the lagged effects of policy tightening can allow the rates market to price in a greater probability of higher for longer.
We think this environment should benefit positive carry trades positioned for a pushing out of cut pricing.
We favor selling Z4 on the Z3/Z4/Z5 SOFR butterfly and hedging against the risk of a large rally by buying a Nov23 expiry midcurve call on SFRZ4.
Turning away from SLOOS data recaps and victory laps and RATES and pivoting TO the oncoming recession narrative which is, as we know, constantly being shape shifted
Austrians are different than Keynesians. Austrians think recessions are caused by government failure, while Keynesians think they are caused by market failure. Take the 2008 financial panic. Was it market failure and bad business models or was it using the government to subsidize housing plus mark-to-market accounting? We believe the latter…without the subsidies and bad accounting rule, the recession might not have happened at all.
Why does this matter now? We think a recession is coming because the economy was artificially stimulated during COVID but the M2 money supply has declined in the past year. In addition, by rewarding short-term cash, the inverted yield curve should eventually limit business investment and risk-taking in general.
Others argue that mortgage rates (along with credit card and auto loan rates) are so high now that those taking out credit at current higher rates will be squeezed enough to cause spending to fall in other areas, leading to a slowdown in the economy.
Superficially, this theory might make sense. Back in 2021 the median existing home sold for about $350,000 while the typical 30-year fixed mortgage rate was near 3.00%. If the buyer put 20% down, the principal and interest payment would be $1,180 per month. Now the median existing home sells for about $400,000 while the typical mortgage rate is about 6.8%. As a result, a purchaser putting 20% down faces a monthly payment of $2,086.
That’s an increase of 77% or extra mortgage payments of $10,872 per year, which is a heavy lift for most households. No wonder some analysts and investors are concerned.
But, digging below the surface, the argument has some serious problems. First, it’s important to recognize that those extra mortgage payments don’t disappear into some sort of economic black hole; the extra money is paid to the lender who now has more purchasing power than they’d otherwise have.
… Government policy matters and the massive stimulus and lockdowns during COVID, some of the biggest policy mistakes in US history, require a price to be paid. We get it, forecasting in unprecedented times is difficult. But, if a recession happens, it’s not the little things that matter. It’s the big things.
With narratives shape shifting in mind, a few words from Rosie who everyone likes to call a bear. This is most likely because everyone hasn’t bothered to follow along and READ his commentaries in detail and frankly haven’t been paying attention to those times when he’s been quite bullish. Be that as it may, a memo,
Rosies Memo From The Chief Economist: No, I'm Not Turning Soft
As everyone gushes over the +2.4% annualized real GDP growth spurt in Q2, what goes unreported is that this is precisely what the number was in the quarters preceding the 2001 recession (2000Q4) and the 2007-09 recession (2007Q3). The average growth rate for the quarter the recession begins shows real GDP actually expanding at a +2% annual rate (back to the early 1970s). The very same quarter the recession begins! So the market has been trained by Wall Street economists, the Fed and the media to focus on lagging and contemporaneous indicators. The lags from the initial rate hikes, the time the yield curve inverts, the time from the peak in the LEI and from the time the NY Fed recession model pierces the 70% threshold, only then they say the recession is staring us in the face. We are still well within the ranges of the past for each indicator. The lags can be long, as we saw in 2007 when there were offsetting factors at play and back then it was about the lingering effects of mortgage-equity withdrawal and cash-out refinancings that bolstered household spending power. This time, it has been the lingering effects of the “excess savings” and the impact of the Biden fiscal package at play... but as I have said and keep on saying, there is nothing more powerful than interest rates when it comes to economic activity, with lags, and asset valuations.
I was asked all through 2007 when I was at Merrill, “where is this recession you’ve been calling for, Rosenberg?” and the same salespeople on the equity desk who refused to take me to see clients that year became my best friends in 2008 (they know who they are). I almost got fired twice for my calls in 2007 but my Institutional Investor All-Star rankings saved my skin (my boss at the time ended up doing a 360 external consultant review on my contribution to Mother Merrill... money well spent, I am sure... to only then offer me the dual role of Chief Economist and Strategist in early 2009... but for me, it was time to come home after a long seven-year absence from my family). In the summer of 2007, I had a CIO at a famed Houston-based mutual fund storm out of a meeting I gave and he scolded me as he exited the boardroom (“you have no clue about the housing market or the economy for that matter”). I had the head of Merrill’s fixed-income sales physically throw my presentation package at me at an internal meeting and told me in front of about 30 people that I was the worst Fed-watcher he ever saw... one time, when I was walking around the trading floor, this guy called me over and handed me the phone and I thought it was a client but it was his wife on the line, and she said: “my husband asked me to ask you why it is you are so useless.” So, you think I haven’t seen all this before? Even today, we have an inbox for client queries and comments here at Rosenberg Research and let me tell you — much the same. I have one client, who shall remain nameless obviously, who hurls insults at me every single day. Our bullish calls on Japan, Mexico, India and, more recently, Canada, have been overshadowed by our desire not to be involved with the most overvalued stock market on the planet.
And while we had a tough year in 2022 on the bond call, since the yield peak last October, you have made money in Treasuries and they do provide a ballast in the portfolio but we are in a moment of time where risk-adjusted returns and capital preservation psychology are viewed as arcane relics to be ignored. Just go all-in on the Nasdaq 100, right? (Oh, how short the memories are, considering this red-hot index in 2023 was turned into an ice-cold decline of more than -30% in 2022.)
Go figure. It’s called human nature. Jacob, my middle son who doubles as my COO and many of you know, told me the other day that the “hate mail” I have received on social media these past few weeks has been “off the charts.” Use that information any way you want — but it is a contrarian indicator. I was called the “skunk at the picnic” and the “class clown” in 2007 (and in 2000 as well when I was called a “Luddite” because I didn’t understand how the Internet defeated the business cycle), so all I can say is that this isn’t the first time I have been early on the call, and certainly not the first time to face the wrath of “haters” out there. The impatience and tempestuousness out there do not surprise me, either, having called the markets and the economy for nearly 40 years.
… Finally, in 1969Q3, just ahead of that recession, once again, the trigger for the “red flag” came from the glaring divergence between the index of coincident indicators (+4.1%) and the LEI (-4.1%). As much as an iron-clad warning shot as there is.
AND for a daily dose of stock-jockey-O-nomics,
CSFBs Technical Analysis - Equities Tactical Outlook
This report reflects the Credit Suisse Technical Analysis view only, and for a time horizon of up to 1-month.
Chart of the Day: European Equities have seen an important break higher and at the sector level, Construction & Materials shows a near identical structure/outlook to the Euro STOXX 50 itself, with much tested resistance from the 559 high of 2021 cleared to mark a bullish continuation pattern. We look for this to act as the catalyst for a more sustained trend higher for resistance at 607…
…with the Euro STOXX 50 itself having completed a large bullish continuation pattern and bullish “outside week” above the key 4415 high of 2021 and we look for a more sustained trend higher to test the 4573 high of 2007.
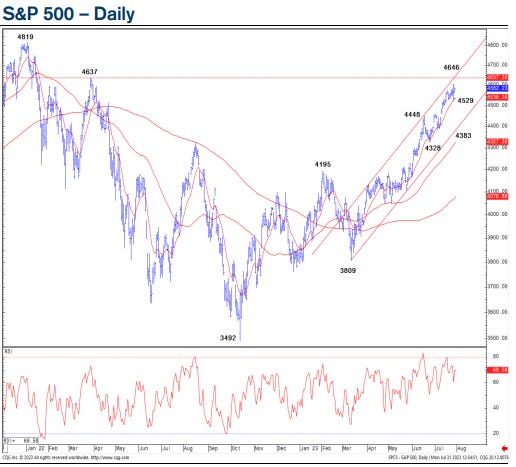
S&P 500 though is expected to hold below 4637 for a consolidation phase.
… Above support at 4531/28 can see the immediate risk stay higher for a test of the March 2022 high and trend channel top at 4637/46, but with this ideally capping for now.
Nasdaq 100 is similarly expected to hold below resistance at 16017 for now.
Nikkei 225 has gapped higher but still needs to clear the 33765/75 highs to confirm a resumption of the core uptrend.
Shanghai Composite has broken above its 63-day average and now also June high to turn the risk higher in the broader long-term range.
With this in mind a few cautionary words FROM Blomberg (via ZH),
Yield curves around the world over the last month have shown early signs of steepening. But it’s a re-steepening in real yield-curves that investors should be alert for, as this would be a negative signal for liquidity and thus risk assets.
Never underestimate the BOJ’s propensity to surprise. After giving the impression policy would be unaltered, at its meeting last week the BOJ shifted their ceiling for 10y rates from 0.5% to 1%, and introduced greater flexibility in its yield-curve control policy. 10y yields broke through 50 bps, and currently trade at just over 60 bps (with the BOJ buying bonds this morning), while USDJPY whipsawed around and closed higher on the day by 1.2%.
The policy adjustment coincided with yield-curve steepenings in the US, UK and Europe. This would be consistent with Japanese investors’ unwind of some of their US and European sovereign debt, along with the funding legs, to take advantage of the extra yield offered on JGBs.
It’s not clear, though, whether the yield differentials will be enough – 10y UST and JGB yields have both risen by about the same amount over the last week – to sustain flows back to Japan from the US. And flows in the other direction will continue to be limited as USTs remain very unattractive to Japanese investors after hedging costs.
Regardless, even before the BOJ, global yield curves had already begun to show signs of a re-steepening trend over the last month.
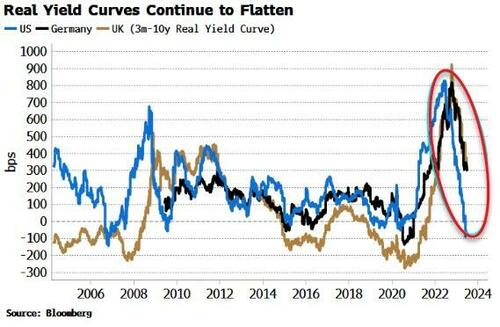
But when it comes to gauging the likely outlook for risk assets, it’s real yield-curves that have more utility in an elevated-inflation environment. The real yield-curves of the major countries continue to flatten aggressively as inflation falls, driving short-term real yields higher.
For the US, the flattening real yield-curve should keep pressure on the dollar (with last week’s BOJ actions adding to USDJPY downside).
This will continue to support excess liquidity, as the dollar value of foreign currencies rises.
The single biggest endogenous risk facing risk assets is a re-acceleration in inflation. While that is expected at some point, for the time being real yield-curves should keep flattening, and risk assets should stay supported.
From stocks I’ll turn back to some ‘official’ blog posts on money and its multipliers along with bank reserves,
St. Louis FRED: The monetary multiplier and bank reserves
The FRED graph above shows two different measures of money between 2005 and 2010: The red line tracks M2, which includes cash, checking deposits, and other short-term deposits. The green line tracks the monetary base, or M0, which includes only cash and bank reserves. The ratio of M2 to M0 (blue line) is often referred to as the “money multiplier,” a measure that describes how the supply of private money (deposits) responds to the monetary base: As banks accumulate excess reserves in their account, they expand their deposits and lending activities.
Between December 2007 and January 2009, M2 increased steadily but gradually, while M0 doubled from 837 billion to 1.7 trillion. As a result, the money multiplier dropped by half and has remained lower ever since.
Our second FRED graph separates M0 into its two components: currency (red line) and bank reserves (blue line). We see that the drastic change shown in the first graph is due to an increase in the supply of reserves following the 2008 recession. The increase in reserves is accompanied by a simultaneous change: The Fed began paying interest on excess reserves in October 2008. Had excess reserves brought no interest returns, banks would have expanded their deposit and lending activities because simply holding those reserves on the balance sheet is costly. Interest on excess reserves decreases the cost of holding them. As a result, banks are willing to hold more reserves relative to other assets, and they have less incentive to expand their balance sheet. This is likely to explain the decrease in the money multiplier. More detailed discussion about the phenomenon can be found in this article.
In closing, a random visual from the intertubes (LinkedIn cuz for some reason Tavi’s blocked me on X),
The lowest level since 2007, preceding the Global Financial Crisis. Every time credit spreads were at historically suppressed levels, a hard-landing scenario followed. Perhaps this time is indeed different, but I would rather base my perspective on numerous indicators pointing towards an impending severe recession. The profound issue of yield curve inversions is yet another example. Recently, over 90% of the Treasury curve was inverted, a measure that has accurately predicted every major economic contraction in the last 50 years. Moreover, the Fed’s policy stance should also be taken into consideration. As we have learned repeatedly throughout history, tightening monetary policies work with a lag and we are yet to witness a significant credit contraction that could lead to further economic issues.
Even the apparent strength of the labor market should be taken with a grain of caution.
Historically low unemployment rates have served as one of the most reliable contrarian indicators in history. Either these macro indicators are on the brink of being proven wrong, or the overall equity valuations are entirely out of line.
AND I’m sure it’s gonna be different this time … THAT is all for now. Off to the day job…
Thanks for the Rosie note that was really something! Rather surprised about Tavi, seen him interviewed multiple times, seems like a pretty chill dude. REI (Real Investment Advice) cites the same chart today so always love it when great minds think alike!
PS-I get REI's daily free note too, try to start my day reading you both. REI's is brief, serving as a nice warm-up, always read that first, for your the Main Event, the Main Course, the real Meat & Potatoes. Thanks again!


![CHART 2[1]](https://substackcdn.com/image/fetch/$s_!L36H!,f_auto,q_auto:good,fl_progressive:steep/https%3A%2F%2Fsubstack-post-media.s3.amazonaws.com%2Fpublic%2Fimages%2Fa38f1a37-29e9-43cc-8766-1bdc21d626d6_680x542.jpeg "CHART 2[1]")


Thanks for the Rosie note that was really something! Rather surprised about Tavi, seen him interviewed multiple times, seems like a pretty chill dude. REI (Real Investment Advice) cites the same chart today so always love it when great minds think alike!
PS-I get REI's daily free note too, try to start my day reading you both. REI's is brief, serving as a nice warm-up, always read that first, for your the Main Event, the Main Course, the real Meat & Potatoes. Thanks again!