(USTs 'SHARPLY HIGHER' on strong volume) while WE slept; does Fedspeak cut both ways?tides turnin'; bonds have best Columbus Day; 'The End of Pax Volckeriana' (trend in bonds no longer yer friend)
AP: 2 Federal Reserve officials say spike in bond yields may allow central bank to leave rates alone
… Philip Jefferson, vice chair of the Fed’s board and a close ally of Chair Jerome Powell, said in a speech Monday to the National Association for Business Economics that he would “remain cognizant” of the higher bond rates and “keep that in mind as I assess the future path of policy.”
… Jefferson’s comments followed a speech to the NABE earlier in the day by Lorie Logan, president of the Federal Reserve Bank of Dallas and a voting member of the Fed’s rate-setting committee. She also indicated that higher long-term bond rates could help serve the central bank’s efforts to slow inflation to its 2% target.
… “If long-term interest rates remain elevated” because investors are increasingly concerned about the risks of holding long-term bonds, “there may be less need to raise the fed funds rate,” Logan said, referring to the Fed’s benchmark rate. Bond rates rise when investors find them riskier to buy or hold.
ZH: Stocks, Bonds, Gold And Oil Soar As Dovish Fed Comments Trample Israel War Fears
… No, none of that moved the broader market. What did, and what cracked the Bloomberg dollar index sharply lower, was multiple Fed speakers such as Dallas Fed Lorie Logan and Fed vice chair Philip Jefferson echiung what SF Fed Mary Daly said on Friday, suggesting that soaring 10Y yields/term premium have done the Fed's tightening job for them, and no more hikes are coming. This is how UBS's trading desk put it:
Fed Vice Chair Philip Jefferson sounds dovish. He said he will remain cognizant of tightening financial conditions through higher bond yields and will keep that in mind when assessing the future path of policy. Also, he said the Fed is in a sensitive period of risk management, where they have to balance the risk of not having tightened enough, against the risk of policy being too restrictive.
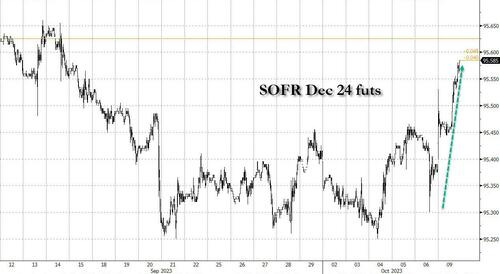
The unexpectedly dovish wind blowing from Fed talking heads sent the Dec24 SOFR futures surging more than 20bps higher...
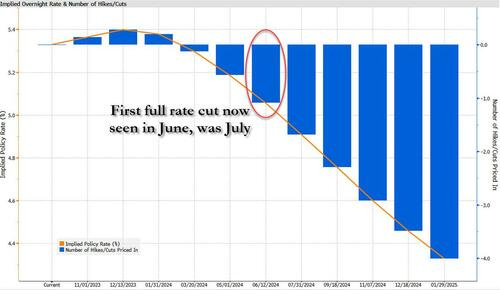
... and as the sudden dovish sentiment blew away much of the recent hawkish hangover which meant that the first full rate cut has now been moved to June from July...
I’ll say nothing about former level of ‘support’ near 4.68% and how it has come right back into focus today) here’s what I can say … from NFP CHEAPS (nearly 4.97) to yesterday’s implied opening flight2quality BID (4.68) the front end rallied nearly 30bps!
Lets put that in to current day context … IF ‘the markets’ rallied cuz the MARKETS were doing the Fed tightening for it and so, another hike unlikely THEN what does one make of rates dropping?
MARKETS RESPONSE TO THIS QUESTION: heads I win, tails YOU lose.
After the weekend where WAR is back to being the name of the game AND rates apparently reflexing in a familiar way (ie LOWER), the Fed finally having some ‘cover’ to drop some truth bombs? Higher yields DO in fact, make it in to their SEP / DOTS calculus?
AND … get those bids in early and often, ok, thanks.
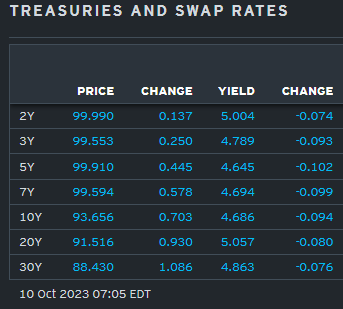
… here is a snapshot OF USTs as of 705a:
… HERE is what this shop says be behind the price action overnight…
… WHILE YOU SLEPT Treasuries are sharply higher this morning after war broke out between Israel and Hamas, adding a new risk/uncertainty to markets already seeing generation highs in policy/market rates as China grapples with an imploding property market (links above). DXY is lower (-0.17%) while front WTI futures are too (-0.4%). Asian stocks were mostly higher, EU and UK share markets are all solidly higher (SX5E +1.8%, FTSE 100 +1.55%) while ES futures are showing +0.2% here at 6:50am. Our overnight US rates flows saw Asian sellers in 10's greet the sharply lower rates at their open, though the pressure on prices abated after block buys in TY futures. Treasuries went into the London crossover near their Asian session lows with London traders flagging 2-way flows and continued belly outperformance on curve. Much of our London-based buying was concentrated in the front-end while fast$ sold the long end- but on a smaller scale than recent session. Overnight Treasury volume was a solid 155% of average overall.
… Our first attachment shows Treasury 10yr yields in a snapshot taken yesterday, mid-day. We put this in to isolate Friday's price action and how similar it was in level and construct (each Shooting Star bear trend exhaustion candles) to last Wednesday's. The message here is that yield levels above 4.80% 10's appear to be cat nip for investors or seen as a decent place to cover shorts for those positioned that way- where ~4.90% is a clear No Go zone, for now.
We next show an updated look at Treasury 10yrs and at least two things stand out: 1) 10's are trying to return to their former bear channel after a week above it and 2) the lower highs in momentum (lower panel) and higher highs in yields over the past week is evolving bullish divergence. On the latter, the divergence is a pretty clear sign that 10y sellers may be pushing a string at these move highs...
THESE VISUAL will become incrementally MORE IMPORTANT ahead of TOMORROWS 10yr reopening … and for some MORE of the news you can use » The Morning Hark - 10 Oct 2023 and IGMs Press Picks (who CONTINUES to be sportin’ that new, fresh look) in effort to to help weed thru the noise (some of which can be found over here at Finviz).
Moving from some of the news to some of THE VIEWS you might be able to use… here’s SOME of what Global Wall St is sayin’ (in a similar sorta way you’ll find content if you pay for ZH PREMIUM? except … they are SELLIN other folks data where as I’m just point it out and links provided — should work IF you have permission and should NOT work if you don’t … HOW can THEY do that?? askin’ for a friend as I never understood how they do it…)
BESPOKE (via #FinTWIT and really hate this sorta ‘bond analysis’ but)),
Today was $TLT's best Columbus Day performance in its history dating back to 2002.
CitiFX - As The Sun Rises: UST tides are turning (given how uncorrelated stocks are, perhaps bonds still a good ‘tell’ of the oncoming tape?)
US 2yr yields: 2y yields have opened below key supports. A weekly close below would open up a ~38bps move lower and point towards bull steepening ahead for USTs…
…Tides may be turning: UST 2yr
DataTREK - 800 Day Treasury Bear Market, One Percent Days
… Topic #1: The current bear market in long-term Treasuries versus the S&P 500’s selloffs from 2000 – 2002 and 2007 – 2009. The chart below shows an indexed price return comparison of the iShares 20+ Year Treasury Bond ETF (TLT, grey line) since its August 2020 all-time high compared to the S&P 500 following its peak in March 2000 (blue line) and October 2007 (orange line).
Three points here:
Today is the 800th trading day (around 3 years and 2 months) since TLT’s all-time high on August 4th, 2020 and it has fallen 50 percent since. Friday (the 799th trading day) marked the post-peak low so far, down 51 pct.
Over the same timeframe in the early 2000s and late 2000s, the S&P was down 36 pct and 21 pct from its March 2000 and October 2007 highs respectively. However, they had already bottomed and were up 25 pct and 83 pct respectively from the lows.
The S&P 500 declined by 49 pct over 637 trading days (roughly 2 years and 7 months) from its peak on March 23, 2000 to its trough on October 9, 2002.
The S&P fell by 57 pct over 355 trading days (about 1 year and 5 months) from its peak on October 9, 2007 to its bottom on March 9, 2009.
Takeaway: The current bear market in long-term Treasuries has persisted far longer than the S&P’s swoon during the early 2000s dot com blow up and late 2000s Financial Crisis. The decline in long-term Treasuries has also already surpassed the S&P’s peak to trough move in the early 2000s (-51 pct as of Friday vs -49 pct), but still has room to fall further to match the S&P’s peak to trough loss of 57 pct during the Great Recession. The low in October 2002 came as Congress approved military action in Iraq, providing investors with some clarity on this large geopolitical overhang. The low in March 2009 came one month after the Federal government finally enacted the post-Financial Crisis American Recovery and Reinvestment Act of 2009 (ARRA). The upshot here is that lows in capital markets occur once there is a change in policy to address uncertainty about the given issue at hand.
Consequently, long-term Treasuries will likely continue to struggle until Fed Chair Powell and the FOMC feel confident they’ve definitively beaten inflation and can turn more accommodative. With a still strong US labor market and decent economic growth, that could be a long way off. We therefore continue to advise caution when it comes to the long end of the Treasury yield curve. The best-case scenario, if today’s price action is any guide, is that long-dated Treasuries stabilize. That, however, is not the same as making real money from a sustained move lower in yields…
FirstTrust- Monday Morning Outlook - Crisis Management Government Leads to No Good (interesting ending …)
… … But there are other strange developments as well. One, is that the Treasury Department has a bank account at the Fed, called the Treasury General Account. On October 4 the TGA held $679 billion. The TGA is not new, but for decades through 2007, it held an average of only $5 billion. It was designed as a cash management tool.
Why the Treasury needs hundreds of billions in this account makes no sense. Using an interest rate of 5%, Americans are paying $34 billion a year so that the Fed can hold this cash. The cost of big government just keeps going up and up. It needs to be reversed.
Goldilocks - Balanced Bear Returns — Bear Steepening Drives Another 60/40 Drawdown (60/40 been SO bad, HISTORICALLY speaking, the outlook for it (and bonds) improves with each passing day of BAD)
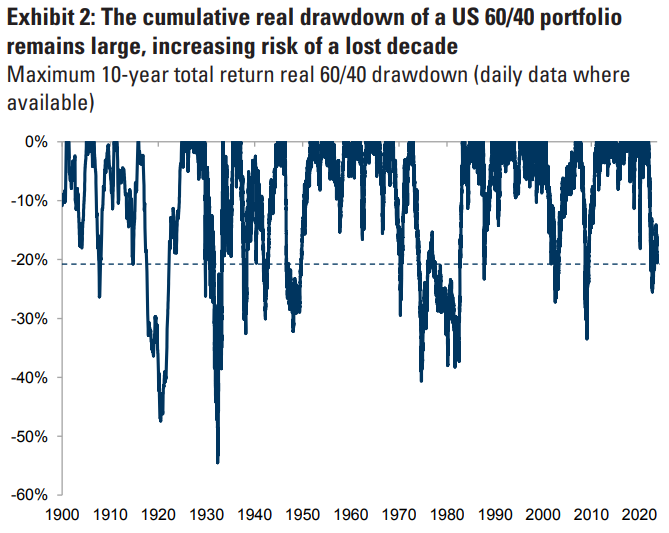
Since August equities have sold off alongside bonds again – the equity/bond correlation has turned sharply positive and 60/40 portfolios had another drawdown. The cumulative real total return drawdown of a 60/40 portfolio since the end of 2021 is more than 20% and the risk of a 'lost decade' remains elevated.
While valuations have reset somewhat, this has been mostly due to higher bond yields: equity valuations remain elevated, helped by the US soft landing and US tech stocks. This, coupled with little cyclical upside and continued policy tightening, results in a continued poor risk/reward for 60/40 portfolios with less potential for a strong recovery and still above-average drawdown risk.
We remain OW cash and otherwise N in our asset allocation (OW cash, N equity/credit/bonds/commodities). We expect low returns across assets and the competition from cash remains high. As longer-dated yields are finding their new equilibrium and with our baseline macro view of no US recession, 60/40 portfolios should stabilise in Q4. However, if growth momentum turns much more negative the drawdown could deepen, led by equities.
… Since August equities have sold off alongside bonds again – the equity/bond correlation has turned sharply positive and 60/40 portfolios had another drawdown (Exhibit 1)…
… In our Balanced Bear Despair research we wrote at the end of 2021 that 60/40 portfolios were likely to deliver lower real returns and have more frequent and larger drawdowns in the coming years. The key reasons for this were elevated valuations for both bonds and equities post the COVID-19 recovery but also high and rising inflation, which was a break from the previous regime characterised by low and anchored inflation. Increased inflation volatility is likely to drive more rates volatility and can result in more growth volatility. This increased the risk of a ‘lost decade’ or very low real returns for 60/40 portfolios. Since end-2021 (including the recent drawdown) a US 60/40 portfolios is still down more than 20% in real terms (Exhibit 2).
The combined valuation starting point for an investor in a 60/40 portfolio has improved in the last 2 years (Exhibit 3).
… Our dynamic asset allocation model (using machine learning) has been sending a similar message: the probability of another large 60/40 drawdown has declined from last year’s elevated levels but it has not declined as much as historically post large 60/40 drawdowns (Exhibit 6)
We expect a 0.22% increase in September core CPI (vs. 0.3% consensus), corresponding to a year-over-year rate of 3.98% (vs. 4.1% consensus). We expect a 0.30% increase in September headline CPI (vs. 0.3% consensus), which corresponds to a year-over-year rate of 3.55% (vs. 3.6% consensus). Our forecast is consistent with a 0.24% increase in core services excluding rent and owners’ equivalent rent in September.
We highlight three key component-level trends we expect to see in this month’s report. First, we expect a 2.3% decline in used car prices and a 0.1% decline in new car prices, reflecting lower used-car auction prices throughout the summer, increases in promotional dealer incentives, and higher new car inventories. Second, we expect car insurance prices to increase 1.7% this month, as insurance rates continue to catch up to higher repair and replacement costs. Third, we expect shelter inflation to remain roughly at its current pace (we forecast rent to increase by 0.48% and OER to increase by 0.45%), as the gap between rents for new and continuing leases continues to close.
Going forward, we expect monthly core CPI inflation to remain in the 0.2-0.3% range in the next few months. We expect continued moderation in shelter inflation and lower used car prices to be partially offset by a positive swing in the CPI’s health insurance component when the BLS incorporates new data and a methodological change next month. We forecast year-over-year core CPI inflation of 3.8% in December 2023 and 2.9% in December 2024.
PIMCO - Understanding the Rise in Bond Yields: Implications and Opportunities for Investors. The spike in bond yields presents an opportunity for fixed income investors to earn capital gains and diversify portfolios. (buy the dip)
… Investment implications The normalization in the shape of the yield curve and repricing of real yields reflects investors’ demand for higher yields in the face of greater supply. However, what’s good for investors is not necessarily sustainable for the economy over the medium term. Higher rates have further tightened financial conditions, which should weigh on investment, real GDP growth, and eventually inflation. In other words, higher yields that tighten financial conditions are just what the economy needs for yields to decline.
Thus, high starting yields plus the potential for capital appreciation and portfolio diversification can create attractive opportunities in fixed income markets, in our view. Indeed, investors can seek to construct resilient portfolios, with robust yields and predictable flows, with a moderate amount of risk.
UBS (Donovan) - Bond yields moderate as rhetoric moderates
US 10-year Treasury yields have fallen back to the levels of about a week ago. There are two narratives seeking to explain this—a safe-haven bid from Middle East violence, or more dovish comment from Federal Reserve members. The muted currency market response suggests it may be more about Fed expectations. Five members of the Fed are jostling one another for the media spotlight today…
WisdomTREE- Prof. Siegel: Is the Economy Too Strong? (same ‘ish question ‘bout the Fed framed bit differently and from Mr. Stocks-for-the-LONG-run)
… Is the economy too strong? There was good inflation news in the employment report that average hourly earnings were below expectations. The unemployment rate was expected to drop but remained constant and signals that more people are entering the labor force—which is exactly what you want, slack in the labor force that offsets wage pressures.
Yields jumped in reaction to the employment report because there’s worry the Fed will stay higher for longer. The initial equity market reaction to the employment report was a drop, but it closed on Friday much stronger—which I think is the right reaction. All this strength in the economy without increasing inflation plays well for corporate earnings, and we will start getting the earnings reports over the next two weeks.
We have a market that’s priced at 17.5 times next year's earnings estimates and ex-technology stocks are selling three to four points lower. Even if there is a mild recession, these are great long-term values. Stocks are almost to levels where earnings yields are above 6%, which equate to real returns going forward. There are even better long-term valuations for holders of international stocks. European stocks are selling at 10-11 times earnings.
Yes, TIPS yields and real bond returns are also higher, 2.3% to 2.4% offers more compelling returns in bonds. But remember, at 2.4% it takes exactly 30 years to double purchasing power. At 6% it only takes 12 years and at 5% it takes 14 years. Stocks are still priced for much better long-term returns and a 3% equity premium, while lower than it was for last decade, does not mean stocks are above fair value. They are now underpriced in my estimation.
The Fed is likely going to adjust higher their R-star (R*), which is now 0.5%, the neutral real rate. They’ll probably move it towards 1.5%, which translates to a 3.5% Fed funds rate at 2% inflation.
None of Friday’s data makes me think the Fed is going to hike rates on November 1. There are too many uncertainties. There is still high risk for a government shut down two weeks after the Fed meeting. Will the auto worker strikes be resolved? I still expect some weakness to come to the housing market. We now have 30-year fixed rates at 8%. Housing prices are holding but we are starting to see signs in apartment prices and rents coming down. There’s a delayed reaction in BLS shelter inflation and owner-occupied rent.
This week we will have PPI and CPI. I don’t think a one-tenth higher than expected inflation will force the Fed to hike. Maybe 0.2% to 0.3% hotter than expected inflation might cause to the Fed to hike. The long-end yields rising 50 basis points has done a lot of work for the Fed.
The bond market was closed today for Columbus Day. However, the iShares 20+ Year Treasury Bond ETF (TLT) surged 2.34%. This evening, the 10-year US Treasury bond yield dropped from 4.80% on Friday to 4.65%. The S&P 500 was weak in the morning, but rose 0.63% today (chart). It held its 200-day moving average last week (chart). That's impressive given that oil prices surged today after Hamas attacked Israel over the weekend.
The odds of a November hike in the federal funds rate (FFR) fell today to 12.1% from 27.1% on Friday according to the CME FedWatch Tool, which is based on FFR futures. That happened after two Fed officials ( Fed Vice Chair Philip Jefferson and Dallas Fed president Lorie Logan) indicated that the surge in the bond yield since early August reduces the need to raise the FFR. So "none-and-done" is looking increasingly likely for rate hikes over the rest of the year.
What about the war in the Middle East? Iran’s oil exports, which plunged 1.6 mbd per day under the Trump administration's sanctions, rose 0.6 mbd during the first three years of the Biden administration (chart). It's unlikely, but the Biden administration might reverse course and tighten sanctions again on Iran's oil exports…
… And from Global Wall Street inbox TO the WWW,
Bloomberg - Pax Volckeriana is done. Welcome to the New Order (Authers OpED with … end of an era illustrated by bonds …)
…Secular Transition For decades, the financial world lived in Pax Volckeriana. That now seems to be at an end, much like the vaunted Pax Americana in which the US was the global police officer.
After President Richard Nixon severed the Bretton Woods tie between the dollar and the gold price in 1971, world markets endured a decade of chaos. That was lanced by the Federal Reserve under Paul Volcker, who effectively replaced gold with the concept of Fed credibility. By showing that he was prepared to force the US into recession if necessary to control inflation, he was able to keep the dollar as the trusted center of a global financial system, even though it was no longer backed by gold. That enabled a steady and inexorable downward trend in 10-year yields that endured for more than three decades.
There are plenty of ways to track the trend, but the lines I’ve drawn on this Bloomberg terminal chart are as good as any. They start from the Black Monday crash in October 1987, which itself took place just after Volcker had departed the Fed. The 10-year yield went through a series of cycles, hitting successively lower peaks that each created difficulties, but the direction was down. That seems unequivocally to have ended in the throes of the pandemic, when yields were forced to almost zero. Since then, a new upward trend seems to be taking shape — and to be clear, I am certainly not trying to claim that we will now have three decades of rising yields, but merely that the previous regime is over:
We can look at the same phenomenon another way via the return that bonds would make for you. The following chart shows Bloomberg’s index of Treasury bonds dated 20 or more years into the future. Viewed this way, on a log scale, we see a dramatic uplift in the early 1980s, as Volcker gets to work, but the chart is book-ended with a decline almost as pronounced that starts in 2020. In Jerome Powell’s speech at that year’s Jackson Hole symposium, he announced a review of monetary policy that revealed him in some eyes as an “Inverse Volcker” determined to do what it took to bring inflation back.
Looked at either way, the secular trend appears to be over. This deviation is too great to be treated as another cyclical oscillation as the regime continues unchanged. There are plenty of reasons why this might be so, from the growing population of the elderly through to the end of the globalization shock to wages that will likely push inflation up to a higher level (and therefore require higher yields and interest rates). But the regime has changed. Bear this in mind as we narrow the focus on to the next few hours, days and weeks.
ZH: Fed's Presidents Agree: Soaring 10Y Yields Means No Need For Further Rate Hikes
In the aftermath of the "red hot" September jobs number (which, as we explained was neither red nor hot, but was merely the BLS's latest experiment in taking seasonal adjustments and top-line goalseeking to a ludicrous degree) markets initiall recoiled fearing that a November rate hike was now in the cards even as 10Y yields spiked just shy of 4.90%. And then stocks exploded higher amid a brutal short squeeze as sentiment suddenly shifted and the odds of another Fed hike slumped.
What happened? Well, as Goldman trader Cosimo Codacci-Pisanelli explained (full note available to pro subs), "the primary argument that can be made for the Fed not hiking again this year is that FCI is tightening enough and replaces the need for hikes."
Indeed, as shown in the chart below, FCIs have tightened materially over the last few weeks as the long end rate sell off has begun to impact risk assets and the USD has rallied. And according to the Goldman trader, "long end rates selling off is a far more effective way of tightening FCI: 10y UST yields make up a 45.1% weighting of the index, whilst the Fed Funds rate only constitutes 4.4%." …
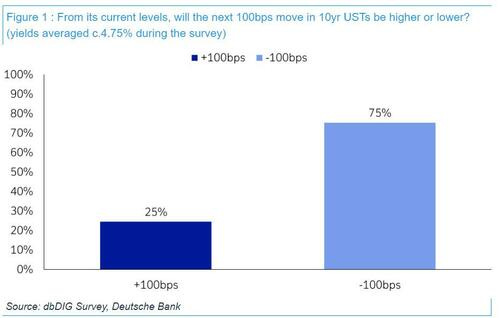
ZH: Vast Majority On Wall Street Think Next 100bps Move In 10Y Yields Is Lower (pro subs get ALL the recon … okie dokie … )
The Deutsche Bank October 2023 global financial market survey, conducted between the 3rd and 6th of October, had 410 responses from around the world. Survey organizer Jim Reid took a look at expectations of central bank policy error, US recession risks, and financial market forecasts. The bank also looked at the topic of the day, AI, before moving to inflation expectations. Professional subs can read the full survey at their leisure at the following link, for everyone else here are the highlights:
75% think the next 100bps move in US 10yr yields is lower (average yield 4.75% during the survey). A big turnaround from June’s results where a small majority expected 4.5% before 2.5% when we were halfway between the two. Well done to that small majority as it got there in just 3 months.
72% think the next 10% move in the S&P 500 will be lower. Slightly less than in June. In March 76% thought the next 10% move would be up so a different mood to earlier this year.
The US recession call has been pushed back into 2024 more than it has been removed from forecasts.
The perceived risks of a hawkish policy error continues to increase for the Fed and the ECB with the former now at 50% and the latter at 55%.
As a result of this and higher yields, the perceived risk of global accidents continues to be high.
The adoption of ChatGPT has slowed but expectations of Gen AI’s ability to increase productivity continues to be high, especially beyond 5 years' time.
The probability of Mr Trump being President after the 2024 election has increased from 36% in June to 46% in our latest survey.
Finally, since we last asked a Future of Work question in December 2022, days worked at home are fairly stable suggesting that a steady state has emerged for now.
Words elude me regarding Israel. So many horrors and atrocities. None are blameless, particularly THIS nation, always poking it's nose where it doesn't belong. So many theories, all sounding credible. I fear Israel walks into a ready made trap; not of their liking. Hamas, Hez, and Iran's in your face statements and tactics are concerning; I fear our failures in Ukraine have only emboldened our adversaries.


Great work !!!
Agree with your thoughts......
Words elude me regarding Israel. So many horrors and atrocities. None are blameless, particularly THIS nation, always poking it's nose where it doesn't belong. So many theories, all sounding credible. I fear Israel walks into a ready made trap; not of their liking. Hamas, Hez, and Iran's in your face statements and tactics are concerning; I fear our failures in Ukraine have only emboldened our adversaries.