Good morning … Unless of course you were HOPING (not a strategy) for the LONG bond to have its BEST day since March 2020 …
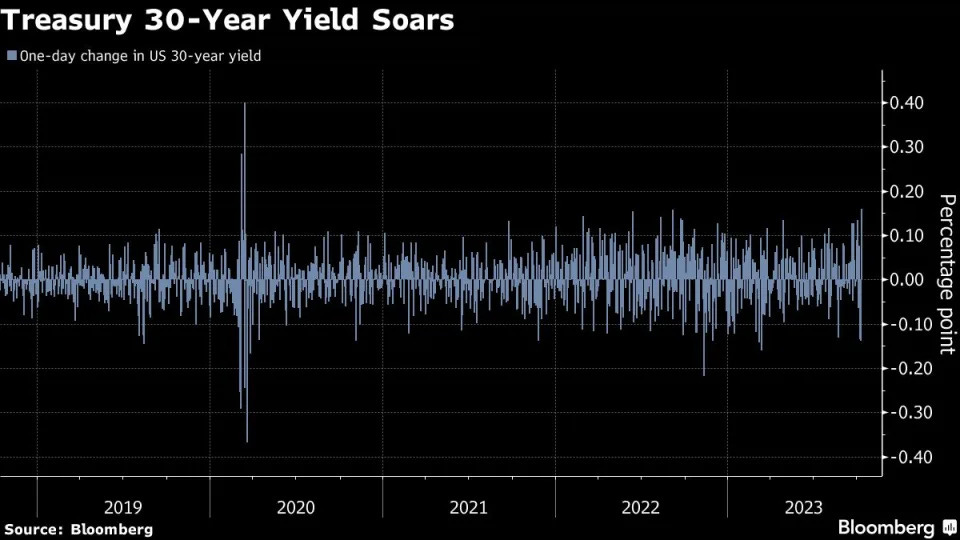
Bloomberg - Bond Rout Reignites, Unleashing Worst Day Since 2020 Turmoil
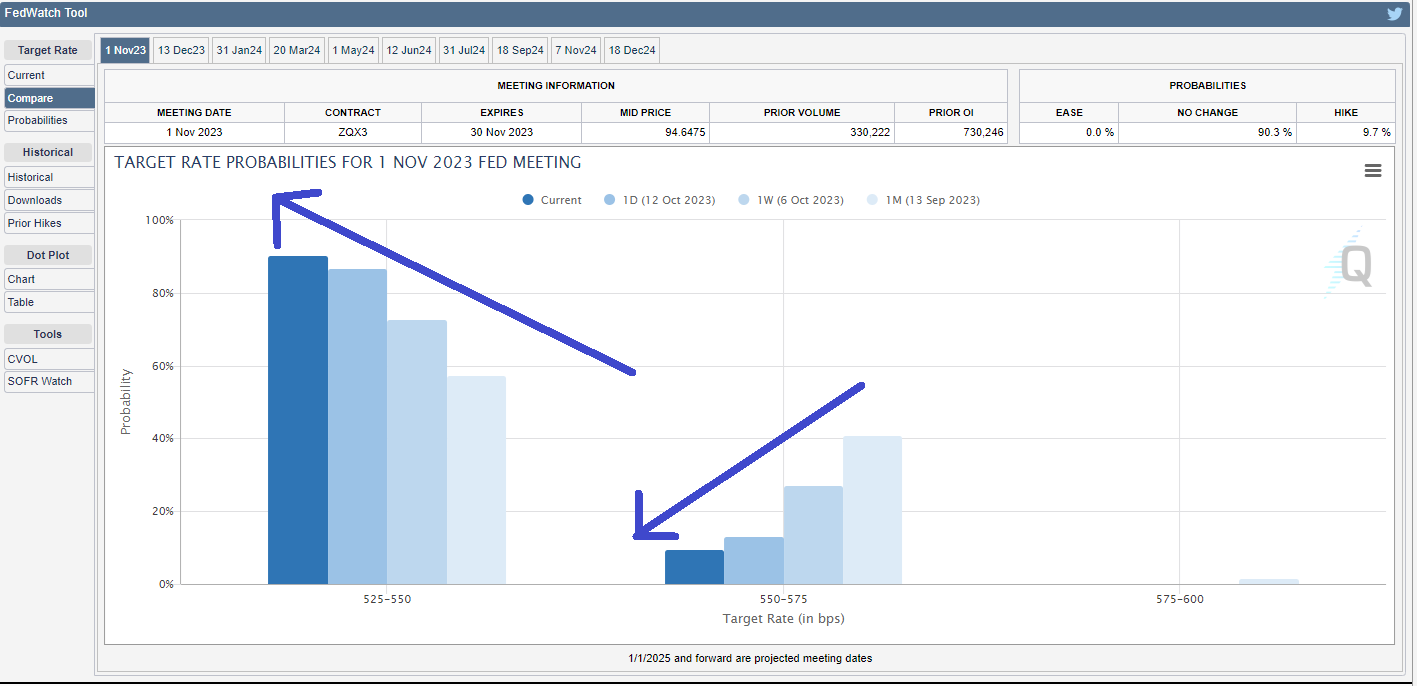
Market-implied odds of another Fed hike rebound to 40%
Thirty-year yields rise as much as 19 basis points on day
The US government bond market had its worst day since March 2020 by one measure, as hotter-than-expected September inflation data and weak demand for a bond auction fueled a surge in 30-year yields.
The 30-year Treasury yield rose as much as 19 basis points and was 16 basis points higher on the day in late trading, its biggest increase since the market turmoil unleashed by the onset of the pandemic…
Said another way (and because I believe everything on #FinTWIT)
AT FedGuy12 — Joe Wang, a former Fed insider (aren’t they all…)
Investors in 30yr bond are down 10% in 2 months.
Return OF capital not return ON capital? Wait, no … Welp, CPI and a weak LONG BONDauction …
ZH: Headline CPI Hotter Than Expected, Core Remains Above 4.00%
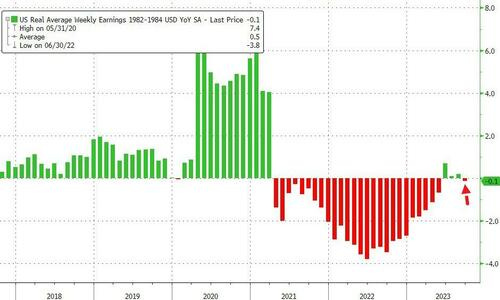
… Turning from the cost of things to the ability to pay, "real" wages contracted 0.1% YoY (after 3 months positive)...
This is not the soft-landing cruise lower in inflation that the market (and The Fed) was hoping for...
ZH: "Nothing Here To Convince Fed To Hike In November": Wall Street Reacts To Today's CPI (so … i suppose you read this and do NOT need all the recaps and victory laps below … but…)
ZH: Stocks Plunge, Yields Soar After Horrific 30Y Auction Tails Most In Two Years
… The auction, a reopening of 29-Year 10-month cusip TT5, priced at a high yield of 4.837%, which was almost 50bps higher than just last month's 30Y auction (which priced at 4.345%). This was not only the highest stop on a 30Y auction since August 2007, but it tailed the When Issued 4.800% by 3.7bps, the 4th consecutive tail and the biggest since Nov 2021 when we saw a record 5.1bps tail, and the 3rd biggest tail on record.
The bid to cover was ugly, coming at 2.349, the lowest since February. and well below the six-auction average of 2.44%…
… In all of this news … (crazy how TLINES continue to show up and remind us WHY they are relevant) NOTHING has really changed AND has led us all back to collectively hoping the bond market is doing the Feds work for it?
Look, if they (FRB Atlanta) SAY inflation stickier than they thought, that’s good, right? Cuz, you know, higher bond yields = less hikes (and so by default we’re closer TO CUTS)?
Enter into conversation, exhibit A spotted on #FinTwit just after 830a
I do NOT have a Terminal any longer so I’ve no idea how this all worked out BUT I do have access — as does entire free world — TO CMEs FedWatch tool — not my favorite graphical output BUT when you can’t (afford to)be with the one you love, love the one yer with
Make of IT whatever you will and as you do and HERE is another funTERtaining one on the intertubes via Investing.com (hover over TARGET RATE for some more interesting graphs) … here is a snapshot OF USTs as of 705a:
… HEREis what this shop says be behind the price action overnight…
… WHILE YOU SLEPT Treasuries have rallied overnight with intermediates leading the rebound here and in the UK and German this morning. DXY is little changed while front WTI futures are sharply higher (+3.7%). Asian stocks follower NY prices lower, EU and UK share markets are all in the red (SX5E -0.8%), DAX -1.05%) while ES futures are showing -0.2% here at 7am. Our overnight US rates flows saw the rebound in Treasury prices begin during Asian hours with our desk seeing only 'modest' buying in intermediates alongside another FV-US futures block steepened then. Overnight Treasury volume was ~80% to 85% of average…
… Our next attachment stays with the front-end to take another look at the long-term monthly chart of Treasury 2yr yields. We added this as a reminder that there may be a decent band of support for 2's (derived by their 2007 and 2006 move highs) between 5.128% and 5.275%. Treasury 2's have probed into this support band in recent weeks, respecting it so far.
Bit early on to be focused on MONTHLY charts BUT in as far as offering a couple LEVELS TO WATCH, well, 5.13-5.28 it is then … and for some MORE of the news you can use » The Morning Hark - 13 Oct 2023 and IGMs Press Picks (who CONTINUES to be sportin’ that new, fresh look) in effort to to help weed thru the noise (some of which can be found over here at Finviz).
You’ll ALSO note couple / few OTHER important developments overnight via Blond Money
Israeli military issuedstatement telling Gaza City civilians to evacuate to the south of the country for their own safety and “You will be able to return to Gaza City only when another announcement permitting it is made”.
UK will deploy a Royal Navy task group to the eastern Mediterranean and conduct surveillance missions.
China Inflation, CPI 0.0% yoy vs f/c 0.2%, PPI fell 2.5% yoy vs f/c -2.4%.
Moving from some of the news to some of THE VIEWS you might be able to use… here’s SOME of what Global Wall St is sayin’ (in a similar sorta way you’ll find content if you pay for ZH PREMIUM? except … they are SELLIN other folks data where as I’m just point it out and links provided — should work IF you have permission and should NOT work if you don’t … HOW can THEY do that?? askin’ for a friend as I never understood how they do it…)
Barclays - September CPI: Upside surprise (as one of few who’ve yet to cave on HIKE CALLS, maybe worth reading…but do what you will … )
Core CPI rose by a solid 0.3% m/m, driven by an unexpected uptick in OER inflation (to 0.6% from 0.4%), and a strong rebound in lodging away from home costs. Even looking past these categories, the momentum in core services inflation held firm, suggesting limited progress in reining in price pressures.
… We maintain our call for one more 25bp FOMC rate hike by the end of the year, with today's data adding to evidence that inflation on core services is proving sticky, and given data on economic activity and labor markets have continued to surprise to the upside. While our baseline remains for a November hike, we think that in light of the recent tightening in financial conditions, and given recent communication from FOMC participants suggesting that this may reduce the need for the FOMC to do more, there are significant risks that the next rate hike could be delayed
Barclays - September Atlanta Fed wage tracker shows slight deceleration in underlying wages
The unsmoothed September Atlanta Fed wage tracker print decelerated, while the weighted 3mma measure showed no change from August. Our state-space model, which draws signals about the underlying pace of wage growth from available measures, shows a slight deceleration after incorporating this data.
BMO - Core-CPI +0.3% as expected: super-core still elevated
… Overall, it was a firm read on realized inflation that reinforces the Fed's recent messaging regarding the need to keep policy rates in restrictive territory for an extended period of time. The unchanged initial jobless claims print of 209k also reinforces the Goldilocks narrative.
Treasuries were firmer on the day ahead of the release and have since sold off with the 2-year sector the decided underperformer. It follows intuitively that investors are once again contemplating the potential for a November 1 hike -- although this week's tone-shift from Fedspeakers will be difficult to unwind. The weakness in the front-end of the curve has brought longer dated yields along for the ride and from here we'll be watching the feedback loop between risk assets and higher rates.
BloombergBNP - US September CPI: Disinflation trend intact, but some worrying signs (so, HOPE still seems to be the strategy)
KEY MESSAGES
While core CPI rose in line with expectations in September, the details reaffirmed our view that a softer labor market will be required to move inflation back to the Fed’s 2% target.
We think the acceleration in OER inflation for the month is largely noise, but are more worried by the step-up in non-housing services inflation.
In the near term, we think the disinflation trend remains intact and core PCE inflation undershoots the Fed’s 3.7% q4/q4 2023 forecast, though the pathway there has become a bit narrower.
Preliminary October forecast: 0.2% m/m headline and 0.3% core.
… Overall, we think the September CPI print will not change the Fed’s cautiously optimistic assessment of inflation and the inflation outlook. We continue to expect core PCE inflation to undershoot the Fed’s 2023 forecast, although the path there has gotten a bit narrower…
… Interest rate strategy: At a high level, two factors stood out in driving the market response to September’s CPI. First, inflation swaps implied a release below forecast consensus, magnifying the upside surprise in headline inflation. Second was the composition, with the source of firmness in core not easily dismissed as noise that markets (or the Fed) can readily look through.
Rates moves are for now being informed by the recent burst of Fedspeak that has reasserted the importance of financial conditions (and notably higher longer term yields) as doing some of the work of additional rate hikes. Rather than aggressively putting material additional risk into November or December (currently pricing 50% of an additional hike) – which could be easily justified by the combination of last Friday’s jobs report and this morning’s release – pressure is showing up further out the curve as more risk of early 2024 hikes and higher for longer.
If the Fed sticks to what appears to be a cautious approach to additional rate hikes from here, we think the gradual repricing at the very front-end can sustain (incrementally adjusting hike risk on news), but we are skeptical that this week’s long-end relief will prove durable. Instead, volatility may be once again forced out the curve, with the market requiring additional risk premium (or further embracing a higher longer-term rate) in the event of continued economic momentum. Given this, we remain more comfortable with the risks to received positions at shorter maturities (as opposed to further out), but favor managing with a tighter stop given recent fundamental news.
DB - September CPI recap: A bumpy road (and … here we go with the updated forecasts…AFTER the facts change … you know, what do YOU do sir, bla bla)
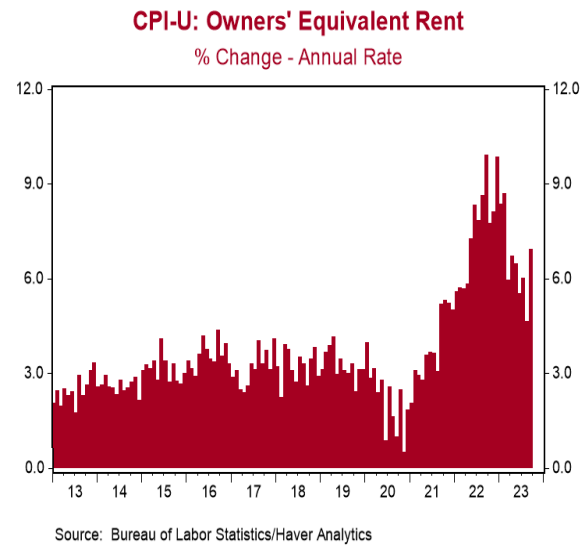
The September CPI data came in stronger than anticipated with headline and core rising by 0.4% and 0.3% respectively from August. The major surprise was rental inflation with the print for primary rents ticking up slightly (+0.5%) while that for owners' equivalent rent (OER) spiked two-tenths to +0.6%. Taken together, the year-over-year rate for headline remained steady at 3.7%, while that for core fell three-tenths to 4.1%.
These data have caused us to upgrade our near-term expectations for inflation, largely because of a stronger trajectory in rental inflation. We expect October core CPI to come in at +0.31% m/m and 4.1% y/y. Our Q4/Q4 forecasts are now 4.0% for 2023 (a two-tenths upgrade), 2.7% for 2024 (unch.), and 2.5% for 2025 (unch). Our Q4/Q4 core PCE forecasts are now 3.5% for 2023 (a one-tenth upgrade), 2.4% for 2024 (unch.), and 2.2% for 2025 (unch). The analogous headline numbers are 3.3%, 2.2%, 2.4% for CPI and 2.9%, 1.9%, 2.1% for PCE.
As we have emphasized, any sign of inflation strengthening increases the risk of another hike, potentially more than one, in the coming months. This is especially true in light of last week's strong jobs report. That being said, recent Fedspeak has emphasized the two-way nature of near-term economic risks. Case in point, the recent tightening in financial conditions, if sustained, may offset some of the increased risk of further interest rate hikes. Though this CPI data is likely not what the Fed wanted to see in terms of progress, they have set the bar relatively high with respect to their core PCE forecasts in the September Summary of Economic Projections. As such, we continue to expect that the Fed is finished hiking rates.
FirstTRUST - The Consumer Price Index (CPI) Rose 0.4% in September
… Implications: The Federal Reserve’s fight against inflation is not over … Rental inflation – both for actual tenants and the imputed rental value of owner occupied homes – continues to run hot, up 0.5% for the month and running close to or above a 6% annualized rate over three-, six-, and twelve-month timeframes. Meanwhile, a subset category of inflation that the Fed is watching closely – known as the “Super Core” – which excludes food, energy, other goods, and housing rents, jumped 0.6% in September. This measure is up 3.8% in last twelve months but has been accelerating of late; up at a 4.8% annualized rate in the last three months. No matter which way you cut it, inflation remains nowhere close to where the Fed wants it to be. Couple that with a resilient US labor market, Powell and Co. still have plenty of reason to keep monetary policy tight in the months to come. The worst part of today’s report was that real average hourly earnings declined 0.2% in September, taking a bite out of consumer spending power. As for the economy, we continue to believe a recession is on the way. Equity investors should remain vigilant as we navigate these unprecedented times. In employment news this morning, initial claims for jobless benefits were unchanged last week at 209,000. Continuing claims rose 30,000 to 1.702 million. These figures are consistent with further growth in the labor market in October.
Goldilocks - Core CPI Rises 0.32%; Estimating September Core PCE Inflation of 0.26%; Initial Claims Remain Low
BOTTOM LINE: September core CPI rose 0.32%, a four-month high but close to consensus expectations for a 0.3% increase, and the year-on-year rate fell by 0.2pp to 4.1%. The composition was firm on net: while a sharp increase in hotel prices contributed 5bp to the core, the more persistent rent, OER, and healthcare categories were stronger than we expected. Based on the details of the PPI and CPI reports, we estimate that the core PCE price index rose 0.26% in September, corresponding to a year-over-year rate of +3.67%. Initial jobless claims were unchanged at a low level. While somewhat above our expectations, we do not expect today’s CPI report to affect the outcome of the November FOMC meeting, for which we expect unchanged policy. Recent commentary by Fed officials has also sent a strong signal that the FOMC is likely to keep the funds rate unchanged in November
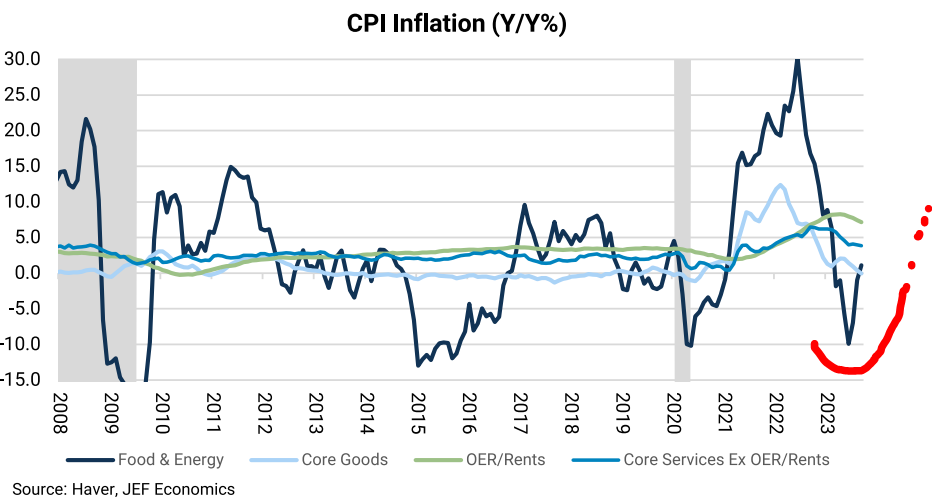
JEFF - Sep CPI +0.4%, Core +0.3%... Fed Headache with Core Service Prices Rebounding and Shelter Slowdown Reversing (slowdown REVERSING … you can’t fool ME with yer Jedi mind tricks and double negatives … that there reads no bueno)
■ The September CPI rose 0.4% (+0.396% unrounded) with core up 0.3% m/m (+0.323% unrounded). The headline was a tick above consensus, but the core was as-expected. ■ At first glance, this shouldn't worry the Fed, but the details under the hood are far more concerning. The weakness in core was concentrated in apparel and used cars, shelter inflation was firmer than expected, core service ex-housing was firm, and gas prices rose less than expected. In sum, the components that are easy to look through were softer, and the stickier, trending components were firmer. This easily could have been worse. ■ This is one of the worst possible numbers for the Fed. There are signs that inflation is bottoming out at a level far higher than their target, but the headline numbers do not clearly show that another hike on November 1 is appropriate. Our base case is that the Fed continues the "hawkish pause" at the next meeting, but this CPI report increases the risk of another hike in December or later.
LPL - Inflation Losing its Stickiness (oh no, that does not sound good at all…)
Key Takeaway: The rise in shelter costs in September was the largest contributor to headline inflation but will not likely show up in upcoming months as rent prices moderate. Annual core inflation decelerated to 4.1% in September from 4.3% the previous month.
Highlights from the September Consumer Price Index (CPI) Report:
Annual headline inflation was 3.7%, unchanged from August as firms are still able to pass along higher wholesale prices.
Core inflation decelerated to 4.1% in September, slightly below the previous month’s rate of 4.3%.
Shelter was the largest contributor to the monthly increase in consumer inflation, accounting for over half of the increase, but this category should not be as impactful in the coming months as softer rent prices work their way into the official government metrics.
Costs of medical care services fell -2.6% from a year ago, indicating that some categories are getting less sticky.
Used vehicle prices fell in September for the fourth consecutive month, pulling the annual decline down to -8%.
Markets are still processing the implications of the latest report. Some shorter duration yields spiked up to the levels reached after the strong payroll report last week.
Bottom Line: Core inflation less shelter is not as sticky as it had been last year or earlier this year. Market expectations are unchanged for what the Federal Reserve (Fed) will do at the November meeting. However, investors should be carefully watching oil prices for insight into how the Fed will act at the December meeting.
MS - US Economics: CPI Data Imply 0.27% Core PCE in September
The consumer price index (CPI) for September came in above expectations. Core CPI increased 0.32%M (MSe 0.26%, consensus 0.3%), with stronger deflation in core goods but a higher than anticipated print for core services. On a YoY basis, headline moved sideways and remained at 3.7% while core decreased to 4.1% from 4.3% the month prior. On a 3-month annualized rate, core CPI increased to 3.1% from 2.4% in August…
… September CPI was strong on the services side and this print, along with the strong September payroll print, meets the bar we previously set for an additional hike in November - with the important exception of easing financial conditions, which remain more than one 25bp hike tighter since the September FOMC meeting. The Fed voices that have argued for no further hike this year will maintain that view as long as financial conditions remain tighter. But the recent set of data make the next round even more important in the December hike determination for policymakers. December remains a live meeting.
Incorporating inputs from CPI, we forecast core PCE inflation increased 0.27%M in September vs. 0.14% in August, while headline is forecasted at 0.32%M vs. 0.39% prior. Core services ex housing translation points to 0.34%M in September vs. 0.14%M prior, lower than CPI given soft financial services from PPI.
RBC - U.S. inflation pressures ticked higher in September
Bottom line: Fed policymakers are wary of a reacceleration in price growth with the economy still running exceptionally hot. The September data follows a string of downside surprises that left a substantially softer-than-expected broader price growth backdrop over the summer - and the upside surprise in the latest month shouldn't be enough to change that broader narrative. But the Fed's pause in interest rate hikes is really a function of soft inflation prints allowing policymakers patience to wait for an exceptionally strong (and probably overheating) growth and labour market backdrop to cool. We don't expect additional interest rate hikes this year will be necessary, but the Fed is still willing to respond with higher interest rates were the inflation backdrop to show further signs of reacceleration.
… At an annualized rate, core inflation was 3.9% m/m SAAR in September. Given that the prior month was up 3.4% m/m SAAR, the brief summertime soft patch through a pair of 1.9% m/m SAAR readings in June and July looks to have been an aberration (chart 1). Core inflation is still running cooler than the ~5% m/m SAAR pace coming out of Winter into early Summer, but restoring the trajectory toward the upper 3s won't satisfy the FOMC that inflationary pressures are abating fast enough toward their 2% headline PCE target.
… FOMC IMPLICATIONS Overall, I think the FOMC would look at this and still conclude that underlying inflationary pressures remain too hot for their liking. Core CPI is bouncing back and more important is the evidence on underlying service prices. With readings and underlying details like these and after nonfarm payrolls surprised sharply higher alongside yet another quarter of strong GDP tracking, I would be tilting the balance toward a November 1st hike more favourably than what is still light market pricing…
Headline CPI +0.40%: Stronger than expected… Core CPI +0.32%: Surprising pick up in OER… September core PCE prices +0.24%… Seasonals likely to provide illusion of strong core CPI in October The seasonal factors that overstated the slowing in core CPI inflation in June and July are expected to swing to overstating the strength in October, so we expect a solid core CPI increase next month, though headline inflation is likely to slow amid easing gasoline prices. Looking through those monthly numbers 12-month core CPI inflation should continue to trend down through early next year. As always, we will update our inflation forecast as we go through the details of today’s release and additional data becomes available.
US headline consumer price inflation rose, but the details hint at weakening pricing power and support for a soft economic landing. Most market-determined prices are softening. Durable goods deflation continues. The fairy tale of owners’ equivalent rent, where statisticians pretend people pay themselves an ever-rising monthly rent to live in the houses they own, was the main driver of higher prices.
Because owners’ equivalent rent is a fantasy, spending firepower for middle income homeowners is improving in reality. The next pay increase is not going to be spent on renting a house you already own, which means it can be spent on other things. We will get the US Michigan consumer sentiment data later today, including the ever-hilarious split between the economic views of Republicans and Democrats.
China’s consumer and producer price inflation rates were both lower than expected in September. Lower consumer prices owe much to falling food prices (pork prices are experiencing aggressive deflation). This does not transmit to the rest of the world. Exports and imports both fell, though the official data signalled the drop in exports was a little less than feared.
Summary Price growth in September came in somewhat stronger than expected, with the Consumer Price Index rising 0.4% versus expectations for a 0.3% gain. Excluding food and energy, prices rose 0.3%, in line with expectations. Core goods prices continued to fall, thanks to another sizable drop in used vehicle prices, but core services inflation strengthened to a monthly gain of 0.6%. The pickup was largely driven by a leap in owners' equivalent rent which we do not expect to be sustained, along with a jump in the volatile lodging away from home category.
September's CPI demonstrates that progress in lowering inflation ahead is likely to prove slower-going than it has been over the past year. However, the downward trend remains in place in our view, with the core CPI set to recede further over the coming year as shelter disinflation resumes, supply-related pressures ease and consumers grow more price sensitive. While there remains further ground to cover in returning inflation to 2% on a sustained basis, we believe recent realized progress will be enough to keep the FOMC on hold at its upcoming November meeting.
Summary • Although the Animal Spirits Index (ASI) remained positive in September, it fell to 0.1 from 0.69 In August. This is the largest change in the ASI since March 2020. • All five components were subtractive in September. • The dramatic slip reflects the cracks that are beginning to emerge in the economy.
Yardeni - Is Inflation Persistent, Sticky, or Transitory? (lotta questions and unfort for all of us, answers are … behind the paywall…but TRANSITORY seems to be winning. again…)
In our opinion, price inflation is turning out to be transitory after all. Wage inflation is more persistent, but moderating. Rent inflation is stickier, but also moderating. Today's CPI report for September mostly confirms our assessment.
Fed officials will undoubtedly stress that at 3.7% y/y and 4.1%, the headline and core CPI inflation rates remain too high above their 2.0% inflation target. However, some of them have already acknowledged that the federal funds rate (FFR) at 5.25% may be restrictive enough, especially given the recent jump in the bond yield. So today's CPI doesn't change our view that the current FFR is the terminal rate for the latest monetary policy tightening cycle.
Let's have a closer look at today's CPI report:
(1) The really good news is that the headline and core CPI inflation rates excluding shelter rose just 2.0% each during September (chart). These two measures of inflation have already scored bullseyes on the Fed's 2.0% target! Price inflation has turned out to be remarkably transitory according to them. That's because pandemic-related supply chain disruptions caused prices to spike higher for a while until the bottlenecks were ameliorated.
Bloomberg- Five Things You Need to Know to Start Your Day (OVERNIGHT)
…Sure enough, a slightly sticky inflation report was enough to send Treasuries tumbling back down to steep losses. This was hardly a sizzling hot CPI release, but it was enough to send 30-year yields up 16 basis points.
Investors keep piling into the world’s largest Treasury ETF, and getting hammered as a result. Even as bonds head for an unprecedented third year of losses, the $39 billion iShares 20+ Year Treasury Bond ETF has attracted a record $17.6 billion this year — about three times as much as a similar ETF covering 7-10 year notes.
The logic driving the trade is that the duration the longer bonds offer will turbocharge gains once yields start to come down, while even a further jump in yields won’t hurt too much over the coming year. That sounds like a variant of the “fear of missing out” narrative. The better move might have been to go for shorter-dated Treasuries, which offer similar income but lower price volatility. Of course, then you miss out on big potential rewards, like the almost 9% year-to-date gains for the Bloomberg Long Treasury Index in April, but you also miss out on the steep losses possible in a period when the Fed is still tightening policy.
Bloomberg (via ZH) - Bonds Prone To Squeezing Higher After CPI (this was BEFORE CPI and well, suffice it to say, does NOT appear to have aged well)
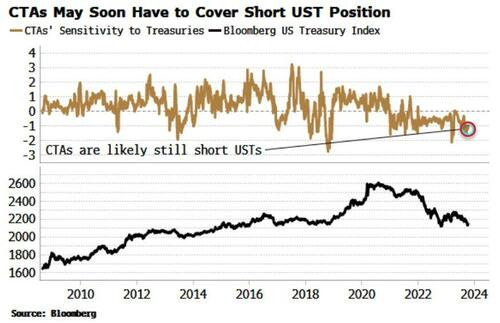
… We can infer CTAs are short by looking at a multiple regression of the SG CTA Index (a composite of 20 CTAs) to the S&P and USTs, and charting the coefficient for the latter. When this is negative, as it is now, it likely means CTAs in the aggregate are short Treasuries.
Headline consumer inflation is anticipated to land at 3.6%. Obviously a much higher print would likely trigger another sell off. But CPI fixing swaps – “skin in the game” estimates from traders – expect headline to come in 3.55%, which rounds to 3.6% (based on Bloomberg-inferred data).
Further, there is little disagreement between economists, whose estimates in the Bloomberg survey are tightly bunched around the median, with 42 out of the 48 estimates expecting a number between 3.5% and 3.7%. This accords with leading indicators, which see the trend lower in headline and core inflation continuing through the end of the year.
Therefore, it feels the risks are tilted to bonds rallying, which could trigger self-reinforcing short covering from CTAs.
Bloomberg (via ZH) - What To Do About Bonds When Inflation Is Elevated (same group as before who said bonds were gonna rally, fwiw)
Real assets – commodities, gold and TIPS – are better positioned than bonds to act as a portfolio and a recession hedge in a regime of elevated inflation. For investors without capacity or liquidity constraints, they are an improved alternative to Treasuries in a 60/40-like portfolio.
Inflation has been making up for lost time after its last two decades of serenity. As well as prompting the fastest rate-hiking cycles from central banks, playing havoc with economic pricing signals, and deepening uncertainty, it is also turning the established rules of investment on their head.
Nowhere is that more visible than the role of bonds. It has long been taken for granted that they possessed two features that made them almost indispensable to multi-asset investors:
1) they acted as a portfolio hedge for equities; and
2) they guarded against recessions.
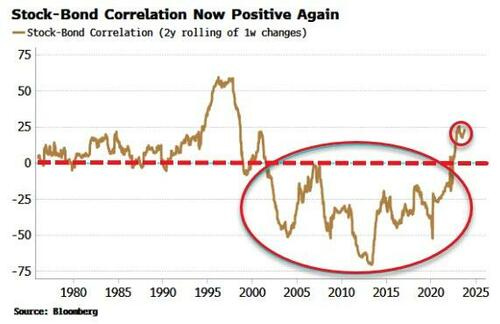
But both of these characteristics are becoming challenged in the current regime of elevated and unstable inflation. The stock-bond correlation is now positive after years of being negative. This means that rather than bonds having a dampening effect on the volatility of a traditional 60/40-like portfolio (60% equities, 40% bonds), they are amplifying it.
Bonds typically offer lower returns than stocks, so their return-smoothing properties were a key reason why equity investors held them at all. Even better, they tended to rally in a recession, mitigating the steep losses experienced by stocks.
Yet in an inflationary regime, a growth shock can be accompanied by an inflation shock, meaning stocks and bonds fall together. That’s what’s unflatteringly known as a Texas hedge.
It’s time for a rethink. Replacing some or even all of the Treasuries one holds in a 60/40-like portfolio is beginning to look ever more prudent.
But what do you replace them with? There are liquidity, capacity and operational constraints with other assets, such as real-estate, infrastructure, corporate bonds, etc. Moreover there is a higher bar for returns as cash typically provides a better return when inflation is elevated.
In a somewhat perverse way, this could lead many investors back to TINA – there is no alternative – deciding to replace some or all of their fixed-income allocation with equities. But there is one glaring problem here - apart from the obvious “eggs-all-in-one-basket” risk: portfolios heavily tilted to stocks are uniquely exposed to recessions.
So any replacement for Treasuries that mitigates portfolio risk also needs to help cushion the fall from equities in a recession. It turns out that real assets are the optimum port in the storm for investors free from institutional or capacity limitations.
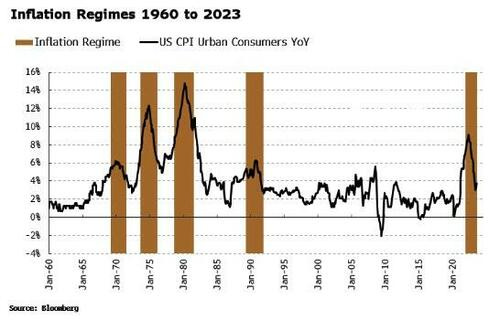
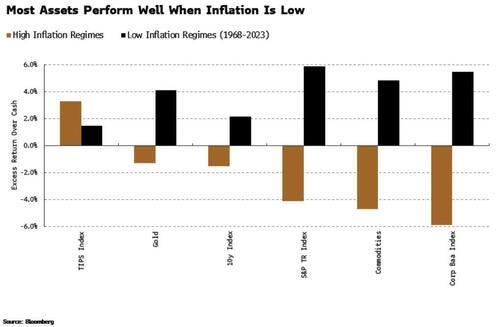
To see why, we need to look at how various assets have performed in low and high-inflation regimes. High-inflation regimes (shown in the chart below) are defined here as when inflation and inflation volatility are persistently above their long-term averages. There are five distinct regimes, including the one we’re in now.
Now let’s look at how the main asset classes performed relative to cash (3-month T-bills) in and out of these high-inflation regimes. As highlighted in the chart below, almost all of the assets shown perform better in the low-inflation regime. That’s mainly down to cash being lower in these periods, making it easier to earn a higher excess return.
In high-inflation regimes, only TIPS perform better than when inflation is low. Equities, along with corporate bonds, see the steepest drop in excess returns between low and high-inflation regimes.
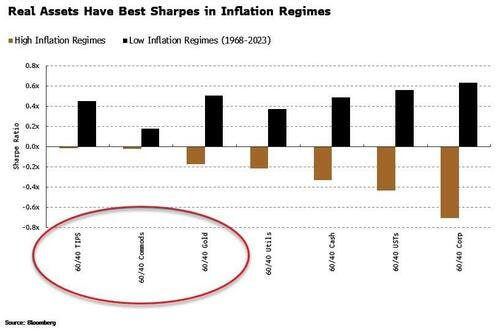
Now let’s combine these assets with 60% equities in 60/40 portfolios, and see how their Sharpe ratios change when inflation shifts from a lower to a higher regime.
The first thing to note is how every portfolio’s Sharpe ratio is worse in the high-inflation regime.
The 60% equity proportion does wonders when inflation is low, but falters when it is not. Indeed the excess return of all portfolios is negative in an inflation regime, as cash returns an lofty 7.4% annualized through such periods.
Secondly, the three portfolios with the best (i.e. least negative) Sharpe ratios all include real assets – TIPS, commodities and gold.
In challenging environments, choosing portfolios with the cleanest dirty hands is the best you can do, and replacing USTs with real assets has historically offered the best risk-adjusted returns when inflation is in an elevated regime.
But that still doesn’t help us with recessions. Stocks and corporate bonds typically see the largest selloffs in a slump. That’s why TINA or 60/40 with corporate debt are a bad idea if you want to avoid portfolio decimation in an economic slowdown.
It turns out, though, that real assets have tended to perform reasonably well in recessions, much better than stocks. Crucially, they tend to perform well in inflationary recessions, the type the next downturn is most likely to resemble.
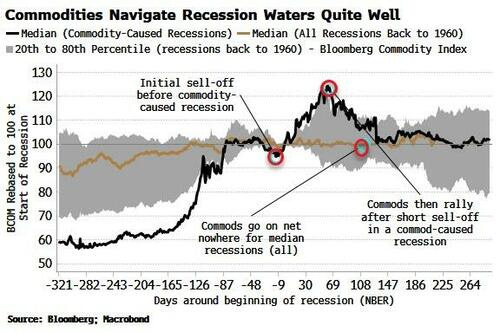
Both TIPS and gold have on average delivered positive nominal returns through recessions going back to 1969. What about commodities?
Financial “rule-of-thumbism” would tell you they do terribly in recessions. But that doesn’t bear much scrutiny. Commodities on average flat-line through economic slumps. However, if we look at commodity-induced recessions – as the next downturn is likely to have proved to have been – commodities rally after the recession has started.
In such contractions, commodities sold off on the pre-recessionary growth scare, but this in fact eased the growth shock, meaning that commodities – which are sensitive to the level of demand rather than its change – could rise through much of the recession.
Commodities, gold and TIPS are not for everyone and their market sizes are considerably smaller than nominal Treasuries. Moreover, other real assets such as infrastructure, real-estate and so-called alternatives may confer similar benefits, but these bring other potential issues such as liquidity mismatches and ease of access and management.
Real assets are typically spurned in 60/40-like portfolios, making up only a small fraction of the assets held. But there has never been a better time over the last 30 years to revisit this shibboleth of low-inflation regimes.
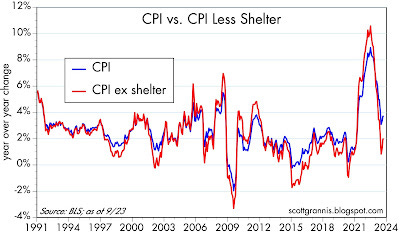
On a year over year basis, the CPI is up 3.7%. Excluding shelter costs, which we know are artificially inflated by BLS methodology, the CPI is up only 2.0%. It is not unreasonable to think that the Fed has successfully arrested the inflation that was caused by $6 trillion of federal deficit spending in 2020 and 2021. Mission accomplished. No more rate hikes are needed.
Chart #1
Chart #1 compares the year over year change in the CPI index (blue line) and the CPI index less shelter costs (red). The CPI including all prices rose 3.7% in the past 12 months, but excluding just one category—shelter costs, which are heavily influenced by housing prices 18 months prior—the CPI was up only 2.0%.
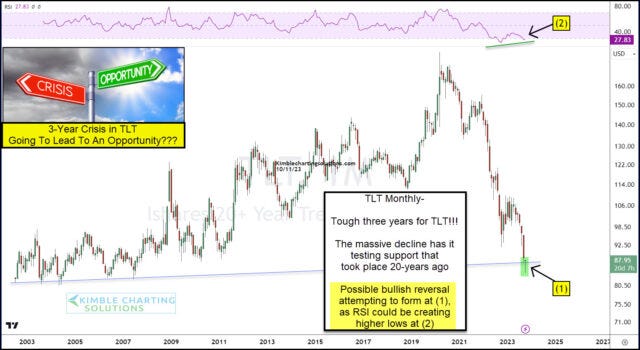
KIMBLE- Will Treasury Bonds Crisis Turn Into Opportunity This Month? Bond Bulls Praying Support Holds! (so, something NOT BBG and ZH related!)
Rising interest rates has created a decline in treasury bonds not seen in modern times.
As you an see, it has been a rough 3-years! And the crisis now has TLT testing 20-year trend support at (1).
It’s still early in the month, but TLT is attempting to form a bullish reversal at (1) while the Relative Strength Index (RSI) could be forming a higher low.
Opportunity for treasury bonds and TLT?
If support fails to hold at (1), the crisis in bonds reaches new levels of panic and concern!!!
The UIG "full data set'' measure for September is currently estimated at 2.9%, a 0.1 percentage point decrease from the current estimate of the previous month.
The "prices-only'' measure for September is currently estimated at 2.2%, a 0.2 percentage point decrease from the current estimate of the previous month.
The twelve-month change in the September CPI was +3.7%, the same level as the previous month.
-For September 2023, trend CPI inflation is estimated to be in the 2.2% to 2.9% range, a slightly larger range than July, with a 0.2 decrease on its lower bound and a 0.1 decrease on its upper bound.
WolfST - Acceleration of Inflation Continues, Core Services Inflation Spikes despite the Massive Health-Insurance Adjustment
Exhausted and sorry you happened to stumble upon this note? Reach out for full refund OR stick around and lets figure out WHAT NEXT — still waiting for Lacy Hunt / HIMCO quarterly to dop. HOPE to have something more for y’all over the weekend and please, PLEASE PLEASE whatever you do
AND get the point? Thought so and … THAT is all for now. Off to the day job…


Great Article....
The Bond Auction Blues are here....we better get used to it....
My 2 cents on Rents:
As a Renter in Arizona, for the past 5 years, I've seen rent soar at least 50 %..
True, many people are moving in to AZ, but I don't see New Rents dropping or lower.
Possibly the Rate of Increase will slow........I hope.
But there isn't any Deflation in Rents in AZ.
Rents are High as a proportion of Income and along with other Consumer Goods and
Services, makes Life much more Expensive.
The Service Sector(Travel) appears to be Booming and Inflation there is sticky. IMO