(USTs modestly lower on light volumes into bank earnings)while WE slept; "Will the 10-Year Yield Print 5.25% by Christmas?" (and/)OR are they heading TO 3.68% first? pension fund DEMAND
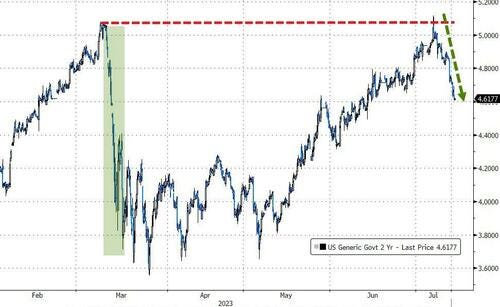
Good morning … Bank earnings coming thru and I’m not now and was never an analyst SO I’ll leave that all to y’all and the experts. I will begin with the number 2 as in 2yy — a daily inset to the weekly,
Reason being you can see magnitude OF the DAILY MOVES in weekly context AND note weekly momentum just now becoming BULLISH …
AND with the number 2 in mind yest was a 2 fer 2 … PPI followed CPIs lead and,
ZH: Intermediate PPI -9.3%, takes out the April 2020 covid lows. ZH: US Producer Price Inflation Tumbles To Slowest In 3 Years
Wait … there’s more (or less, if we’re talkin JOBS)
ZH: 'Unadjusted' Jobless Claims Rise To 6-Month Highs
But those details weren’t bad (or good) enough to save the long bond from,
ZH: Solid 30Y Auction Tails As Yield Slide Accelerates
… Overall, while the auction did tail, that can be attributed to the lack of concession due to the sharp slide in yields in recent days as the yield curve has steepened sharply in the past week; otherwise, metrics were solid and demand for paper is clearly there.
All told, by days end and as the dust settled,
ZH: Broke-Buck Mounting After Soft PPI; Crude, Crypto, & The Yield Curve Soar
… With 2Y Yields now down over 50bps from last week's highs, having thoroughly rejected the 5.00% and pre-SVB levels...
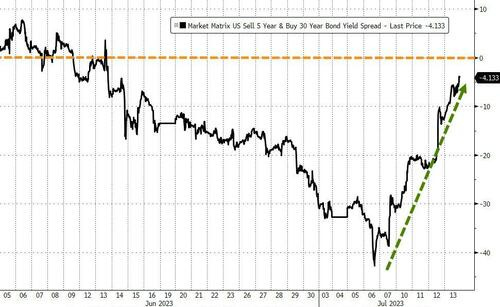
The yield curve (5s30s) surged steeper again today, edging ever closer to un-inverting...
… here is a snapshot OF USTs as of 707a:
… HEREis what this shop says be behind the price action overnight…
… WHILE YOU SLEPT Treasuries are modestly lower (but off earlier lows this morning) and the curve is little changed ahead of a soggy NY Friday featuring a few tier#2 data releases and some bank earnings. DXY is higher (+0.15%) while front WTI futures are little changed. Asian stock markets were mixed/higher, EU and UK share markets are mixed while ES futures are close to UNCHD here at 6:50am. Our overnight US rates flows were unavailable as we go to press (must have been quiet) with overnight Treasury volume ~85% of average overall with 2yrs (128%) the only benchmark seeing above average turnover this morning.
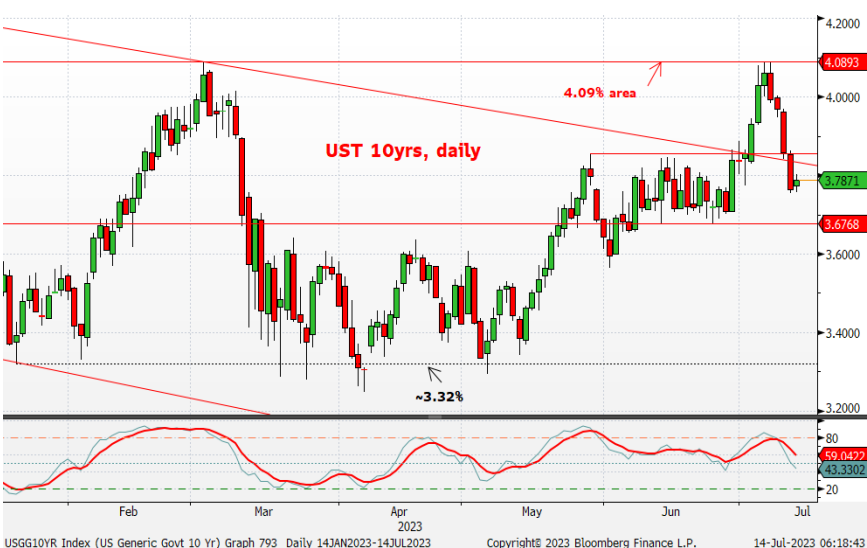
… The first shows Treasury 10yr yields back near the middle of the range they sat in for ~ the last three weeks of June- a bit of a no man's land, technically. All signs (see lower panel) still point to a retest of that range low resistance near 3.68%.
… and for some MORE of the news you can use » IGMs Press Picks for today (14 July) to help weed thru the noise (some of which can be found over here at Finviz).
From some of the news to some of THE VIEWS you might be able to use… here’s what Global Wall St is sayin’ …
I’ll begin with a note from Eric as we wait for the latest HIMCO quarterly review to drop …
It has been roughly four months since the regional banking crisis started with the failure of Silicon Valley Bank in March. With several months of distance, it’s a good time to review the core issue that caused the regional banking crisis, what has happened to the bank balance sheet in the aftermath of the crisis, and what this means for the US economy going forward.
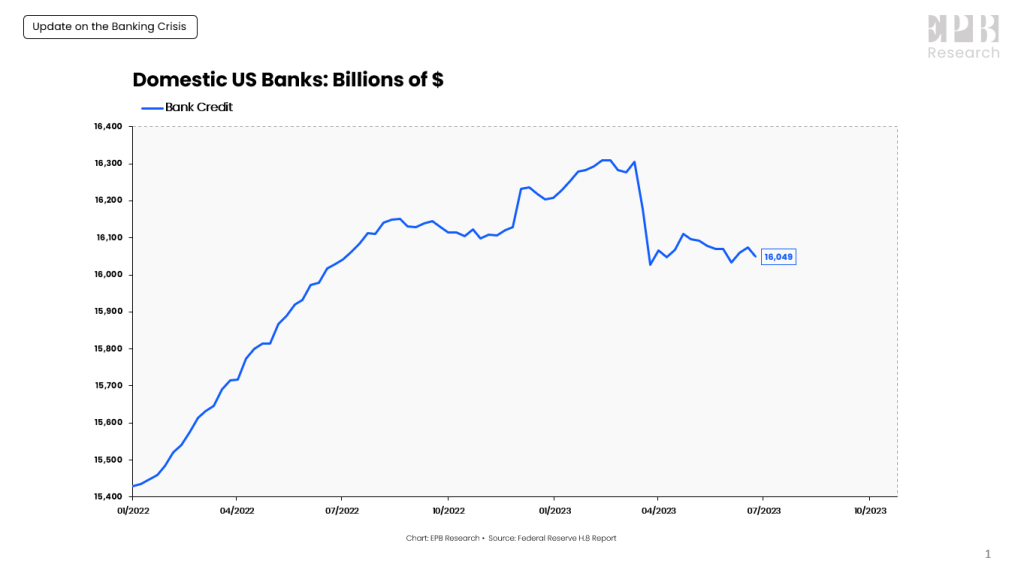
Banks extend credit to the economy in the form of buying securities and making loans. The economy operates on credit expansion which is why it’s very rare to see bank credit contract.
Bank credit fell sharply in the days following the SVB failure and has not recovered as banks have little interest in extending credit to the economy under the current conditions of an inverted yield curve and recessionary pressure.
Total bank credit today is lower than it was in Q4 of last year so we’re going on several quarters of declining bank credit, a rare situation that only occurs when the banking system is under stress.
The growth rate of bank credit shows a clearer picture. At the start of 2022, banks were extending credit to the economy at a 10% annualized rate. As the Fed started Quantitative Tightening and raising interest rates, bank credit growth slowed to about 2% before abruptly contracting after the SVB failure. Now we see bank credit in contraction over the last six months.
With that context, let’s review the core issue that led to the start of this regional banking crisis and then take a look at the asset side of the collective bank balance sheet to see what changes banks are making in the aftermath of the crisis and how this will impact the economy going forward.
As the Federal Reserve started raising interest rates and yields on Treasury Bills started climbing to 3%, 4% and even 5%, an alternative emerged to parking your money in a savings or checking account and earning 0%.
In addition, the Federal Reserve started reducing the size of its balance sheet through quantitative tightening…
… If banks have to replace low-cost sources of funding with a new source that is yielding more than 5% like the new Bank-Term-Funding-Program, then it’s basically impossible to operate profitably since the rate a bank can earn on average credit risk is less than 6%, there’s not enough spread for the bank to make a profit …
… So as the Fed continues to raise interest rates, deposits will keep contracting and force banks to reduce assets and contract bank credit. Lastly, the loan portfolio will shrink which is something that normally happens at the end of recessionary periods as bank lending is the last to move, a lagging indicator.
It will be increasingly difficult for banks as a collective to grow their balance sheets and extend new credit which makes it very challenging for the overall economy to avoid contraction.
I HATE when he does that … The ENTIRE note is worth reading when you get the chance.
In light of this past weeks inflation data, this next note offers another continued sigh of relief,
Barclays (June PCE inflation preview): Traveling in the right direction
We estimate that headline PCE inflation rose 0.16% m/m (3.0% y/y) and look for core PCE inflation to have moderated by 15bp, to 0.16% m/m (4.1% y/y), as we forecast core goods prices to have slipped into deflation, and expect weaker services inflation, consistent with the June CPI data in hand.
For somewhat MORE on ‘flation(s) report AND how / why it matters with some OpED context,
John Authers / BBG: Remember when inflation was scary and Bitcoin exciting?
… Last week, as Points of Return reported, there was a breakout in yields, with two-year bonds yielding more than 5%. This doesn’t happen often, and is often followed by a sharp reversal, which is exactly what’s happened this time. The level of 5.07%, at which the yield peaked both last week and in early March before the regional banks crisis, seems like an invisible barrier. But while the behavior of the bond market has been identical in both months, expectations for the Federal Reserve haven’t been. At all. The blue line in the following chart shows the implicit fed funds rate predicted for the December meeting of the Federal Open Market Committee. It tanked even more than bond yields back in March, and it’s barely moved recently:
The explanation lies in the banking crisis. In March, the supposition was that the Fed had already tightened so much as to break something, and that rates would have to fall imminently. This time, the supposition is that the Fed will stay on hold for a while. Bond yields are falling because of the suspicion that the Fed will stay too tight for too long, and ultimately damage the economy. That’s a reasonable fear at this point, and should at least temper some optimism …
For even MORE on bonds and from The Terminal — a weekly news letter dedicated TO bonds caught my eye specifically section on front end of the yield curve,
The Weekly Fix: The Fed has forced its own hand once again
… Try And Hold Me Back
Speaking of cash — the Securities and Exchange Commission unveiled a new round of reform designed to make it much harder to pull out of money-market funds in a crisis.
Final rules passed by the regulator this week require mandatory liquidity fees for some funds. As detailed by Bloomberg’s Lydia Beyoud and Alex Harris, fund managers would charge redeeming investors in hopes of discouraging the kind of rush-for-the-exits impulse seen in March 2020. That episode ultimately forced regulators to rescue money-market funds for the second time in 12 years.
While SEC Chair Gary Gensler said the changes will make money-market funds more resilient, skepticism abounds. Bank of America Corp. strategists wrote this week that the new rules fall short of fixing the root problem of the 2020 turmoil — liquidity in the commercial paper market.
The March 2020 “money market stress was driven by a ‘dash for cash’ and insufficiently liquid secondary market” for commercial paper, strategists Mark Cabana and Katie Craig wrote in a note to clients. “The only way to thaw the market would be through official sector intervention.”
Alternative solutions could include measures from deepening liquidity in the CP market to improving dealers ability to intermediate in markets.
“Future investor behavior in an acute flight to quality episode could see prime MMF or other short-duration asset managers rapidly sell CP & CD again, even with the higher liquidity thresholds,” they wrote. “Limited dealer balance sheet capacity could then see another market freeze.”
Interesting developments to watch as rates are set to go higher in a couple weeks …
AND from the legal trenches OF the money markets as well as the ivory tower of economics relating TO PCE we’ll move TO the bond market for an interesting note on DEMAND
BNP US rates: Pension de-risking and demand for duration
Pension and insurance duration demand has likely played a key role in driving the record increase in Treasury STRIPS outstanding.
Our estimates suggest private defined benefit pensions have materially reduced their duration gap and asset/liability mismatch over the last year and a half.
Although there are signs that the pace of these shifts has started to decelerate, we think tailwinds for long-end cash duration demand remain.
… Since the start of 2021, we estimate that pension asset duration has extended about 3.25 years. The concurrent about one year decline in liability duration has seen pensions’ duration gap compress to about six years (the lowest, based on our estimates – Figure 3). Using the average level of private pension assets over that period, the asset duration extension works out to roughly USD450mm/bp in net duration demand.
… Appetite should remain supportive of long-end duration: Estimates of funded gap volatility (such as NISA Investment Advisor’s Pension Surplus Risk Index) have also declined. Though lower asset and PBO volatility explain part of the drop in funded gap volatility, a higher correlation between pension assets and obligations also appears to have played a role. The latter suggests a shift towards a liability-driven investment strategy. Taken together, with the parallel reduction in duration gap, the overarching picture is consistent with material de-risking efforts, although neither suggest full immunization.
In recent months, the pace of these shifts (towards longer asset duration and increased LDI behavior) appears to have slowed. The heterogeneity across funded ratios and potential approaches leaves us hesitant, however, to take the observed deceleration in estimated asset duration extension as a clear sign that flows are set to halt abruptly.
Elevated long-end yields, firm risk assets, and concerns about recession in the context of a still meaningful duration gap suggest that even if the pace decelerates, tailwinds for demand remain in place. Relative to the rest of the curve, we think these factors may sustain a supportive environment for long-end cash.
Moving along TO another interesting and funTERtaining question asked by the allstars,
AllStarCharts: Will the 10-Year Yield Print 5.25% by Christmas?
Sell the two… Utah! Sell the Two!
I’ve parroted my bond outlook during internal meetings and across our Slack channels in recent weeks, partly in jest but mostly to highlight the underlying uptrend in rates.
Honestly, I’m not crazy about selling the short end of the curve (though I believe there’s a trade there). Instead, there are far better opportunities with longer-duration bonds.
Shorting bonds isn’t the most popular play with the Fed and the dollar and the CPI…
But that makes me like this trade even more, especially when I put the headlines and the dominant narrative aside and simply focus on the charts…
Check out the 10-year yield $TNX:
The US benchmark rate remains within a well-defined uptrend, resolving higher from one bullish continuation pattern after another. And it’s showing no signs of a trend reversal.
Could rates roll over later this year? Yes, absolutely! But I can only speak to what I see in the charts.
Based on the charts, I believe the 10-year hits 5.25% later this year – or perhaps early 2024.
The 5.25% level coincides with the June peaks from ‘06 and ‘07, making it a logical target for the next leg higher in rates.
If US treasury yields continue to rise – and the market has yet to reveal a reason they won’t – bonds have nowhere to go but lower.
I don’t see why we shouldn’t entertain the idea.
Here’s the setup in the US 10-year T-Note:
The 10-year T-Note is showing signs of renewed weakness after going nowhere since last fall. It broke down from an 8-month channel while posting an oversold reading on the 14-day RSI earlier this month, indicating sellers remain in control.
I don’t like trading patterns with sloping boundaries or trendlines. Breakouts often tend to churn sideways, much like the 10-year T-note today.
Horizontal boundaries offer far better areas of defining risk. For the 10-year, that level coincides with the March lows at approximately 110’13.
If and when 10-year T-Note futures undercut those former lows, I like it short toward a measured move at approximately 104’16.
Yes, this trade is far from triggering. But the 10-year isn’t a chart I want to buy. I tried buying bonds earlier in the year, and it didn’t work.
That’s valuable information!
Perhaps simply underweighting bonds makes sense for many investors. I get that.
Most importantly, this isn’t the place to buy bonds.
There are far better squeezes out there. If that’s the goal, the stock market is the place to go shopping – not the bond market.
Treasuries could catch higher, of course, but I’ll let the market prove it first.
The reality?
Further weakness in US Treasuries is a real possibility every investor needs to have on their radar during the back half of the year.
Lots going on here … an interesting TECHNICAL point of view and worth pausing to (re)consider … some say that in PRICE there is truth … I do NOT have all the fancy letters after my name but have always been a fan of the idea one doesn’t have to try and outsmart the market but be on board for bulk of moves (in any direction) …
EPS estimate dispersion is widening for Tech stocks while narrowing for the rest of the SPX. We think this reflects the broad range of outcomes for AI in its nascent phase, and puts a spotlight on Tech as it looks to grow into elevated valuation.
Wait, what? As goes tech so goes long bonds as they are both long duration assets, right?
Persistently low readings lately for the CBOE Put/Call Volume Ratio (for all products) have pulled down the 5-day moving average to its lowest reading since the top of the last bull market in December 2021. Such readings are pretty reliably associated with meaningful tops for stock prices. That is, unless the Fed has its thumb on the scale…
… Middling values really do not tell us much. It is only when the Put/Call Ratio gets to an extreme that it becomes really useful. But what constitutes an "extreme"? For that we have to put the data on a chart, and see what types of values have mattered in the past. The upper and lower threshold lines in the chart above are arbitrarily drawn, and one could reasonably argue that either of them ought to be moved up or down a little bit. It is also worth noting that the reaching of an extreme level for this (or any) indicator is not a "signal", but rather it represents a "condition". The market does not necessarily have to react immediately just because you or I may notice an extended condition.
But readings like we are seeing this week in the Put/Call Ratio's 5-day MA do tend to matter, eventually, as long as the Fed does not get in the way.
AND then there’s this,
Fidelity: New highs ahead for stocks? It's possible the long-awaited recession may occur much later than expected.
Key takeaways
The strength in stocks this year is at odds with rising Treasury rates and with the potential for further rate hikes.
The rally in stocks seems to be based on an expectation for a recovery in earnings by 2024.
If earnings recover as the consensus expects, and if we do get a soft landing, then it's possible stocks could be on the road to new highs.
But there's also a possibility that recession still comes—only much later than expected—in which case this year's rally may have gotten ahead of itself.
… Ignoring rates and focusing on earnings
While the current disconnect between stock prices and rates is clear, it's also explainable. As the chart below shows, stock valuations had been anchored to interest rates until around last year's October low (the blue and purple lines show estimates of "fair value" price-earnings ratios (P/Es) for the S&P 500 based on regression models using interest rates).
But in more recent months, stocks have moved away from anchoring to interest rates, and have been instead focusing on hopes of a recovery in earnings.
This means that for this bullish pivot to be justified, earnings are going to need to come through. Currently, the consensus estimate is that S&P earnings will contract by 9% in the second quarter and then bottom in the third quarter of this year, before recovering in 2024. If that is correct, then the rise in stocks and increase in P/Es that we have seen since last October could be justified and could continue…
… Risks if the bounce in valuations is premature
But with interest-rate expectations now turning more hawkish, earnings do need to come through. The rise in valuations in the past few months can be justified if we do indeed see a soft landing, but not so much if we ultimately get a hard landing.
History shows the risk if P/E ratios recover too soon. In the 2000 to 2002 bear market, for example, there was a premature recovery on the valuation side just before the bottom fell out for earnings—making for an all-the-more-painful decline.
The ultimate irony in this weird market cycle could be if the recession that many investors have been positioned for does eventually happen, but only after the consensus has capitulated to the bullish side and the market has reached a new high.
That is a nice note which combines BOTH stocks AND bonds …
Turning away completely from stocks back TO inflation and with yesterday’s PPI now in the rear view mirror, we can perhaps move on to other aspects of central planning and HOPES … One aspect for our consideration is,
It's not quite the great fall of China. However, something is definitely wrong with China's economy. June's trade data showed that Chinese exports fell again during June and imports have remained flat since mid-2021 (chart). It was widely expected that the end of the government's pandemic lockdowns late last year would boost economic activity in China and the world this year. That's not happening according to the latest trade data.
Confirming the weakness in China's economy is that the country's PPI fell -5.4% y/y through June, while the CPI was unchanged over the same period (chart).
China's PPI inflation rate tends to be a leading indicator for the US PPI for finished goods, which fell -2.8% y/y in June (chart)…
The rest, is as they say, behind the paywall…what ISN’T behind a paywall? Bank EARNINGS coming out as I attempt to organize and complete a sentence as well as this (perhaps behind bank earnings)
Posting MAY BE LIGHT next couple of days / weeks due to summer travel schedule and thanks for your patience. Meanwhile, THAT is all for now. Off to the day job…