Good morning … ahead of JPOWs JHOLE speech, I’ll try to be real brief. While MOST of main stream media will be focused on this from Twitter,
Sorry. Not sorry but … is that a GREAT mug shot or what? I don’t care if you like or HATE the guy. I mean really!!
Meanwhile, many / most of us YOU involved most intimately IN the markets will be glued TO boob toob at 10am e.s.t. for JPOWs speech … YOU will be watching your favorite RATES expression and trying to square it — and JPOWS words — with economic news the other day.
NFP benchmark revisions …
CalculatedRisk: Employment: Preliminary annual benchmark revision shows downward adjustment of 306,000 jobs
ZH: Another Downward Revision: BLS Confirms US Payrolls At Least 306,000 Lower Than Previously Reported
Some (not much) more from Global Wall St below…Maybe, just maybe some / all the bond jockeys clinging TO hopes of rate cuts (cuz, you know, something’s gonna break) are gonna be proven right, ultimately? Question IS if these positions can remain solvent enough to reap the benefits…doesn’t seem to ME that bond market prices / yields are ready to give up their bearish dreams and aspirations yet … Yields HAVE taken a step back from the edge …
5yy DAILY for example,
… Up nearer 4.50% — (yellow) LINE in the sand has repelled yields (again) and momentum HAS crossed bullishly. These are bullish developments and a meaningful trade back below 4.30% will help.
Lets see WHAT he says and how markets interpret his words at weeks END (which may be somewhat accelerated as today may very well be the final ‘Hamptons Hedge’ of the season — although SOME might be willing to suggest that happens into / through Labor Day weekend.
This all remains to be seen and may just be up TO JPOW and markets
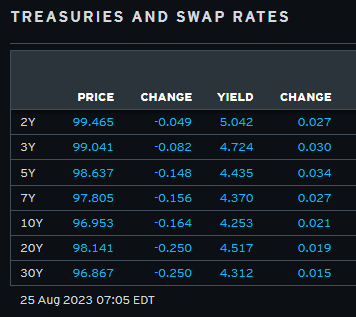
… here is a snapshot OF USTs as of 705a:
… HEREis what this shop says be behind the price action overnight…
… WHILE YOU SLEPT Treasuries are modestly lower and actually out-performing Bunds and Gilts this morning despite a weak German IFO print earlier. DXY is modestly higher (+0.1%) while front WTI futures are higher too (+1.15%). Asian stocks fell after yesterday's drop in NY, EU and UK share markets are modestly higher (SX5E +0.6%) while ES futures are showing +0.25% here at 6:55am. Our overnight US rates flows saw another muted Asian session (70% of ave volumes) with real$ selling in the long-end noted by our desk. In London hours the desk said it was the quietest morning of the week with little to report. Overnight Treasury volume including the London AM session was ~65% of ave across the curve.
From some of the news to some of THE VIEWS you might be able to use… here’s SOME of what Global Wall St is sayin’ …
Barcap - Preliminary BLS benchmark revisions: Slightly less hot to the touch (less HOT doesn’t sound to ME like anyone’s spikin’ the football over the rates CUT goal line any time soon…)
The BLS's preliminary benchmark estimate did not materially affect our understanding of the US labor market, suggesting that average monthly payroll employment gains will be trimmed from 337k to 312k in Apr 2022-Mar 2023. We are skeptical that the slightly less robust estimates will have material effects on Fed rate policy.
Bespoke - Stocks vs. Bonds (best. EVER. bonds are for losers. data mining is PROOF … )
Here's a crazy stat for you: It has been 41 months since the COVID Crash lows in March 2020 when US equity markets experienced a peak to trough decline of 35% in less than a month. Since then, stocks have more than doubled the performance of bonds. As shown below, that's the best performance ever over a similar time window, topping the strongest stocks-bonds outperformance from the tech bubble of the late 1990s and early 2000s.
BNP - US rates: Jackson Hole rate risks (reads to ME like a fancy way of sayin’ BUY bit more and bigger of a DIP in prices …)
Discussion of a higher neutral rate at this year’s Jackson Hole symposium could be a modest source of support to higher longer-term yields, but markets have already built in a material premium above the Fed’s current longer-term rate projection.
The greater risk would arise if a “higher neutral rate” assessment were used as rationale for material additional policy tightening. However, we think that is unlikely and instead expect Chair Powell is more likely to characterize it as another reason supporting a “higher for longer” approach and vigilance against the risk of prematurely easing policy.
With valuations no longer a clear headwind to duration and growth sentiment having reset higher, cyclical considerations can play a greater role from here. We think it makes sense to view further sell-offs as an opportunity to establish long exposure, with our preference to do so further in on the curve (e.g. up to 5y).
HSBC - The Major Bond Letter #38. The ‘lower for longer’ club (be careful about ONLY reading h’line and jumping TO conclusions HE — Steve Major — is drawing)
We are paying a lot of attention to bond yields in the US, Japan, and China. A glance at our chart shows two highly indebted countries where the bond markets are trying to pull away from ‘lower for longer’ rates, and another that appears to be succumbing. Markets can be wrong, but they imply that the US and Japan are attempting to move away from ‘lower for longer’ whilst China is heading in this direction.
The chart plots the change in the one-year yield, five years from now, anchored a decade ago, at the start of 2013. This forward yield is the market’s estimate of a longerrun equilibrium for policy rates, an interpretation of neutrality, where inflation is on target and there is full employment. An economy that is neither too hot, nor too cold.
So, given this picture, does ‘lower for longer’ still apply? First, what is it?
We use ‘lower for longer’ as a catch-all to describe the falling trend for the longer-run equilibrium real rate. Rates can go up and down through the cycle, but ‘lower for longer’ is about where they are likely to settle five to ten years hence. Like gravity, the longer-run equilibrium is unobservable, but we need to try to understand it. In our case, it is for the purpose of valuing bonds…
… A persistent view we hear from some investors is that bigger deficits mean more bond supply and feed through to higher yields. Whilst intuitively appealing, we find no support in the data (see Bonds are not potatoes, 20 January 2020).
In fact, we find the opposite: more debt is often associated with lower yields…
UBS / Paul Donovan - Powell speaks. Do we really care? (Donovan writes, do we really care? I write here and ask the very same question — seriously — I do, every single day I hit send … asking WHO CARES and why am I doing this?? but that’s besides the point … Donovan, I believe, is SERIOUS thinking their words and deeds don’t matter … at least not as much as his VIEW of them? IF he didn’t think WE should care he should then point us to something far more important … ? In the meanwhile, wrong or right as JPOWs view may be, we’ll all watch and discuss and try to game just how dust will settle … despite Donovan’s dismissive view?)
… Federal Reserve Chair Powell speaks at the Jackson Hole summer camp for central bankers. A simple apology is all that is required, but a speech is what we get. For all the hype, it probably does not matter that much.
Traditionally, policy makers used Jackson Hole to offer longer-term thoughts on the framework for policy. Powell does not really lead the intellectual debate at the Fed, and so the speech is more likely to be cyclical in focus. Unfortunately, the 2022 policy errors mean that markets have no reason to believe Fed forward guidance, so a cyclical speech shapes expectations only until the next data point comes along…
UBS - Paul Donovan WEEKLY - Will China export deflation? (this maybe a better question / attempt at answer and note, thought, missive than the aforementioned…)
Deflation—a broad-based decline in prices—has emerged across China’s price measures. Consumer, producer, and export prices are falling. Might China export deflation to the rest of the world?
China’s consumer and producer prices are strictly local concerns. Food, for instance, is a large part of China’s consumer price basket—and China exports very little food. China’s producer prices cover goods mainly consumed within China. But falling export prices are a different matter. China is the world’s largest manufacturer. If China’s export prices are deflating, surely other countries’ consumer prices will fall?
Life is not that simple. Much of the money a US consumer pays for something “made in China” will not go to China. For many products, less than half the price goes to the manufacturer. After the export price, there are transport costs, trade taxes, insurance, warehousing, retail costs, advertising, and so on. Profit margins will also vary along the supply chain—US retailers’ profits have risen from around 14% to over 22% of retail GDP in recent quarters.
The relationship between China’s export prices and global consumer prices is therefore blurred. In fact, China’s influence on global inflation is more likely to come from its role as a large commodity consumer, influencing global commodity prices.
AND for those out there who, like ME, are visual learners and / or arm chair technicians, a few more items from the WWW
AT mark_ungewitter (I KEN’t believe I’m sharing this one … what next, Long Bond Barbie?)
CSFB - Multi Asset Macro Pack: Key Market Themes (entire chartbook worth flipping through BUT — there’s always a big ole BUTT, isn’t there — you can always find / see whatever you WANT to see — BUTT this shop / group presents decent visuals and concepts without trying to shape / shift the narrative too terribly much — fair and balanced, if i may…)
Key Technical Themes:
With Jackson Hole fast approaching at the end of this week 10yr US Bond Yields have risen to test and hold for now the key support cluster at 4.27/4.405%, which includes a variety of levels including the 2022 yield high. With the market also capped at the top of the shorter-term trend channel from March, and with momentum not confirming the new highs we continue to look for this to try and cap and for yields to swing lower again.
Our concern with looking for this swing lower in yields remains the 10yr US Real Yield, which still maintains its large bearish continuation pattern above 1.82%.
Please note the House View has Global Government Bonds as most preferred on a 12-month horizon.
The USD continues to recover strongly as US Real Yields rise and we see scope for further strength in the DXY yet to the 38.2% retracement of the 2022/2023 downtrend and March YTD high at 105.38/105.88, but with this expected to prove tougher resistance.
A rise in Real Yields and the USD though would be consistent with further “risk off” and even though the S&P 500 is holding our 4,328/4,302 target, weekly MACD momentum has now crossed lower, and our bias is to view the bounce from here as temporary. Below 4,302 would be seen to expose a cluster of supports at 4,195/4,136, including the 200-day average.
US Cyclicals have completed a top relative to Defensives, and we look for further Cyclical underperformance, which we see as consistent with a broader market downturn.
The US Growth/Value ratio though has resolved its recent sideways range higher for the completion of a bullish continuation pattern to reinforce its existing base, and we look for a fresh phase of Growth outperformance to Value over the next 2-4 weeks.
The US is a credit-reliant economy. Many Americans tap credit cards to even cover essential living expenses. In June, revolving credit shot up 11.2 percent year-over-year to $1.26 trillion – barely under May’s record high. Interest rates on credit cards, in the meantime, have gone up 600 basis points in the last five quarters to 20.7 percent. This is a wrong combination.
In June, total consumer credit hit a new high. At just under $5 trillion, it grew 5.7 percent y/y. In April last year, it grew as high as 10 percent, so this represents deceleration from that pace.
That said, on an absolute basis, June added $271 billion from a year ago. And that is a lot, considering nominal GDP increased by $1.6 trillion in the June quarter from the corresponding period last year. Consumers are doing the heavy lifting.
Within consumer credit, revolving is growing much faster than non-revolving. Revolving credit is a committed loan facility allowing a borrower to borrow up to a limit; credit cards and personal lines of credit are the best examples. In non-revolving, on the other hand, once a line of credit is paid down, the account is closed; student and auto loans, and home mortgage are examples of non-revolving credit.
In June, revolving jumped 11.2 percent y/y to $1.26 trillion, while non-revolving grew four percent y/y to $3.73 trillion. In January last year, they both had similar growth rates – 9.4 percent and 8.6 percent respectively. Then they diverged, with revolving sharply shifting up and non-revolving shifting down (Chart 1).
Revolving began to pick up steam even as the Federal Reserve was entering a tightening mode. In March, it began to raise the fed funds rate, which had been left languishing between zero and 25 basis points for two years. In July, the central bank raised the benchmark interest rates by 25 basis points to a range of 525 basis points to 550 basis points. It is possible they raise one more time before leaving the rates at a higher plateau longer than currently priced in.
The Fed’s aggressive tightening posture is reflected in the rates consumers pay on their credit cards. In 2Q23, commercial banks’ interest rate on credit cards stood at 20.7 percent, which is the highest it has ever been going back to 1994.
The red line in Chart 2 has gone parabolic in the last five quarters, as the Fed’s tightening campaign took off and as credit card issuers passed along the higher rates. In 1Q22, these borrowers were paying 14.6 percent. It is hardly a right combination – rising debt at a time of rising rates. This has to come back to haunt consumer spending in the quarters ahead.
The latest data just out on the monetary aggregate known as M2 showed a continued shrinkage of the money supply. M2 in nominal terms is now down 3.7% from a year ago. But at the same time, nominal GDP (not adjusted for inflation) for Q2 of 2023 is up 6.3% from Q2 of 2022. That means the larger size of the economy is having to get by with less money circulating around to keep everything lubricated.
Money supply is like oil in an engine. You need a certain amount to keep everything coated with oil and lubricated. It only takes a small amount of oil to keep the valves and pistons moving, but you need a certain amount in the sump for the pump to pick up and circulate everywhere. When the oil level drops a little bit on the dipstick, the engine can still be okay, but if it drops too much then components will start to fail.
If you put too much oil into an engine, you can harm the engine that way too, making it not work properly. But if you put too much money into an economy, you get some weird effects. One is inflation, the rate of which is coming down as money supply shrinks. Another effect is that stock prices tend to benefit from all of that excess money that does not have a real mission to work on, so that excess money pushes up stock prices.
What we face now is a situation wherein money supply is shrinking, but stock prices were still rising as of July. And as we see in this week's chart, that combination has been pushing up the ratio of the SP500 Index level to M2. This is a very high level historically speaking. It did go higher in the late 1990s thanks to the Internet bubble, with predictably painful effects afterward. All of the other instances of this ratio being up this high have also led (eventually) to bear markets.
Shrinking the money supply is arguably a good idea if the problem that you are trying to solve is high inflation. So kudos to the Fed for making that happen. But as an individual investor, we cannot do anything about inflation, and our concern is knowing what stock prices are going to do. This M2 shrinkage is not bullish news for stock prices, although it may not have to take effect immediately. It is possible, as we saw in the late 1990s, for this ratio to continue a lot higher before it decides to matter.
Sorry for missin’ a (bond)beat yesterday and without much in way of notice. Thing 3s very first HS football game (a success) and boys are off and running to a great start!!
Lets see IF JPOW can do the same for markets. I’m reminded of an oldy but a goody which I thought an appropriate way to end this morning …
HOPE to have something out over weekend before Sunday night futures opening but … THAT is all for now. Off to the day job…


Yeah not the biggest fan of trumps policy but the mugshot goes hard 😂
It's an awesome mugshot, I love the intensity!
Remarkable the charts that went vertical after March 2020. I'm sure it'll all end well. I mean, Doge did :)