Reuters: Fed's Mester says one more U.S. rate hike may be needed
… “I suspect we may well need to raise the fed funds rate once more this year and then hold it there for some time as we accumulate more information on economic developments and assess the effects of the tightening in financial conditions that has already occurred,” Mester said in the text of a speech to a group in Cleveland…
ZH: Bonds, Bullion, & Black Gold Battered As Hawkish FedSpeak & Inflation Fears Lift The Dollar
… Fed Gov Michelle Bowman again said that multiple interest-rate hikes may be required to get inflation down:
“I continue to expect that further rate increases will likely be needed to return inflation to 2% in a timely way,” Bowman said in remarks prepared for delivery to bankers in Banff, Canada.
“I see a continued risk that high energy prices could reverse some of the progress we have seen on inflation in recent months.”
AND good morning (after) from some of yesterday’s DATA …
CalculatedRISK: Construction Spending Increased 0.5% in August
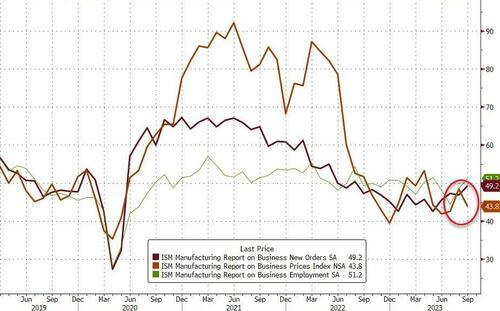
ZH: "Renewed Upward Pressure On Inflation" - US Manufacturing Surveys Signal Stagflation
However as the chart shows, the ISM's faster orders remain below 50 (in contraction)
… So, summing everything up, despite the headline improvement in the 'soft' survey data, the Manufacturing reports shows production continuing to slow while prices are re-accelerating higher... in other words 'Stagflation'.
Time to panic Mr.Powell?
… AND the market TO somewhat less than optimal data …
… essentially saying we care MORE about debt and governance (and the dysfunction) than we do — CURRENTLY — about less than optimal data … STAY TUNED but for now … here is a snapshot OF USTs as of 705a:
… HEREis what this shop says be behind the price action overnight…
… WHILE YOU SLEPT Treasuries are modestly lower and the curve has steepened overnight as central bankers (Mester, Mann, Holzmann, Lane, Simkus and Valimaki past 12hrs) burnished their 'higher for longer' chops again. DXY is is higher (+0.17%) while front WTI futures are lower (-0.55%). Asian stocks fell (China still out), EU and UK share markets are modestly lower (FTSE 100 +0.3% though) and ES futures are UNCHD here at 6:45am. Our overnight US rates flows saw better real$ selling in the long-end during Asian hours amid average volumes then. Overnight Treasury volumes were ~115% of average overall with 7yrs (151%) seeing some high, relative average turnover among benchmarks…
… Our penultimate attachment this morning looks at the overlay of Treasury 10y yields and front WTI futures. While not a perfect correlation, the two do tend to travel together (save for this spring in the weeks after the banking turmoil).Our penultimate attachment this morning looks at the overlay of Treasury 10y yields and front WTI futures. While not a perfect correlation, the two do tend to travel together (save for this spring in the weeks after the banking turmoil).
HARD to ignore (and equally hard to watch) AND noting HOPE is not a strategy but I’d sure like to see EARL DIP … and for some MORE of the news you can use » The Morning Hark - 3 Oct 2023 and IGMs Press Picks (who CONTINUES to be sportin’ that new, fresh look) in effort to to help weed thru the noise (some of which can be found over here at Finviz).
From some of the news to some of THE VIEWS you might be able to use… here’s SOME of what Global Wall St is sayin’ (in a similar sorta way you’ll find content if you pay for ZH PREMIUM? askin’ for a friend as I never understood how they do it…)
Apollo - Is China the Source of Higher US Long Rates? (maybe?)
Maybe China is behind the rise in US long rates. Growth in China is slowing for cyclical and structural reasons, and Chinese exports to the US are lower. As a result, China has fewer dollars to recycle into Treasuries. In fact, China has been selling $300 billion in Treasuries since 2021, and the pace of Chinese selling has been faster in recent months, see charts below and the presentation available here.
If slowing growth in China is a source of higher US rates—together with the US sovereign downgrade, Fed QT, Japan YCC exit, and rising US Treasury issuance—then a bad US employment report on Friday may not result in dramatically lower rates.
The bottom line is that the cost of capital will likely stay permanently higher for reasons that have little to do with the business cycle, and it was the period with essentially zero interest rates from 2008 to 2020 that was unusual.
Barclays - August construction spending shows continued strength (as goes construction spending so goes GDP guess-timates - ie UP a touch)
Construction spending rose 0.5% m/m in August, driven by private residential and public nonresidential. The figure for July was revised upwards, due largely to private residential spending…
… Barclays Q3 GDP tracker rises 0.1pp, to 4.3% q/q saar …
Bespoke - October Market Calendar (an interestingly annotated calendar showing equity market wiggles each day, historically speaking)
… Our monthly market calendar gives investors the dates of key economic indicators and other market events throughout the month. It also includes historical market action on each calendar day along with monthly seasonality figures. Give it a look by clicking the image below...
Over the last 100 years, the Dow Jones Industrial Average has averaged a gain of 0.24% in October with positive returns 60% of the time. More recently, October has been one of the stronger months with an average gain of 1.38% over the last 20 years
DB - Early Morning Reid - Macro Strategy (reasons for selloff yest)
… Starting with markets and there were several factors driving the latest sell-off. First up, the lack of a US government shutdown over the weekend was seen in a more bearish light as the day progressed, as it removed a tangible risk for the economy and was seen as raising the likelihood of more rate hikes. For instance, futures raised the likelihood of a hike at the next meeting in November from 19% on Friday to 28% yesterday. And looking at the prospect of a hike by December, the likelihood rose from 39% last Friday to 51% by yesterday’s close.
Second, the sell-off then got added fuel from the latest ISM manufacturing print for September, which was notably better than expected…
Third, comments from numerous Fed speakers reiterated the higher-for-longer narrative. Governor Bowman, one of the more hawkish FOMC members, suggested that multiple further rate hikes may be needed while Cleveland Fed President Mester saw another hike this year as likely. Comments from Vice Chair of Supervision Barr erred on the more cautious side, saying that the more important question was “how long we will need to hold rates at a sufficiently restrictive level”. Overall, despite the more encouraging recent inflation data, the latest Fed commentary shows no signs of a downshift from the September median dot plot view of another rate hike by year-end…
… The bond sell-off created a tough backdrop for equities.
DB - US outlook: Soft landing dreams or will the landslide bring it down?
… Recent data have shown material progress on moderating inflation but this likely overstates the speed and ease of convergence towards target. The final stages of disinflation could prove more difficult, and we see scope for some uplift in inflation prints in Q4. Ultimately, our inflation forecasts are little changed: We see core inflation ending this year at3.8% and 3.4%for CPI and PCE, respectively. Next year, our forecasts have been revised higher by about two tenths, though we continue to expect inflation will end the year less than half a percent from the Fed's 2% objective.
We continue to see the Fed tightening cycle as being finished. Nonetheless, there are risks of another hike(s) in the coming months if inflation strengthens prior to clear evidence that growth and the labor market are faltering. Next year, we expect the Fed will cut rates more than they and the market are signaling, although the start is now later (June 2024 versus March previously) and shallower (175bps of cuts in 2024 now versus 275bps previously).
FirstTrust - Monday Morning Outlook - Tax Policy Outlook (thinking ‘bout debt and sustainability as the clown show continues in DC, punting for another 45d?)
The fiscal year ended last week, alarms went off both literally and figuratively, and a last-minute deal was reached to keep the government open for another forty-five days. Later in October the Treasury Department will figure out the final budget numbers for last year and we estimate the deficit will come in a little north of $1.7 trillion, or 6.5% of GDP…
… The bottom line is that the US is approaching a fiscal reckoning sometime in the next few years where it will need to either reduce future spending or find more future revenue. Even tougher, this will have to happen in a geo-political backdrop where the US may have to ramp up military spending to project more power in the Pacific…
… The one thing we know for sure is the US is on an unsustainable path. If we don’t cut spending, tax hikes are eventually on the way.
Goldilocks - ISM Manufacturing Above Consensus Expectations; Construction Spending in Line with Consensus; Lowering Q3 GDP Tracking to +3.4% (apparently didn’t get the memo — Construction Spending = upward revision TO gdp guess…must have been something in the pesky details…)
BOTTOM LINE: The ISM manufacturing index increased by more than expected in September to its highest level since November 2022, but remained in contractionary territory. The composition of the report was strong, with increases in the new orders, production, and employment components. The prices paid measure fell sharply despite higher oil prices, consistent with broadening disinflationary pressures. Construction spending increased in line with consensus expectations in August, while July growth was revised up and June was revised down. The details of the construction spending report were softer than our previous assumptions, and we lowered our Q3 GDP tracking estimate by 0.1pp to +3.4% (qoq ar). We lowered our domestic final sales growth forecast by 0.2pp to +2.4%…
Goldilocks - Global Views: A Pothole, Not a Ditch (this is how we’ve all devolved from dr / patient analogs in the pandemic NOW we’re construction workers — some working with economic workbenches via The Terminal — while rest of us just playin’ along here at home)
We expect a pothole for US GDP growth in Q4–even if a government shutdown is ultimately averted–given factors including the student loan payment restart, the autoworker strike, higher oil prices, and tighter financial conditions. The weakness should prove short-lived, however, and our US view remains constructive, with only a 15% probability of recession over the next 12 months. While the EM early hikers are now mostly cutting rates, our baseline forecast is that the Fed, ECB, and BoE will keep rates at their current level until late next year. However, the risks are tilted to the downside, especially in the Euro area where Italian fiscal risk has resurfaced….
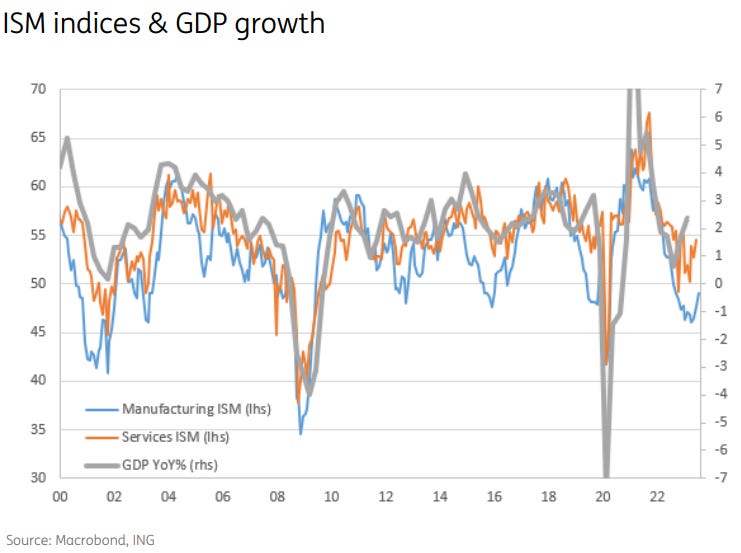
ING - US production boosts case for 4% GDP growth (as goes construction spending so goes GDP guess-timates - ie UP a touch)
Consumer spending looks set to contribute significantly to third quarter GDP growth, but with manufacturing showing signs of stabilising and construction continuing to post robust gains then we could be looking at something close to a 4% annualised increase
JEFFeries - Sep ISM Mfg PMI Rises to 49.0 from 47.6, Close to Ending an 11-Month Streak of Contraction (close … but no cigar. there’s always next month)
■ The September ISM Manufacturing PMI rose to 49.0 from 47.6, hitting the highest level since October 2022 when it was 50.0. Broadly, the data show that the manufacturing sector is stabilizing, but we suspect the tone varies significantly across the subsectors. ■ This is the eleventh straight month under 50 following a 29-month streak of expansion. This is the longest streak of sub-50 readings since September 2008 through July 2009. The environment for capex investment remains very challenging due to high rates and uncertainty about the economy, but the injection of investment from the Federal government through the Infrastructure, Inflation Reduction, and CHIPS & Sciences Acts is helping to stabilize the sector. ■ Supplier deliveries remain well under 50 for the twelfth straight month, and the index remains near the lowest level since 2009. This is a good sign of further improvement in supply chain problems but it also likely represents further weakness in current demand as well. ■ The Prices Paid index fell to 43.8 from 48.4, and remains near the lowest levels since the end of 2015. We see more evidence of inflation relief in the manufacturing PMI than in the services survey, but both are showing encouraging signs of cooling.
Wells Fargo - Construction Spending Rises in August - Manufacturing and Single-Family Outlays Propel Overall Upshift
Summary Construction Spending Continues to Buck the Headwinds
Construction activity this year has been largely resilient to broader macroeconomic headwinds. Total outlays increased 0.5% in August, solidifying an eight-month streak of improvements in 2023 and amounting to a 7.4% year-over-year gain. Yet as construction outlays rise on trend, clear divisions are forming under the surface. An uptick in singlefamily starts has bolstered construction spending over the last few months, largely owed to builders’ success with incentives in the high mortgage rate environment. Multifamily outlays, by contrast, appear to be moderating as a near-record number of apartment units is set to deliver over the next few years. Similar dynamics are playing out within nonresidential construction. A bump in manufacturing outlays was the single-largest driver of August's overall increase in the nonresidential spending, a familiar theme following the shift toward domestic electric vehicle and semiconductor production. Alternatively, tighter credit conditions and higher financing costs have weighed on commercial construction, which was the largest drag on nonresidential outlays in August.
Wells Fargo - Don’t Make a Mountain Out of Loan Bill
Summary Student loan payments are due again this month after a more than three-year pause on payments and interest accrual. For the roughly 43 million borrowers who hold student loan debt, this means increased obligations and less ability to spend on discretionary purchases. But for the broader household sector, this is a drop in the bucket. Student loan repayment should be a relatively contained headwind…
Wells Fargo - Exploring the Widening Gap Between GDP & GDI (maybe most important note here today)
Summary While it is generally something of an anomaly, it is not unprecedented for growth in income to fall behind growth in expenditures. This can happen for any number of reasons from labor market challenges to corporate profitability concerns to external trade dynamics. This report looks at why it is happening now and what it says about the likelihood of recession.
… Firms’ net interest payments look even more manageable in the context of still elevated profits (Figure 4). As net interest expense has fallen, it has weighed on overall GDI and can explain some of the gap between GDP and GDI seen today. Notably, declining interest expense at the macro level may be freeing up some cash and allowing firms more flexibility in their balance sheet management.
…Trouble On the Way Bottom line, when GDI is not growing as fast as GDP, it can reflect labor market challenges, corporate profitability concerns or external trade dynamics. We closely monitor these disparities to gain insights into the health and sustainability of the economic cycle. Note back in Figure 1, how in the lead up to the recession of the 1990s and again in the months that preceded the financial crisis, GDI broke below the zero line just before the economy succumbed to recession. Both of those periods were analogous to today in that they also marked the end of a Fed tightening cycle, a period of dollar strength and (at least in the case of the 2008 period) a sharp narrowing in the trade deficit.
Yardeni - Why Is the Bond Yield Soaring? (answers behind the paywall, I presume…)
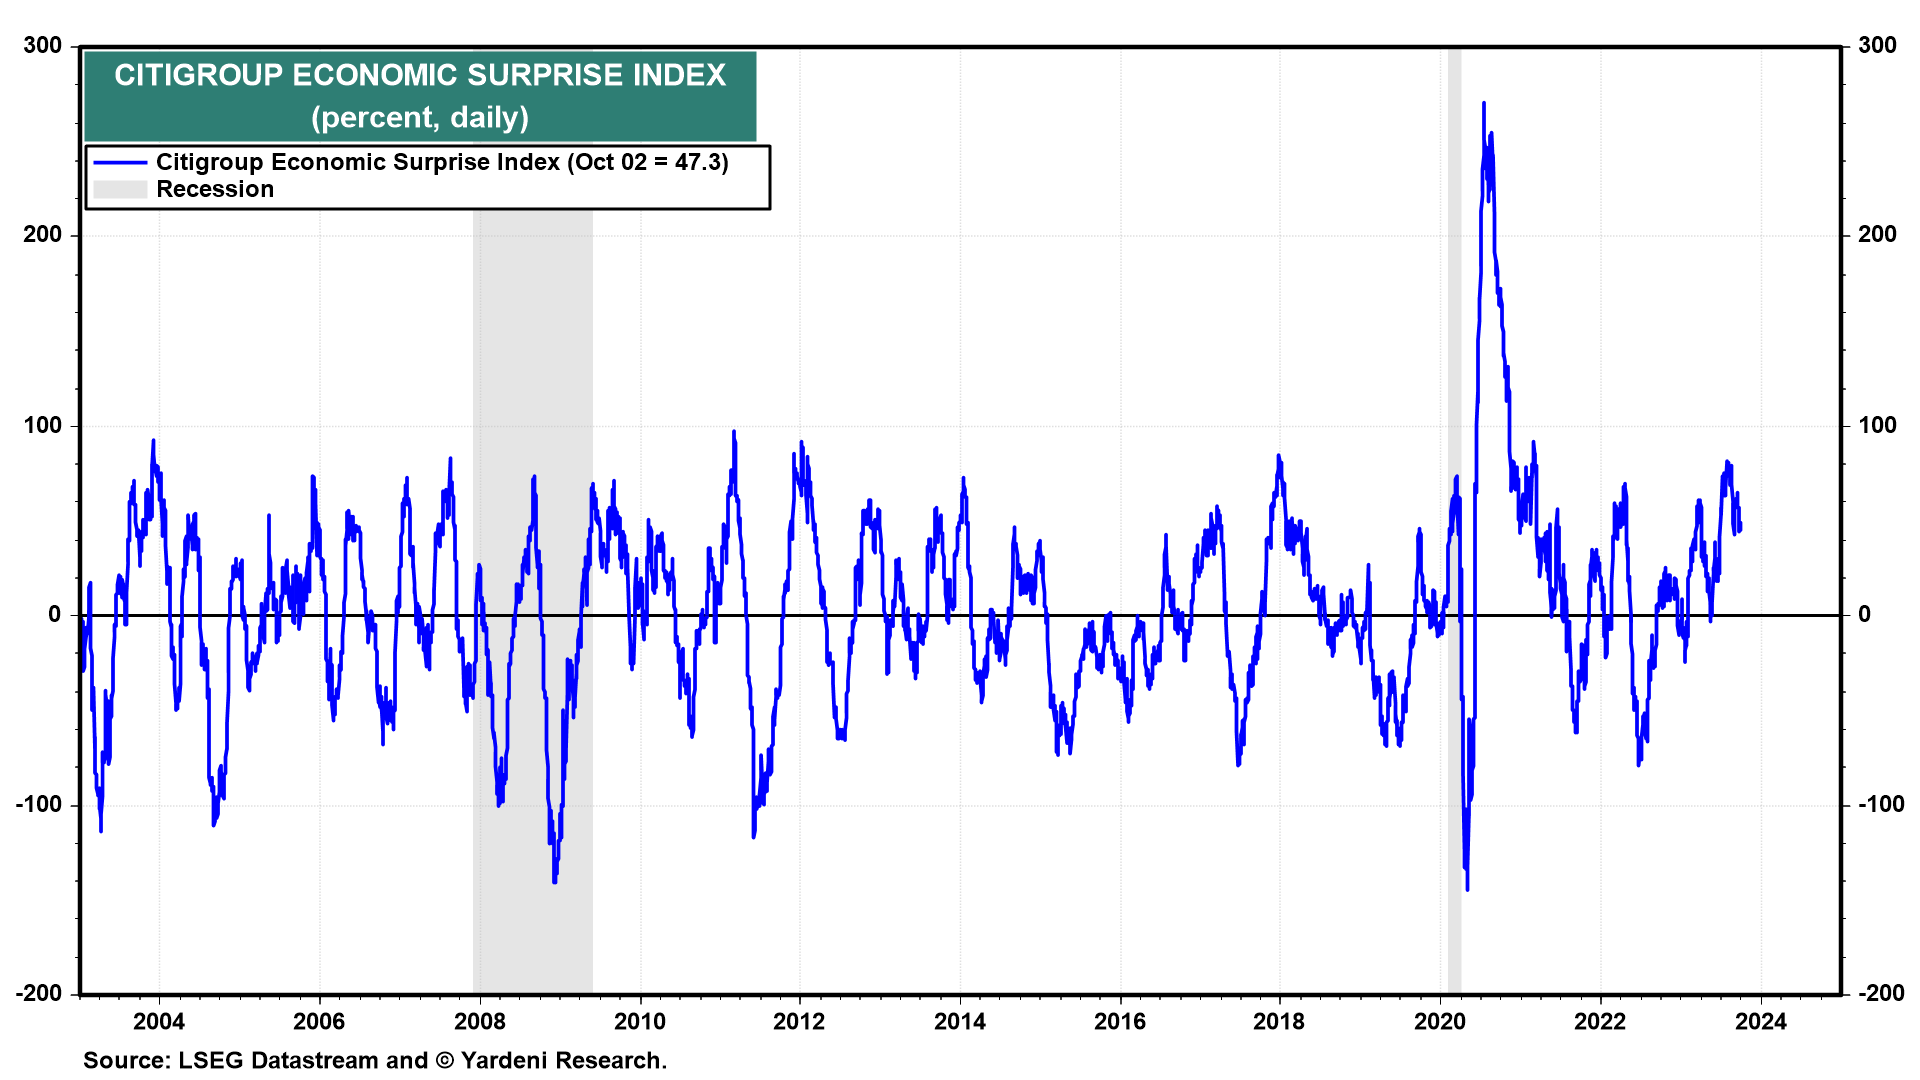
The latest batch of economic indicators was weaker than expected. On Friday, we learned that real personal consumption expenditures rose just 0.1% during August. The core PCED edged up by only 0.1% during the month. September’s Consumer Sentiment Index fell 1.4 points to 68.1. As a result, the Citigroup Economic Surprise Index (CESI) is down to 47.3% from a recent high of 81.9% on July 27 (chart).
The 10-year Treasury bond yield should have declined on the news since its 13-week change tends to track the CESI closely. Instead, the yield has continued to march higher, up to 4.70% this morning.
This morning's relatively weak readings for September's M-PMI (still below 50 at 49.0) and a weak prices-paid sub-index (43.8) didn't stop the yield from moving higher (chart). The latter suggests that September's CPI inflation rate for goods remained subdued.
… And from Global Wall Street inbox TO the WWW,
Bloomberg - Surging bond yields still aren't breaking anything yet (Authers OpED talking about mostly everything - stocks, gold, earnings — besides … bond yields)
DataTREK - Q3 and YTD Performance Review
…#1: Global/US/Non-US equity market returns:
Comment (1): Non-US equities outperformed domestic stocks in September in dollar terms despite across the board weakness in non-dollar currencies. Broad measures of US equity market performance were 4-6 percent lower for the month, with non-US stocks down 2-4 percent.
Comment (2): August’s weakness in global equities spilled over into September, with no major region showing positive price returns in either month. This was enough to make Q3 a money losing quarter across the board.
Comment (3): In US equities, large caps (S&P 500) bested small caps (Russell 2000, S&P 600) in September, and the Dow lost the least of any major index. Last month’s declines were enough to push the S&P 600 into negative territory for the year on a price return basis…
… #6: US Big Tech’s contribution to S&P 500 returns. The table below shows how much each name has added in percentage points to the S&P’s gains/losses and the group’s aggregate contribution to index performance over the relevant periods. The final line, in bold, shows the percent of S&P 500 returns derived from Big Tech for the relevant period.
Comment: While US Big Tech was responsible for the lion’s share of S&P gains in Q1 and Q2, these names were much less influential on index returns during Q3’s July rally and August/September sell-off. Big Tech stocks are 27 percent of the S&P 500 by weighting, and their collective influence on index returns in Q3 ranged from 16 to 35 percent…
… Summing up: September was another tough month for equities, but this fits the framework we have been discussing with you over the last few months. While we remain cautious over the very near term, we continue to believe stocks will find their footing later in Q4. And, not that it’s any real comfort, but if we had told you that rates would break out the way they did in Q3 you would have rightly expected stocks to do much worse last quarter. Once yields stabilize, equities should do the same.
HedgOPIA - Equity Indices At Decent Support; Near Term, Odds Favor Equity Bulls More Than Bears (as stocks go, so goes bonds with now NOT inverse correlation? or are bonds a hedge? I forget … askin’ for a friend — whatever the case may be, interesting eye candy from Hedgopia)
… A bearish head-and-shoulders pattern has also formed on the Russell 2000, and the neckline at 1800 was broken in the week before. If the pattern completes, small-cap bears will in due course be targeting 1600. In June and October last year, the selloff that began in November 2021 ended at 1640s (Chart 2). But for this scenario to pan out, 1700 needs to give way and before that 1740s, with the latter representing a rising trend line from last October. In three sessions last week between Monday and Wednesday, bids showed up at 1760s.
At the same time, sellers showed up both Thursday and Friday just north of 1800. The small cap index ended the week at 1785. Once 1800 is reclaimed – with decent odds of that happening – the path toward 1900 opens up.
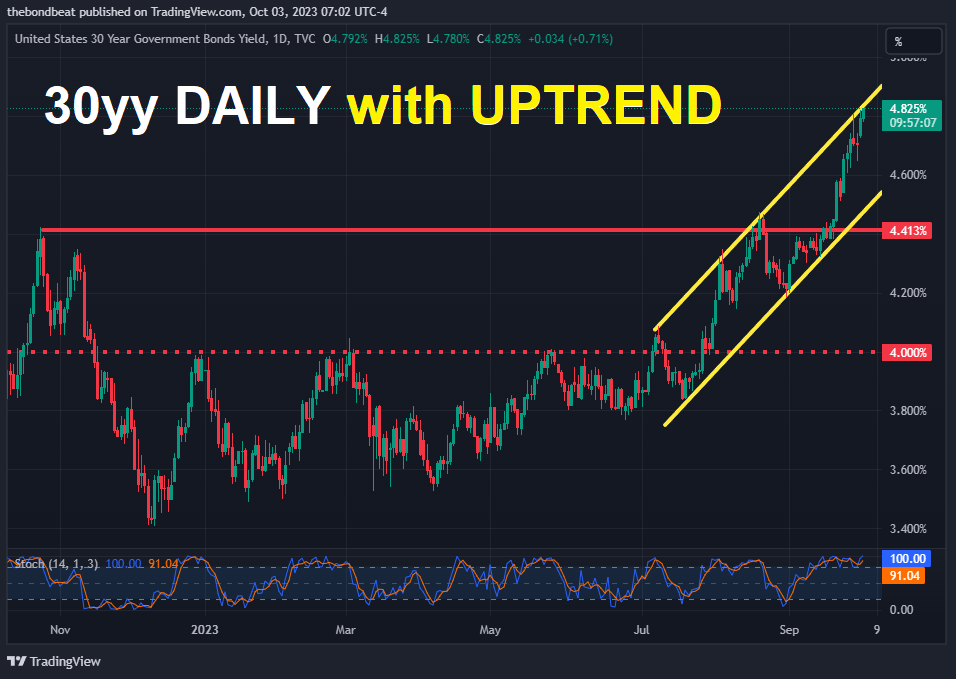
… 2/ Long Bond Exhausted …During September, the 30-year treasury yield (TYX) jumped to the highest level since February 2011. It spiked to 4.67% from 4.2% at the end of August. With this move, the yield is now bumping into a myriad of resistance levels. The first level is where the long bond yield rallied and failed in May 2008, May 2009, March 2010, and then February and March of 2011. The second resistance level is the upper Bollinger Band.
These resistance levels are also coinciding with an overbought monthly Relative Strength Index (RSI) at 73. Additionally, there is a bearish divergence present. This is where the most recent yield moved to a higher high while the RSI made a lower high. Remember, bond prices move inversely to yields. When yield declines, the price of the treasuries will increase as a result.
There is a high probability that long dated treasury yields at least take a pause at these levels, but more than likely we could see lower yields in the short term. If there is a move lower, look for a potential retest of the most recent break out at 4.2% (yellow support line). If the 30 year fails to find support here, it would put the blue support line in play around 3.45%.
WisdomTree- Prof. Siegel: What Is Driving Rising Yields? (again asking THE question which is on everyone’s mind …)
While a number of headlines captivate media focus from the autoworkers strikes and the debate over the government shutdown, the equity markets have been dominated by rising yields in the bond market over the last 4-6 weeks.
The incessant pressure for higher yields comes from two factors: oil prices, but most importantly, the strength of the economy. The trade report (net imports and exports) came in very strong last week and that has ratcheted up revisions to third quarter GDP estimates. We likely will not reach the 5% GDP growth figures the Atlanta Fed GDP Nowcast suggests, but 3.5% or above is quite a strong showing.
Jobless claims again came in very low, just above 200,000 jobs, indicating no slowing in the labor market. There was a strong durable goods data report last week; a little bit of a revision downward from the previous month, but still the momentum is upward.
Although there is no evidence of a slowdown in the economy yet, we have higher interest rates and mortgage rates may soon exceed 7.5%. Some are facing mortgage rates above 8%. Yet, despite these higher rates, the Case-Shiller Home Index released on Tuesday again showed another increase in home prices for August. This data is a little lagged, so perhaps the housing prices may cool a bit in October and November if rates stay elevated.
We also received fresh money supply data last week which showed a decrease, the first time since April. The net increase from the April low is paltry. And let’s remember that money supply is a key metric for gauging inflation. I’ve examined the excess amount of money created through Fed policy from a long-term trend. Since COVID, we’ve had 12% in above-trend growth in the money supply. Note, this is not the absolute increase (which is up 30%), but the amount created in excess of the 5% trend growth rate that prevailed in the previous decades. The 5% M2 growth level is an important benchmark to keep in mind and the money growth rate we want to see in a normal functioning economy with 2-3% real growth and 2-3% inflation.
Inflation since pre-COVID has also now been about 12% above the long-term trend in inflation of 2% to 2.5%. This is a quite interesting development and says to me that inflation has finally caught up to money growth.
Some praise the Fed for bringing about “the immaculate disinflation:” a cooling of inflation without causing excessive unemployment or a recession. I wrote in Barron’s last Friday that we should not give the Fed credit for fixing a problem they created. It is comparable to the Fed recklessly driving on the streets, hitting a pedestrian and then rushing him to the hospital so he did not die. But there are still massive injuries; the American public suffered through the worst inflation in 40 years—something that did not have to occur had the Fed curtailed its money growth much earlier.
The market is pivoting all around yields but if we look at the long-term, I see the S&P 500 selling at about 17.5 next year’s earnings. Yes, there might be a recession next year and those earnings estimates might be too optimistic. But 17.5 is a very good long-term ratio with a 5.7% earnings yield. Stocks still represent an excellent investment at these levels. Of course, TIPS yields have also risen, and investors can get 2.2% real on 10-year TIPS but there is still a 3.5% advantage for stocks.
And what does Steve have to say about Santelli's potential 13% yielding 10 yr note in the not-to-distant future? A 5-handle on that 10 yr appears incoming....
I'm NOT a crash caller, but when Gold's slammed yields UP dollar UP oil (EARL!) UP (interesting mid-day EARL reversal today) gets my attention. BIG time. I'm on Crash Watch. If nothing else, CONfidence in the US of A appears to be Wanning currently.