Good morning. Some news making the rounds which MAY have some market implications …
Axios: Israel-Hamas deal on hostage release and ceasefire is imminent, sources say
Risk ON? Oil DOWN? Rates UP? Unless, of course, this is seen as short-term distraction THEN perhaps all just the opposite…too soon to tell and any / all efforts to free hostages SHOULD be applauded first, criticized and over-thought later.
As the holiday long weekend draws closer and 2024 outlooks have dropped into inboxes, there’s thankfully little to mention and so I’ll try NOT to labor the point … and so, lets labor on the 20yy point on the yield curve …
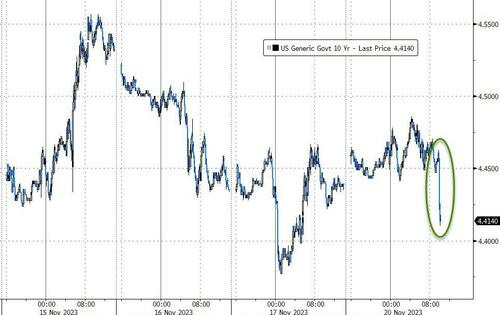
… Momentum remains overBOUGHT and time at a price CAN / will resolve (as will a bit of a hiccup HIGHER in yields). I’ve added 50dMA and a TLINE dating back to Nov 2022 ‘cheaps’ and with a further decline in yields, 4.66% would seem to ME a level where sellers might let some of the recent supply go … book some profits.
AND speaking ‘bout that 20yr auction
ZH: Yields Tumble, Stocks Spike After Stellar 20Y Auction
We knew that going into this week's holiday-shortened week liquidity would be challenging; but nobody expected it to be this bad: moments ago the Treasury sold 20Y bonds in a solid auction with decent bidside demand, and while this was a far cry from the recent "catastrophic" 30Y auction, the market reaction was as if the Fed has resumed QE, with yields tumbling across the board and stocks suddenly surging to session highs amid a burst of program buying. More on that in a second…
… The internals were more notable: Indirects were awarded 74.0%, the highest since June, and well above the recent average of 70.1%. And with Directs awarded 16.5%, just above last month's 15.2% if below the recent average of 19.75%, Dealers were left holding 9.5%, below the six-auction average of 10.2%, and in line with single-digit allotments in 4 of the past 6 auctions.
… The auction result, which impacted the historically most illiquid tenor on the curve, was immediately taken by the market as a sound endorsement of the Biden admin's "spending like a drunken sailor" fiscal policies and yields immediately plunged to session lows, down almost 5bps in seconds...
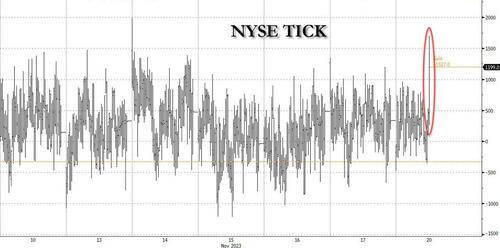
... while stocks jumped to session highs, with the NYSE TICK indicators surging as high as 1700, the highest since CPI Tuesday's 1989 TICK print, which in turn was the highest since February.
…which reminds me of one from WSJ from end last week,
WSJ: Where Have All the Foreign Buyers Gone for U.S. Treasury Debt?
Overseas private investors and central banks now own about 30% of all outstanding U.S. government debt, down from roughly 43% a decade ago
Foreign Flows Buying or selling of U.S. Treasurys from overseas
… Masatoshi Yamauchi, an executive officer at All Nippon Asset Management, whose main clients include regional banks, said Japanese banks have continued to invest in U.S. Treasurys, but with shorter durations, and without hedging currency risk, which is currently very costly for Japanese investors.But they, too, might soon lose interest in the U.S., he warned.
“They are getting full,” he said. “Interest rates are becoming more attractive in their mother market.”
… here is a snapshot OF USTs as of 705a:
… HEREis what this shop says be behind the price action overnight…
… WHILE YOU SLEPT Treasuries are modestly higher and the curve a touch flatter after decent flattener flow was seen via futures blocks overnight. DXY is little changed while front WTI futures are modestly lower (-0.4%). Asian stocks were mixed, EU and UK share markets are mixed while ES futures are modestly lower (-0.13%) here at 6:45am. Our overnight US rates flows saw a firm trade in Treasuries during Asian hours with the curve flatter after two block flatteners posted then: FVZ->USZ then FVZ->WNZ. In cash space, our desk saw modest buying in intermediates. In London's AM hours, we saw receiving interest in 10's and 30's and more flattener blocks that took prices to their highs in early London. From that point, selling flows became more prominent (selling in 20's from systematic names, steepening interest in 5s30s). In early London hours, 3's also traded quite cheap vs curve (Tsy 2s3s5s 'fly +1.2bp at one point) with some interest to fade that according to the desk. Overnight Treasury volume was pretty decent at ~115% of average across the curve…
… Our last attachment this morning is an interesting, longer-term look at TLT's, the 20+ year Tsy ETF. We think we may be seeing a bookend in the making. At the start of the pandemic in early 2020, TLT's jetted to new all-time highs while tracing out bearish divergence (lower highs in monthly momentum, as drawn in) in the process. By early summer of 2020, long-term momentum had flipped bearishly while confirming the bearish divergence-- ultimately leading TLT's to today's prices. Well, last year's move low and October's decade+ low have also traced out possible Bullish Divergence, as drawn in. It could be as soon as this month's closes where we get some confirmation that the bear trend in TLT's in place since early in the pandemic... has reversed.
… and for some MORE of the news you can use » The Morning Hark - 21 Nov 2023 and IGMs Press Picks (who CONTINUES to be sportin’ that new, fresh look) in effort to to help weed thru the noise (some of which can be found over here at Finviz).
Moving from some of the news to some of THE VIEWS you might be able to use… here’s SOME of what Global Wall St is sayin’ …
Apollo: Rates Higher for Longer Continues (nobody puts baby in a corner but then … somebody who responded TO UoMISSaGain survey sure seems to have put FED in a corner…)
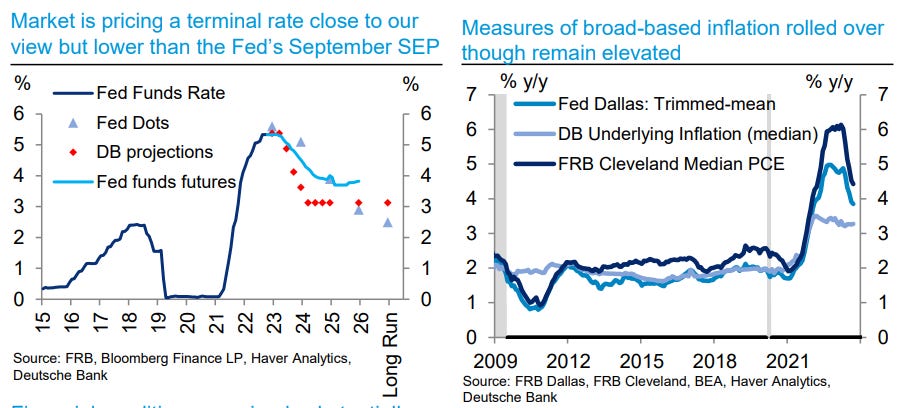
The Fed cannot begin to send dovish signals when inflation expectations jump higher the way they have done recently, see chart below.
It's been the worst of times and the best of times for the Nasdaq 100, which marked the two-year anniversary of its record high from 11/19/21 over the weekend. After falling over 35% from the record high through the October 2022 low, the Nasdaq 100 has since rallied over 50%, leaving it down just over 5% from its record high. Like a QB scrambling all over the field only to end up getting sacked a few yards short of the line of scrimmage, the Nasdaq 100 has expended a ton of energy with little to show for it over the last two years.
While the Nasdaq 100 itself is down just over 5% from its record high, stocks in the index are down slightly more than that since 11/19/21 with an average decline of 6.3%. Among individual stocks, though, there have been some big winners and losers. Starting with the winners, the table below lists the 20 Nasdaq 100 stocks that have rallied 20% or more since the November 2021 peak. Leading the way higher, shares of Vertex Pharma (VRTX) have rallied just shy of 92%, followed by Broadcom (AVGO), PACCAR (PCAR), Diamondback Energy (FANG), and O’Reilly Automotive (ORLY), which are all up over 50%. We were surprised to see that while NVDA has been one of the top-performing stocks this year, since the 2021 peak, its 49.5% gain ranks only as the seventh-best performance.
BNP: Quant Trades of the Week: Short EURBRL, SPX–UST 10y RV, UST-Bund compression
KEY MESSAGES Market themes:
Risk sentiment appears elevated, but our global cross-asset indicator is not yet significantly stretched.
We therefore remain pro-risk this week, adding short EURBRL to our existing trades of long oil and CSI300.
We favour adding defensive exposures, (short SPX vs UST) but we do not think it is yet the time to enter large defensive trades.
The positive correlation between equities and rates has been strengthening, and equity is starting to appear overbought.
New trade ideas: Short EURBRL, short S&P 500 vs long UST 10y futures, 10y UST vs Bund compression.
… Initiating an S&P 500 rally fader: Since the end of October, the market has been interpreting the most recent economic data prints as good indicators of no need for further rate hikes from the US Federal Reserve. This not only drove Treasury yields lower, particularly at the long end of the curve, but also triggered the recent recovery in equity markets, with the S&P 500 advancing about 10% from trough to peak at the time of writing.
Technically, we see that the S&P 500 is neighbouring a resistance level while our US Equity Risk Premium index is close to extreme risk-seeking levels (see BNP Paribas Risk Premium Update, 20 November). Additionally, according to our MarFA™ Macro model, the S&P 500 is overbought by 1.4 z-scores, with 75% of its fair value explained by the primary principal component (PC1), which we currently find to be mainly rates driven.
Given this, we consider it attractive to position short S&P 500 against a long position in US 10y, with the following benefits:
a hedge in case yields continue to decline and provide further impetus for risk assets to rally; and
an RV trade, which we expect to benefit from the S&P 500 appearing overbought versus MarFA™ and US 10y appearing rich vs MarFA™.
We initiate a position for a short-term fade of the recent rally, by entering a short position on the S&P 500 … while hedging for potential upside risk by entering long US 10y (future) …
… For now at least, the more positive news for risk assets actually saw investors take out a bit of the more dovish pricing for next year. For instance, the rate priced in by the Fed’s December 2024 meeting ticked up +3.1bps to 4.44%. And in turn there was a selloff at the front end of the treasury curve, with the 2yr yield up +2.5bps to 4.912%. Meanwhile, the $16bn sale of 20yr US Treasuries was stronger than expected and longer end rates rallied as a result. 20yr yields were priced at 4.80% just ahead of the auction before falling nearly -5bps in the minute after before finishing down -2.2bps on the day. Similarly, 10yr UST yields were +2bps higher prior to the auction before rallying sharply and finishing -1.6bps lower overall on the day at 4.42% and falling another -2.5bps in Asia this morning.
DB: Softer data allow Fed to ignore FCI easing, for now (higher rates equal a tightening SO what then of recent bond market BID…?)
Despite the soft October CPI report showing continued progress on inflation (See US Inflation Outlook: Back on track?), officials – including Governor Barr, Daly (SF), Mester (Cleveland), Barkin (Richmond), Goolsbee (Chicago) - mostly reiterated Chair Powell’s messages that the Fed should move carefully and they need to see more evidence to be confident that inflation is on a sustained downward trend towards target. That said, the more hawkish officials softened their tone some. In particular, Mester noted that she viewed the current policy rate as “well-positioned” and has not decided if further hikes will be needed.
On the other hand, the more dovish officials did not shift their view towards in a more dovish direction and remained hesitant to take further rate hikes off the table, including Collins (Boston) and Governor Barr. Barr maintained his view that the current policy rate is likely at or near the peak, and the Fed should not put too much weight on any single data point. While the market is now pricing the first rate cut in 2024Q1, Daly indicated that they are “not happening for a while” and Goolsbee continued to see a long way to go on inflation.
Overall, these Fed communications reinforced our view that the likelihood of a December hike is very low and we have reached the end of hiking cycle. That being said, Fed officials will keep the optionality for further hikes in order to not prematurely declare victory on inflation. While the Fed did not seem too worried about the recent easing of financial conditions over the last couple of weeks, with recent data showing progress on the labor market and inflation, the Fed can afford to be less concerned with financial conditions given that they remain substantially tighter than they were in late July. However, should future hard data show less progress, Fed officials may look to tighten financial conditions further.
FirstTrust: Consumer Spending Set for Slower Growth (hey thats GREAT …)
…In the year ending in September, “real” (inflationadjusted) consumer spending is up 2.4%, no different than the growth rate in the ten years immediately prior to the onset of COVID. However, there are multiple reasons to believe that growth rate should soon decline.
First, much of the increase in spending in the past year has been driven by increases in jobs. Total payrolls are up 243,000 per month in the last year, which is unusually fast given an unemployment rate below 4.0%. A slowdown in job growth should limit the growth in consumer purchasing power.
Meanwhile, consumers have been eating into the excess saving they were able to accumulate during COVID, back when the government was passing out checks with reckless abandon. Immediately prior to COVID, in February 2020, US consumers, in the aggregate, were accumulating savings at a $1.28 trillion annual rate. That’s personal income, minus taxes, minus consumer spending. By contrast, in September 2023, consumers were saving at a $690 billion annual rate…
…Then there are student loan payments that have finally re-started. By itself, that’s unlikely to be a major issue; we estimate the effect at about 0.2% of consumer spending. But it should be a small headwind…
… Some economists are already taking a victory lap because they didn’t forecast a recession and a recession hasn’t started yet. But we think they’re declaring victory too early. Some of them say that we never should have been worried about a recession while inflation fell because the surge in inflation was due to supply-chain issues, and then the reduction in inflation has been due to fixing those issues.
The problem with their theory is that they ignore the link between the surge in the money supply in 2020-21 and the inflation that followed, as well as the drop in money and the reduction in inflation this year. They think it’s a coincidence, but we think they’re going to get a rude awakening in the year ahead.
… In bonds, CTAs have accelerated their buy back program. They cut 35/40% of their overall shorts in the last two weeks ($50/60mln Dv01). Similar to equities, flows are likely to remain positive but lighter, with another $30/40mln Dv01 expected. JGBs is the market to watch, as forecasted inflows are worth 30% of the average daily volumes …
Wells Fargo: The Office Market Remains Off-Kilter (in case you hadn’t heard…)
Cyclical Headwinds Intensify as Structural Strains Persists
Summary Hybrid Work Keeps the Office Market Off-Balance The office market has yet to find secure footing. The knock-on effects of hybrid work continue to depress demand. Slower employment growth among office-using industries stands to be the next challenge. Meanwhile, supply continues to expand. Broadly speaking, firms are placing unneeded space on the rapidly expanding sublease market. Once leases roll over, many businesses are consolidating into higher quality spaces. New development has slowed sharply recently, yet the projects started over the past several years are now being completed and coming to market. All told, the office vacancy rate has risen sharply and is currently at the highest level since at least 2001. What's more, the Federal Reserve's battle against inflation has resulted in higher interest rates, rising cap rates and lower valuations. With structural and cyclical storm clouds looming large, prospects for the office market remain highly uncertain.
… The sluggish return-to-office is one factor that is dragging down demand. According to Kastle Building Systems Back-to-Work monitor, weekly office occupancy continues to hover around 50% of the pre-pandemic norm. There remains quite a bit of variance by market. For example, among the 10 cities monitored by Kastle, weekly occupancy averaged 61.4% in Houston and 41.1% in San Jose during the week of November 8th (chart). Occupancy also varies by day of the week. Nationally, office occupancy was almost 60% on Wednesday and nearly 33% on Friday during the week of November 8th. Both are up only marginally from prior year levels.
Summary The Leading Economic Index (LEI) was down again in October. For more than a year and a half this bellwether has signaled a recession that has yet to arrive. We look at prior cycles to consider to what extent the severity of decline in LEI is indicative of the magnitude of recession.
… The point being: growth in the LEI and GDP don't always move in step, though the divergence today is clearly larger than most.
Yardeni: S&P 500 Set To Vault To New Bull Market High (simple graphic caught my attention)
The S&P 500 peaked this year on July 31 at 4588.96 (chart). It closed today at 4547.38, which just happens to be the resistance line connecting the July 31 high with the all-time high of 4796.56 on January 3, 2022. It could easily rise to this year's high, which is just shy of our 4600 year-end target by vaulting over the resistance line. With the benefit of hindsight, our year-end target might be too conservative. A move up to the match the record high is conceivable either by yearend or sometime early next year.
… And from Global Wall Street inbox TO the WWW,
Bloomberg: Treasuries Rise to Erase 2023 Losses as Fed Cut Bets Blossom
Volatile year saw $26 trillion market swing from gains to loss
Rally eases concerns of a third-straight year of declines
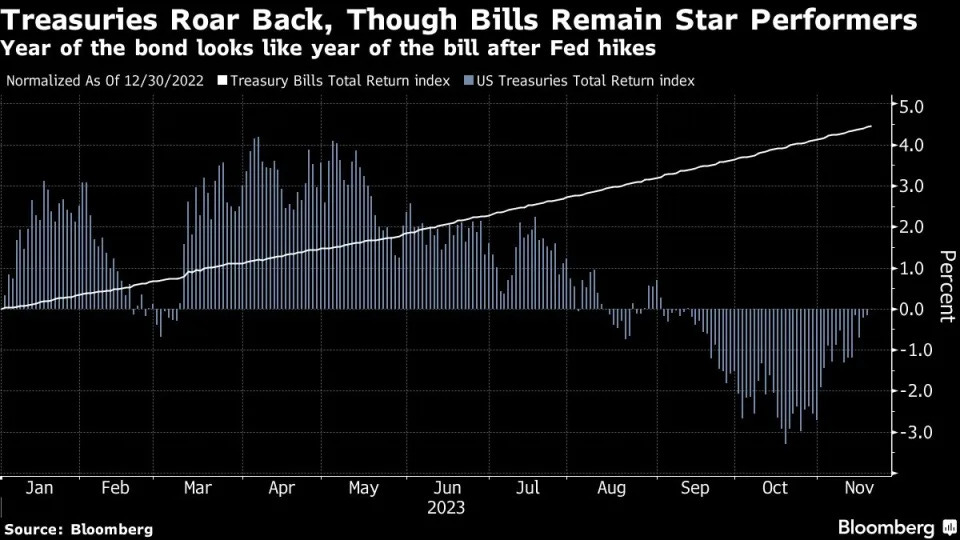
… Investors had anticipated that 2023 would be the “year of the bond,” but were instead hit by waves of turmoil as a resilient US economy prompted the Fed to extend its steepest tightening cycle for a generation. The losses pared as inflation eased, with traders positioning for rate cuts starting in the first half of 2024.
“Growth momentum has peaked, inflation momentum has peaked and central bank tightening cycles are done,” said Andrew Ticehurst, a rates strategist at Nomura Inc in Sydney. “Yields are still much higher than they were, and there is room for rates to rally on risk-off developments.”
Even a flat year might be a welcome respite for bond investors, after Treasuries lost a record 12.5% in 2022, following a 2.3% hit the year before. A strategy of merely holding Treasury bills has earned 4.5% this year.
Bloomberg: 5 things to start your day (EZ, talkin’ bonds)
… While Monday’s 20-year sale helps ease doubts over longer-maturity Treasuries, this part of the bond market owes more of its rally to the turnaround in inflation and Fed rate expectations. And it has room to run so long as markets stick to the belief that rate hikes are now behind us.
The 30-year auction earlier this month, which was one of the biggest flops in the past decade by one measure, was significant because it raised serious concern over investor appetite for long-dated debt. It also came on the same day that Jerome Powell said the central bank won’t hesitate to raise rates further to curb inflation.
Since then, we’ve got data that showed a pullback in the CPI, which prompted traders to reverse course on rate-hike bets and start pricing in rate cuts.
We’ve subsequently seen investors pile back into long-duration debt as inflation measures cool — a trend seen not only in government bonds, but also in US credit. Perhaps a misguided move, given faltering real yields could stop the rally in its tracks. And in any case, recent Fed commentary signals the prospect of rate cuts are nowhere near imminent.
Yet even hopes for such a move — combined with cooler inflation and the fact that long-dated debt has got cheaper — are evidently enough to at least put this part of the bond market back in favor with investors.
Bloomberg: There's still no ride like a free ride in free markets (Authers OpED)
… N-n-n-nineteen Just in time to arrest the growing optimism that a recession has been canceled and not merely postponed, the Leading Economic Indicators extended their losing streak to 19 months. The LEI, which are administered by the Conference Board, smoosh together 10 measures that indicate the strength of the economy, ranging from jobless claims through the stock market to the bond market yield curve. Over time, it’s been one of the most reliable recession indicators there is.
As the chart below shows, all the significant falls in the LEI since its inception have been followed by recessions. Perhaps more interesting is to chart is when the economy made a “soft landing.” Besides the most widely recognized one in 1995, when the US kept growing after the Fed had sparked a bear market in bonds, some claim further soft landings in 1965, 1984-5, and 2019 — when the economy stayed afloat despite aggressive hiking by the Fed, until the pandemic arrived. Those putative soft landings are marked below:
If this downturn for the LEI doesn’t turn into a recession, then it will be time to abandon them as a useful indicator. There is no precedent for a decline this protracted or deep failing to end in recession.
Digging in to the indicators themselves, they include the Conference Board’s own version of the “yield curve,” which compares the overnight fed funds rate (rather than the three-month or two-year yields that are usually cited) to the 10-year Treasury yield. When this curve inverts, meaning that the 10-year yield drops below the fed funds rate, that’s taken to mean the market is convinced the Fed will have to cut in future (because of a weak economy). Charting that version of the curve, below, we find a few momentary inversions that sent a false signal, perhaps most significantly in late 1998, when the Russian default and the Long-Term Capital Management meltdown appeared likely to dump the world into recession. But whenever an inversion lasted this long, a recession followed.
Belief in a “Goldilocks” outcome is growing. For those who make arguments like this about the lack of precedents for an outcome, there is always the response that the pandemic created conditions unlike anything previously seen in the modern economy.
That said, the guideposts that worked in the past suggest that the plane is in for a bumpy landing.
Hedgopia: Complacency Running High Pre- And Post-CPI, VIX Approaching Crucial Support Likely To Tempt Contrarians To Enter Trade
… Last Tuesday, when the CPI was reported, the 10-year treasury yield dropped 19 basis points to 4.44 percent. This acted as a tailwind for equities, with the S&P 500 rallying 1.9 percent. For a while now, stocks have taken a cue from the long end of the yield curve, but the relationship between the two is not always this simple. In Chart 2, the orange vertical lines denote times when the 10-year yield and the S&P 500 went in opposite directions, while the black lines represent the times when they moved hand in hand.
Yields have been under pressure since peaking at five percent last month. For three consecutive sessions in October, the 10-year tried to unsuccessfully take out that level, with the high of 4.997 percent recorded on the 23rd. This was the highest print since July 2007. Rates peaked at 5.32 percent in June back then, before coming under sustained pressure to eventually bottom at 0.40 percent in March 2020. In 2007, the 10-year peaked just before the onset of the global financial crisis.
Stocks will do well in a low interest rate environment in a goldilocks environment. The fed funds rate currently stands at a range of 525 basis points to 550 basis points, up from zero to 25 basis points in March last year. The Fed is also reducing its bloated balance sheet. The last hike in the fed funds rate took place this July. It is probable the economy is yet to absorb all of the 16-month tightening, which only means growth deceleration in the months/quarters to come. In this environment, stocks are likely to then respond to a probable hit to earnings than merely to lower rates.
WolfST: “Leading Economic Index” Predicts Recession for Early 2024, after Having Predicted a Recession for Late 2022, Early 2023, Mid-2023, and Late 2023
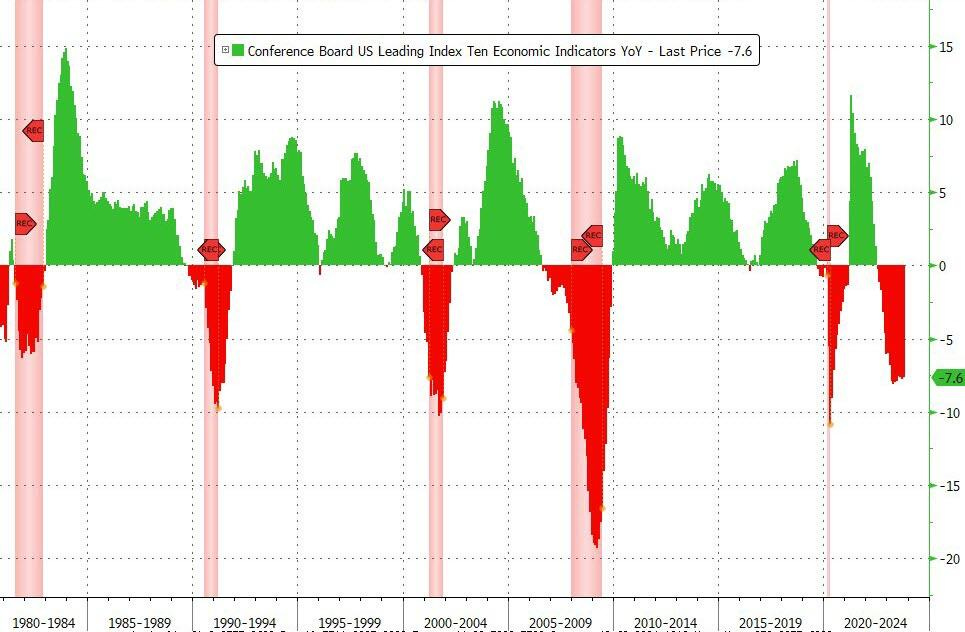
ZH: US Leading Indicators Tumble For 19th Straight Month, Worst Streak 'Since Lehman'
… And on a year-over-year basis, the LEI is down 7.6% (down YoY for 16 straight months) - close to its biggest YoY drop since 2008 (Lehman) outside of the COVID lockdown-enforced collapse...
… Finally, as substacks going from free to behind paywall and me trying to figure this all out still, i’d thank one and all for subscribing TO this place on the innertubes and wish those who’ve opted OUT, the very best of luck as well !!
I hope you too find whatever it may be that you are searching for AND … THAT is all for now. Off to the day job…


Excellent Recap !!!!!
Thought the 20yr auction went well after I saw the market reaction...
Thanks for the Auction details.....
Who says markets are Rational and not Emotional ???
A fickle Bond Market could change its sentiment with one bad Inflation print ???
The action seems to be mostly at the Long end.....Sorry, Stan D....
Been awhile since we've seen Euphoria.....makes you giddy, but it can be hazardous.....
Yup Harkster is still sporting that Fresh New Look, only now with new & improved FEES