(USTs modestly cheaper on light volumes)while WE Slept; prices at pump, NFP, CPI and FOMC pre caps & victory laps; the bull steepening (again) ... and more
Long bonds are becoming overBOUGHT (so, RICH) on a medium term (weekly) basis and by very same metric (stochastics, INSET) are starting to work off this condition and yields reflexing HIGHER … ahead of NFP and this weeks end …
… clearly this is worth watching / noting into NFP and on thru the days / WEEKS end. A ‘good’ number for the markets will be a weak one. A ‘bad’ number then will be strong. It seems to ME (and others) we’ve spent lots of time pricing IN ‘good’ (skating to where one thinks puck is GONNA be) and I was recently reminded of the moves this year relative to those at this time LAST YEAR … remarkable similarities and so one should approach year end (amateur hour for rates and other markets trading) with EXTREME caution.
If you haven’t YET made your year, NOW is likely NOT the time to press. YET, like night follows day, this is likely what will happen … exaggerating moves in ALL directions…
This note SHOULD short and to the point (but you’ve gotten to know me and that's, well HARD) … but I’ll try. Oh, who am I kidding that ship has sailed and so, I’ll begin with some news from Tokyo …
NikkeiAsia: Japan's Q3 GDP revised down to 2.9% contraction (… on an annualised basis from the 2.1% prior estimate … and so downward revision here seems like an opportune time to continue thinking about exiting easing!)
AND … reshoring this content to some of yesterday’s pregame for today’s NFP …
ZH: Jobless Claims Data Surges (And Falls) With Seasonal Hiring At Decade Lows
… Is it different this year? ...is a year-end firing spree lost in the seasonals?
This claims data was the beginning and the day continued and ended with consumer credit data…
CalculatedRISK: Fed's Flow of Funds: Household Net Worth Decreased $1.3 Trillion in Q3
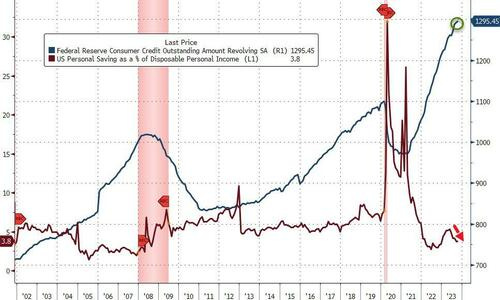
ZH: Consumer Credit Expansion Slowed Dramatically In October
… And with consumers increasingly reluctant to max out their credit cards due to record high rates, at a time when the personal savings rate in the US has collapsedback near multi-decade lows in recent months...
... it is now only a matter of time before US GDP prints deep negative now that that pillar supporting 70% of the US economy, consumer purchases, is about to crack.
Anyways … is it just ME or are bull steepeners once again THE trade for coming year. Feel as though we thought that this time LAST year and for the most part, were … well, let down.
2yy started OUT 2023 ~ 4.50% and you know what happened in March … 2yy traded up TO nearly 5.10% THEN SVB got broken and yields dropped TO nearly 3.50% and … well, here we are just about 4.50% with renewed hopes THIS is the year of the FED RATE CUTS inspired bull steepening!
… here is a snapshot OF USTs as of 706a:
… HEREis what this shop says be behind the price action overnight…
… WHILE YOU SLEPT Treasuries are moderately cheaper, led by the belly (2s5s10s +1bp), after a ‘relatively’ quieter Asia session that still included a 4bp selloff in 20y JGBs after the 10-25yr rinban op saw the lowest offer-cover ratio on record at 1.007. USDJPY is well-behaved here at +0.2%, a -1.4% fall in USDKRW the standout mover in FX overnight. APAC equities were led by the KOSPI (+1%), Japan’s NKY -1.7% the outlier, mainland China bourses slightly better bid (SHCMP +0.1%). Energy prices also moving higher, extending the late NY recovery, Crude + 1.6%, RBOB futures +2% and HG +0.4%. DAX futures are marginally higher (+0.1%) and SPX futures are showing -7pts here at 7am before NFP, where Citi Economics sees risks to above-consensus prints - 195k payrolls vs 183k Bloomberg median estimate and 175k “whisper”. UST volumes are running ~75% the 30d average.
… and for some MORE of the news you can use » The Morning Hark - 8 Dec 2023 and IGMs Press Picks (who CONTINUES to be sportin’ that new, fresh look) in effort to to help weed thru the noise (some of which can be found over here at Finviz).
Moving from some of the news to some of THE VIEWS you might be able to use… here’s SOME of what Global Wall St is sayin’ … ahead of NFP,
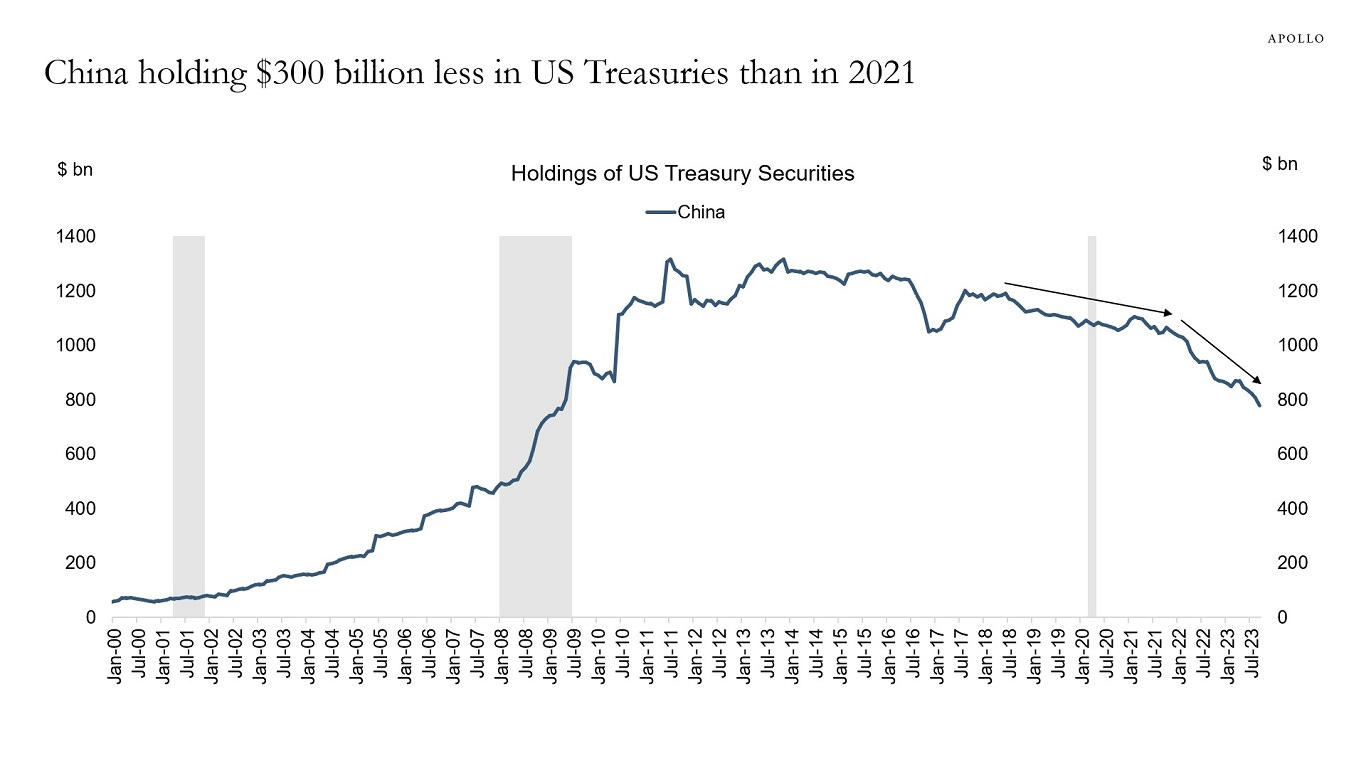
Apollo: China Outlook for 2024 (this on heels of news Moodys plans to downgrade OUTLOOK … all the cool kids getting OUTLOOK downgrades!!)
Since the Fed started raising rates, the biggest foreign buyer of US Treasury bonds has been the yield-sensitive private sector, see the first chart below.
But with rates peaking, the foreign private sector has been slowing purchases, see chart below.
The foreign official sector has been a net seller during this rate cycle. This is also the case for China, where holdings of US Treasuries have declined by $300 billion since 2021, see the second chart below.
With growth slowing in China due to demographic headwinds, slowing exports, and a deflating housing market, demand for US Treasuries from the foreign official sector will likely remain weak.
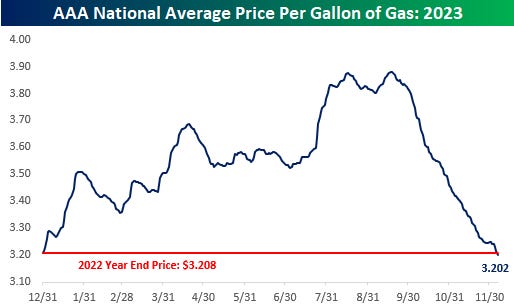
Bespoke: Prices at the Pump (hey, good news is good news and prices at pump leading to higher confidence (and higher bond prices, too?))
Bad Gas It's been a mixed start to the week for indices like the Nasdaq and Russell 2000, while the S&P 500 came into today on a three-day losing streak. US equity indices are slightly higher today, while overnight in Asia, stocks traded lower on reports that the BoJ is gearing up for rate hikes. That led to a spike in yields and the yen and a decline of over 1% in the Nikkei. In Europe, the declines haven't been as steep as GDP for the region declined 0.1% which was in line with forecasts, although Industrial Production in Germany unexpectedly declined.
Less than three months ago, the price of a gallon of gas in the US was pushing $3.90 and was up 21% on the year, and the price of crude oil was near $95 per barrel. Since then, crude oil prices have tumbled below $70 per barrel (as of yesterday’s close), and a gallon of gas is now $3.20, which is down 17.5% from its peak and down slightly on the year. Next week’s CPI report on Tuesday and the subsequent FOMC report should be interesting to say the least. In our view, we're likely to see a negative month-over-month print in November headline CPI, mostly due to the steep drop in gas prices.
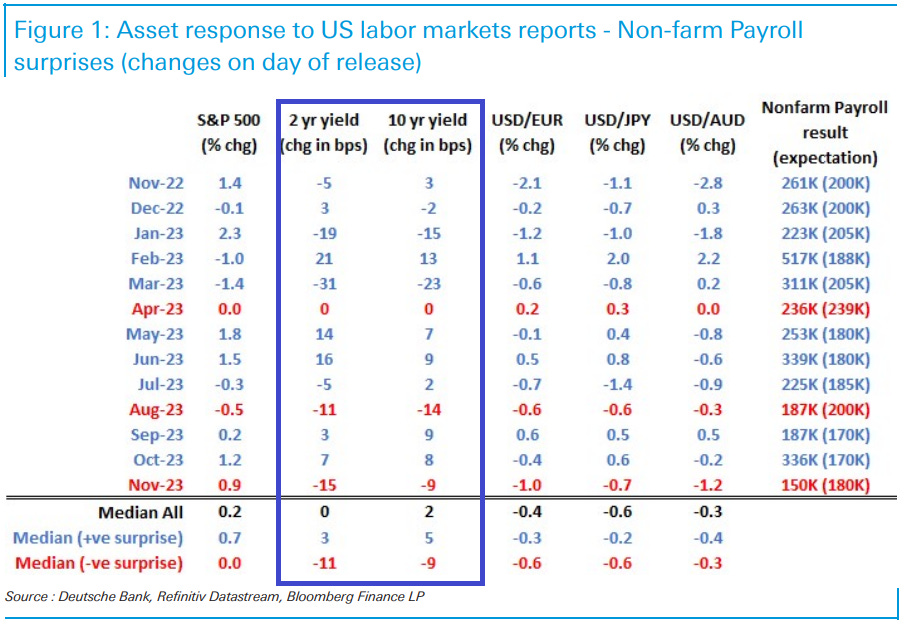
There should be no doubting the capacity for the November employment report to generate volatility.
Weak data will validate rate cut expectations, and although we already have 125bps of rate cuts priced for next year, the nadir in the expected funds cycle is still solidly above 3%, and can go lower if the data is weak enough.
Meanwhile, strong data will go completely against the grain of the gathering market consensus. At a minimum, strong data has the capacity to extend out the period of a plateau in rates, and seriously dent the 55bps of rate cuts priced for the middle of next year. This would also easily fit with FOMC messaging. After all, there is no incentive for the Fed to rush cuts if the economy and labor market remains resilient, and it frees them to concentrate on securing a 2% inflation rate on the forecast time frame.
As for the data itself, the familiar trilogy of NFP, average hourly earnings and the U3 rate will all be almost equally important. Normally, the U3 unemployment rate would not quite rank up with the other two components, but with the rate already 0.5% above the cycle low point, additional increases would point to stickiness in recent weak household employment, and would add to recession probabilities.
It is noteworthy that the median for the U3 rate is 3.9% but the expectations distribution is skewed towards 3.8% and some of the forecasters that rank best on past record are also skewed lower rather than higher.
This is notably different for average hourly earnings where the 0.3% median has a strong skew to 0.2% rather than 0.4%.
In short, 'the collective wisdom" of the markets points to bond bearish downside risks relative to the median for the U3 rate, and bond bullish downside risks to the average hourly earnings number…
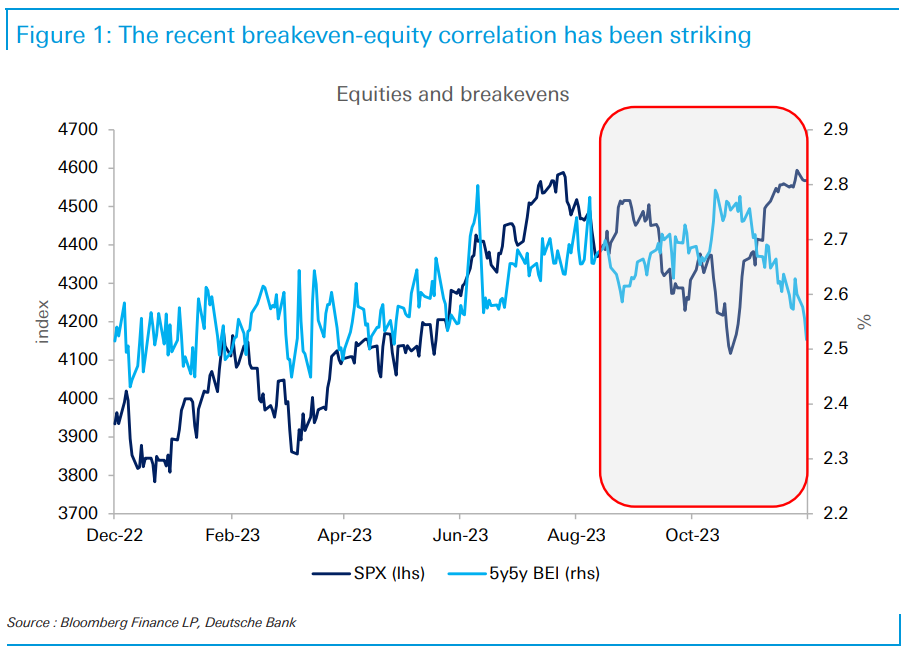
DB: Recent breakeven-equity correlations (or lack thereof … somehow this one lost me)
… The thing we find most striking, however, is the pronounced negative correlation between breakevens and equities that has emerged over the past three months, highlighted by the shaded region of the chart…
… One implication of a more negative breakeven-equity correlation is that breakevens become a more valuable hedge for market risk. All else equal, this should make them more attractive and boost inflation risk premia (IRP) embedded in breakevens and nominal yields. To the extent this has been operative of late, it would suggest IRP have risen and that the drop in 5y5y inflation expectations has actually been bigger than implied by a straight read of breakevens.
DBDaily: US2s10s inversion at 18mths: Feb recession "deadline"?
… Jim Reid with a chart showing that December marks the 18th month of a continuous US 2s10s inversion, the second longest stretch on record. Since the 1940s, an inverted 2s10s curve has signalled a US recession within 19 months 9 out of 10 times. Jim notes that if a US recession hasn’t arrived by February 2024 we will be outside that range.
Goldilocks: Initial Claims in Line with Expectations (ahead of NFP, not sure how important BUT … this one’s for all us muppets)
BOTTOM LINE: Initial claims were in line with expectations for a roughly unchanged reading. Continuing claims fell below expectations, though we suspect part of the decline reflects seasonal adjustment difficulties related to the Thanksgiving holiday…
… We believe that persistent seasonal distortions more than explain the 203k increase in continuing claims since early September, and expect those distortions to boost the level of continuing claims by an additional 125k by March.
Goldilocks: Global Market Views: A Bit Too Much “Adjustment” (this is what happens … no matter WHEN you right and release an update, markets pendulum swings IMMEDIATELY to / against a view and then you gotta come up with ‘clarifications’ (?) like this?)
1. Overshooting along a benign path. The central feature of our macro and markets outlook released in early November is that the high inflation constraint of the past couple of years will continue to loosen against a relatively benign activity backdrop. The data flow since then has been strongly supportive, with downside inflation surprises globally and slower but firm US growth. With the market more squarely embracing that narrative, we have seen a powerful rally in core rates, a further compression in already tight credit spreads and equities back towards the highs of the year. On the markets side, we have flagged two important challenges to translating our benign macro view into a sustained positive outlook for markets. The first was valuation, given that market pricing was already closer to our more benign view than to consensus; the second was that, given our more optimistic view on US growth, the Fed could be slow to cut rates. Both challenges are in focus again, making the market more vulnerable to setbacks. Markets have quickly moved further towards pricing our more benign view, and while we anticipated that a weak version of the “Fed put” could support markets, that support was conditional on growth weakness, which is not yet apparent. These are not reasons to switch to a cautious view or to be short, but they argue for using current levels of low equity volatility to add hedges that allow investors to stay long or add risk on pullbacks. We would now lean against US rate pricing, especially at the front end of the curve where the market has begun to move from pricing “adjustment cuts”’ towards pricing “recession cuts” that we think are unlikely to be the modal scenario. We would also lean against Dollar weakness given the global breadth of the ongoing disinflation and a less resilient activity picture in Europe and China, and the greater plausibility of earlier ECB rate cuts…
… 3. Rates market leaning into “adjustment” cuts and then some more…
… 4. More vulnerability to a reversal. We have been more hesitant to push back on the increased expectations of Fed easing than earlier in the year. As the prospect of further hikes becomes increasingly unlikely, it is natural that the discussion shifts towards the timing, magnitude (and pricing) of easing. With the inflation constraint easing, we also expect the Fed to be responsive to any softening in growth. That makes it easy to see how the Fed could cut sooner than our central forecast of late 2024. That backdrop makes it risky to push too quickly against the timing and extent of an easing cycle that we agree is coming, and is why we have had a more favorable view of the value of duration in the last two months. But with a deeper discount to our views, and some potential challenges from upcoming information, we think the extent of Fed cuts priced now looks vulnerable. The easing in financial conditions since November has mostly unwound the tightening from September and October, and is probably not yet at levels that will worry the Fed. It is likely also too early for the rally in some of the more speculative areas of the market—bitcoin, “meme” stocks—to catch policymakers’ eyes yet. Instead, we think the data is probably the biggest risk right now: strong payrolls and a lower unemployment rate this Friday (December 8), which we expect, and the potential for a higher print on inflation next week. If next week’s FOMC dots show two cuts or more for 2024, that could keep the door open for more active speculation about an early easing, particularly if Chair Powell pushes back less forcefully in the press conference. But with the market pricing more aggressive easing profiles, the balance of risks around the meeting is shifting too. We have generally put a lower weight on bond supply fears than others, but as the issuance calendar picks up again the pricing of back-end rates may also need to be higher. Still, it is front-end rates that are more clearly out of line with our view, and our Rates team has recommended selling calls on SFRM4.
Payrolls day is usually pivotal. This one more than most, as the US 10yr has fallen sharply from 5% down towards 4% without material evidence of any labour market recession. We don't have to have one, of course, as lower yields can also be validated by lower inflation expectations. But in the end, it probably does have to happen, or else bonds have issues ...
ING: 2024 set to be the year that the hike cycle is felt (thinkin’ ECB)
LPL: Overbought Conditions Meet Overhead Resistance (love me some techAmentals … here are key takes AND a chart from someone far cooler than I who still HAS a BBG!)
Key Takeaways:
An impressive November rally left the S&P 500 overbought and hanging just below key resistance at 4,600.
Cyclical sectors have led the charge higher and are the most overbought. LPL Research views this as a constructive sign for a healthy and sustainable bull market recovery.
While overbought does not mean over, the degree of overbought conditions reached this month is historically rare, and based on forward returns from comparable periods, stocks could be subject to underwhelming short-term performance but impressive longer-term gains.
MS: FOMC Preview: December Meeting (too soon? we didn’t even get beyond NFP … i guess this is stratEgerism job security … say something BEFORE NFP then have to fix whatever is wrong with what you said AFTER NFP?)
We expect the Fed to hold the policy rate at 5.375% and to cautiously shift communication from how high to how long. We continue to see it remaining on extended hold until its first cut in June 2024. Our strategists stay long UST 10y and long SFRZ4 on SFRU3Z4Z5 fly.
The recent SOFR spike reflects balance sheet constraints, driven by month-end and large net UST settlements. Although we expect tighter funding conditions next year, market expectations for funding already pass 2019 levels and the potential for a more moderate RRP decline in the near term lead us to exit short 2y SOFR swap spreads.
… MMFs have also seen significant inflows over the past week, with YTD inflows reaching $1.1tn (Exhibit 15). The pace of growth in AUM remains the highest since March (Exhibit 16). Further inflows into MMFs reflects more cash in the front end, limiting how much the RRP can decline further as demand for repo moderates intra-month.
US employment report Friday means it is time for the monthly reminder that average hourly earnings are not wages, and are definitely not wage costs. If wages are stable and the number of low-paid workers in the economy increases, average earnings fall. At a time of structural upheaval, the composition of the workforce is likely to change. The distinction is important because (real) wages matter to consumer spending power, and wage costs matter to profit margins and potentially inflation.
Today’s data is not really accurate. The UK’s Office for National Statistics has already admitted its labor force survey is not trustworthy. The US Bureau of Labor Statistics only admits to quality problems when asking Congress for more money to correct the problems. Federal Reserve Chair Powell’s big policy error was to stress data dependency when data is less dependable, which means markets react to the numbers.
US Michigan consumer sentiment data continues to exhibit extreme partisan bias. The inflation expectations will continue to be determined by food and fuel prices…
Initial claims settle in; continuing claims unwind some seasonality … Note these data are in line with our expectations for tomorrow's employment report where we project a stronger-than-consensus expects report. The median of the current posts on Bloomberg sits at 186K. We project a 220K increase in nonfarm payroll employment in November, and that the unemployment rate declines. For details on our projection see page 16 of the US Economics Weekly.
Layoff announcements rise in November, not hiring announcements …
Yardeni: Another Bowl Of Mixed Nuts (small dose of tech A mentalism from the good — if inconclusive today — doctor!)
The S&P 500 is consolidating its gains since the October 27 bottom. In recent days, its been trading between 4550 and 4600 (chart). Investors are trying to ascertain which way the economy is headed in 2024. We remain in the soft landing camp. Today's data continued to show that consumers have jobs. However, the latest reading on consumer credit borrowing was weak. Consider the following:
… (2) Consumer Credit. Retail sales edged down 0.1% during October. So it wasn't surprising to see a small increase in revolving credit in today's consumer credit report for the month. It was up just $2.9 billion (chart). Now that credit card interest rates are so high, more consumers are opting to pay their credit card balances on time.
… And from Global Wall Street inbox TO the WWW,
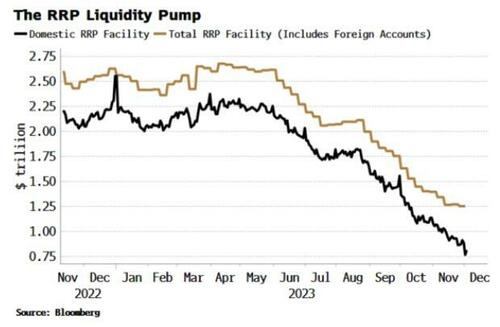
Bloomberg: End Of Fed Liquidity Pump Spells Trouble For Markets
… Everyone’s a plumber, or at least should be.
Not in the sense that we all need to get handy with a spanner, but in that every investor should have at least a basic knowledge of financial plumbing in the modern central-banking regime.
A good place to start is the Fed’s RRP facility.
It reached a peak of over $2.5 trillion in May this year. That’s a lot of cash to have hidden down the sofa. But it is now falling at a steady rate, down more than half from its peak. What happens when it goes to zero is a key question for markets and plumbers alike.
The RRP has been a veritable liquidity pump this year, acting as a source of stability for markets. Money that would otherwise have been taken out of the system as the Treasury funded its largest peacetime, non-recession deficit was returned immediately and identically as money market funds (MMFs) drew down on the vast RRP.
Normally, when the Treasury is borrowing that much money - over $2 trillion on an annual basis - it absorbs liquidity from the system as the bonds are bought mainly using bank deposits.
The liquidity eventually comes back into the system (the government borrows the money to spend it after all), but it is less “high-powered” and therefore not as beneficial for assets.
In sum, the RRP meant that what would have otherwise been very unfriendly conditions for stocks were instead supportive…
… Key things to keep an eye on are re-increases in the RRP, indicating extra reserves are being taken back out of the system, or a rising take-up in the Fed’s standing repo facility, which would point to potential funding problems.
All said and done, don’t put your spanner away yet, knowing how to plumb remains an essential skill.
Bloomberg: BofA’s Hartnett Says Rising Bonds Will Drag on Stocks Early 2024 (speaking of liquidity troubles, enter BAMLS Hartnett…who shows how muted Dec is, so far … ?)
Further pullback in yields to signal hard landing, BofA says
Sees sentiment no longer a contrarian boost to risk assets
Stock markets will suffer in the first quarter of 2024 as a rally in bonds would signal sputtering economic growth, according to Bank of America Corp.’s Michael Hartnett.
The strategist — who has remained bearish even as the S&P 500 rallied about 19% this year — said lower yields were one of the main catalysts of equity gains in the current quarter. However, a further drop toward 3% would mean a “hard landing” for the economy.
The narrative of “lower yields = higher stocks” would flip to “lower yields = lower stocks,” Hartnett wrote in a note dated Dec. 7.
A rally in US stocks has just about stalled this month after one of the best November gains in a century, as investors consider when the Federal Reserve is likely to start cutting interest rates. The US 10-year bond yield has retreated to about 4.2% after hitting 5% in late October, the highest since 2007.
The next clue on the rates outlook is likely to come Friday from US jobs data, with Bloomberg Economics expecting it to show that the unemployment rate edged higher in November as the economy began to slip into a recession. Hartnett said that if payrolls were to rise by less than 100,000, that would be another signal of a hard landing….
Bloomberg: Is the Bank of Japan ready to kill the widowmaker? (Authers OpED talking about THE widowmaker … aka being SHORT JGBs)
De-Japanification
Will the widowmaker claim any more victims? For three decades, the trade of shorting Japanese bonds in a bet that yields will rise has fully earned that nickname. Repeatedly, it seems that Japan’s rates cannot stay on the floor any longer — but they still find a way to drop even lower. Rock-bottom yields have been one of the most stubborn symptoms of “Japanification,” the country’s protracted slump.
Now, the Bank of Japan has unleashed another wave of speculation that de-Japanification is starting in earnest. They at least appear to be hinting that there will soon be tightening both in the very shortest overnight rates and in 10-year bonds. The 10-year yield hasn’t even been as high as 1% since 2012, when the return to office of the late premier Shinzo Abe started the policy of Abenomics, a program designed to weaken the yen, keep rates low, and jolt the economy out of its slump. Meanwhile, the BOJ’s target overnight rate hasn’t been positive since 2016, which was the year when spillovers from the currency crisis in China prompted the adoption of the radical policy of yield-curve control (YCC) — intervening to keep 10-year yields capped at zero. Amazingly, these two rates have on several occasions managed to invert in negative space, meaning borrowing over 10 years was even cheaper than over one day.
Perhaps no single chart sums up the enduring phenomenon of Japanification better than this one:
An extended and cautious retreat is now underway. Long-serving governor Haruhiko Kuroda widened YCC to allow 10-year yields as high as 0.5% at the end of last year. His successor, Kazuo Ueda, then stretched that level to 1% in late July, sparking global ructions. But the BOJ’s last meeting was more of a damp squib. Big developments were trailed in a leak to the press, but the meeting ended with only a rather technical adjustment so that 1% would be the “reference point” rather than the target. Foreign-exchange analysts debated how important this was, but bond investors seemed certain it didn’t matter much. JGB yields fell afterward. Through it all, the overnight rate has remained negative:
The latest burst of activity followed comments from Ueda that capping bond yields would become “even more challenging from the year-end and heading into next year.” Perhaps more surprisingly, Deputy Governor Ryozo Himino said households might actually benefit from higher interest rates, and that harm to companies would likely be limited. That suggests the BOJ is hoping to raise overnight rates swiftly after it lifts YCC.
This helped prod 10-year JGB yields higher (although they remain lower than during the speculation ahead of the last meeting)…
Bloomberg The Weekly Fix: Rate cuts are so close you can almost taste them (with some context of the MOVE in JGBs)
… Another Tokyo Surprise? Japan’s markets are facing a different set of concerns, as the central bank’s massive easing starts to look harder and harder to sustain. BOJ Governor Kazuo Ueda and his deputy both signaled the door might be opening a notch or two to the idea of a policy shift. That had traders rushing to treat this month’s BOJ meeting as a “live” gathering, where actual policy changes might come.
The yen soared as bets exploded that the world’s last remaining negative-rate regime will soon end — though the more considered consensus seems to be that won’t happen until April. Ueda’s comments were accompanied by the steepest sell-off in Japanese bonds since Dec. 20, 2022 — back when then-BOJ Governor Haruhiko Kuroda stunned markets by widening the trading band for 10-year yields…
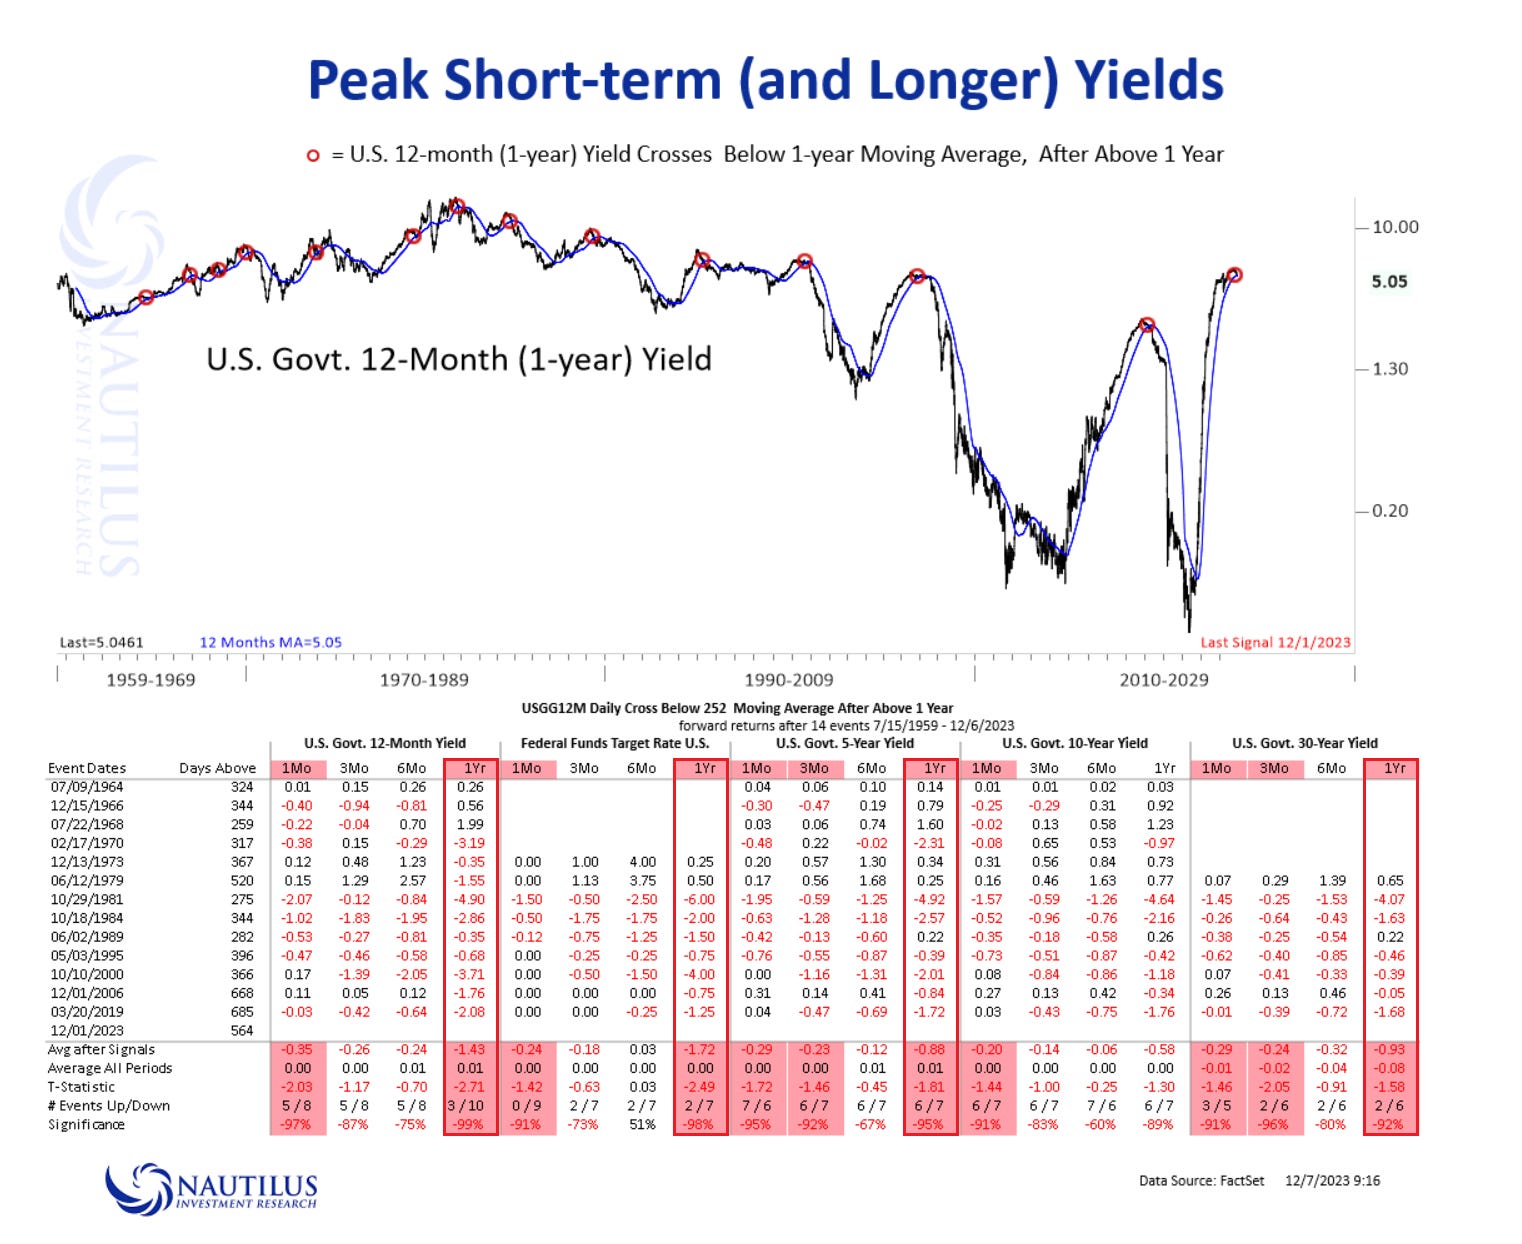
Nautilus Research: Peak Short-term U.S. Yields (another great chart / DATA points to consider … esp for one and ALL who seem to be in Camp BULL STEEPENER)
U.S. 12-month (1-year) Yields Cross Below Their 12-month Moving Average.
Shorter-term United States Treasury yields have just closed below their 1-year moving average. In particular, U.S. 12-month yields (1-year) have just crossed below this average after being consistently above it for more than a year (252 trading days).
Historical patterns suggest that when such signals have occurred in the past, dating as far back as the early 1960s, they have often indicated the establishment of a peak in yields. Subsequent returns following these signals have typically averaged further declines ranging from -143 basis points to -93 basis points, depending on the tenure - see table below.
NORDEA Macro & Markets: Does the US need rate cuts in March (one of many correct questions i suppose…)
The market has read very much into the moderation of economic data the past month. We struggle to see the case for the Fed to cut rates in March…
… Tomorrow bring another Payrolls print. Let's see. And next week we get both fresh CPI-readnings and the last FOMC meeting of the year. We expect their new economic projections to revise the outlook for inflation lower, but higher for GDP. They will remove the additional rate hike, and still call for 50bps of cuts next year. Far less than the 125bp the market is calling for. If it will be a big enough wake-up call for the market is still unknown. This is at least the 6th time the market is pricing near-term rate cuts in this cycle, we are not sure they have gotten it right this time either.
Chart 4: Will these rate cuts materlize? Or is the market wrong again.
at RENMACLLC (hmmm bonds overBOUGHT — or sold from someone who, maybe, never traded them and only looks at them as a stock? perhaps the firm can program it’s oscillating machines to talk BONDS and directions correctly? nevermind, any time dutta talks, folks love him as he sounds so CONvincing and smooth … so be it and NOT taking any issue with THE MESSAGE here and its a bond BEARISH one … whatever, you get the point)
Yields have contracted almost 100bps since the +5% overbought peak in October. They are now oversold (green arrow) and still in a well-defined uptrend. $SPX "easy money" for this tactical move is likely behind us.
StockCharts.com: Santa Claus Rally Alert: Predicting a 70% Chance of Surge in the Dow Jones This December! (70% chance of anything happening should make one pause and consider a draftkings.com wager?)
KEYTAKEAWAYS
December has seen the Dow Jones Industrial Average rally 7 out of 10 times in December since 1896.
DIA is seeing support at its former resistance level of $352.
DIA has pulled back from "overbought" highs, which looks favorable for market engagement.
… The Bottom Line Considering the historical 70% likelihood of a December rally in the Dow Jones Industrial Average and DIA's current pullback from its "overbought" highs, investors might see this as a favorable trigger for market engagement. Just remember that seasonal tendencies are never guaranteed, so keep an eye on technical and fundamental developments before attempting to jump into this anticipated (and always welcome) holiday rally.
ZH: BOJ Shocks With Hints Of Imminent Rate Hike, Traditionally A Signal Of Imminent Financial Crisis (important — in my humble UNPROFESSIONAL view —=to NOT lose sight of this esp with NFP coming…)
… Bottom line: while we don't think a rate hike by the BOJ is imminent - and may never even happen, the central bank is best known for its jawboning not so much for its actions - should Ueda indeed proceed to hike rates, and thus start the countdown to the next crisis, it would tie in perfectly with our recent report that the "Sudden Spike In SOFR Hints At Mounting Reserve Shortage, Early Restart Of QE", because there will be no better catalyst for the Fed to restart QE than having one of its central bank peers throw the world into a fresh round of chaos.
Finally while not the 7th night but going to be the 2nd night,
Pump Prices?!? As a CA resident don't get me started bro :(! In 2007 when Earl hit the still-standing (wtf ?!? Does give some credence to the Dolla Milkshake theory?!) $147, gas was like $4.50 a gal here. Now it's still over $4 in NorCal at current oil prices. But then we pay an extra buck per gal for climate Change 'fees' they dare not call them TAXES LOL!


Pump Prices?!? As a CA resident don't get me started bro :(! In 2007 when Earl hit the still-standing (wtf ?!? Does give some credence to the Dolla Milkshake theory?!) $147, gas was like $4.50 a gal here. Now it's still over $4 in NorCal at current oil prices. But then we pay an extra buck per gal for climate Change 'fees' they dare not call them TAXES LOL!