Good morning … Yesterday we had a well rec’d 3yr auction …
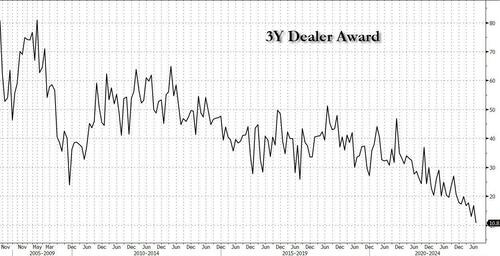
ZH: Stellar 3Y Auction Stops Through With Lowest Dealer Award On Record
… The internals were also solid, with Indirects awarded 69.4%, up from 61.5% in June, and not just well above the recent average of 64.5% but just shy of the all time high. And with Directs awarded 19.8%, below last month's 21.7% but above the 6-auction average of 18.6%, that left Dealers holding on to 10.8%, which was the lowest on record.
Overall, this was another stellar Treasury auction, and positions the market nicely for tomorrow's benchmark sale of 10Y paper just as yields trade back below 4.0%.
… and on THAT note (and with a fresh set of crayon’d fat TLINES redrawn), #Got10s?
I’m certain it’s just a coincidence … the green arrows show a top (top half) just as momentum indicator (stochastics, bottom half) on 10yy hit overSOLD territory, held and CROSSED suggesting path of least resistance is … lower. OR SIDEWAYS. That is ALWAYS an option, too, and with this mornings CPI setting the table for this afternoons liquidity event (aka AUCTION), well, you have the freedom of choice and choosing to do NOTHING … stand aside and let the dust settle … is ALWAYS a choice.
Meanwhile … here is a snapshot OF USTs as of 716a:
… HEREis what this shop says be behind the price action overnight…
… WHILE YOU SLEPT Treasuries are modestly higher again this morning with the belly leading rates lower again ahead of CPI. DXY is lower (-0.22%) while front WTI futures are little changed. Asian stocks were mixed, EU and UK share markets are all in the green (SX5E +0.85%, FTSE 100 +1.18%) while ES futures are showing +0.15% here at 7am. Our overnight US rates flows saw intermediates lead Treasuries higher during Asian hours after USDJPY fell below 140 for the first time in a month. Our Asian desk flows were limited with front-end real$ buying noted. Flows were quiet during London's AM hours too with modest belly buying/squaring mentioned by colleagues there. Overnight Treasury volume was ~65% of average.
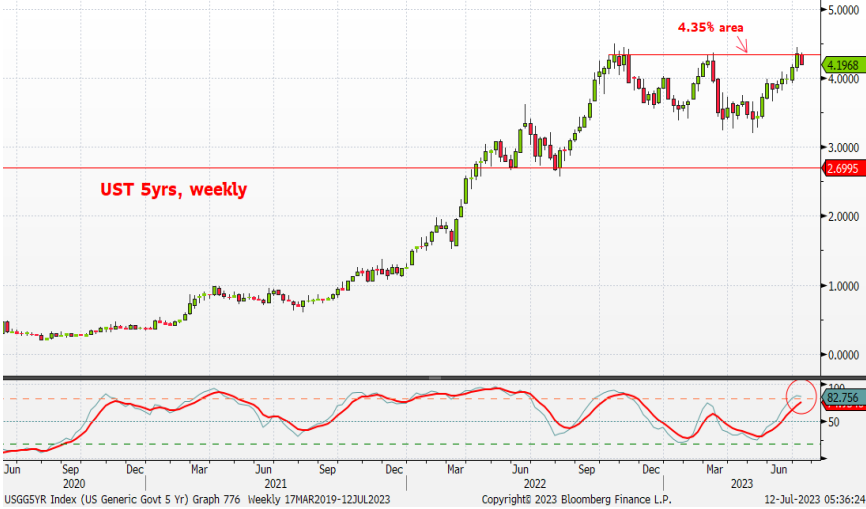
… 5yr Tsy yields, weekly. Here we can pretty clearly see how 5yr yields have found a 'barrier of demand' near 4.35% since 5yr yields have failed to close a week above this support- despite numerous intra-week ventures above the level in recent months. Weekly momentum (lower panel, circled) still shows a mild bearish bias though the oscillator lines are beginning to merge (suggestive of more balanced, medium-term flows after the 2-month sell-off) near 'oversold' levels. This daily-weekly combo for 5's pretty well matches up with yesterday's observations from Citi's RPM publication that local (1mo) shorts are getting squeezed while deep-in-the-money, medium-term (3mo) shorts are not that stressed yet. Taken together, these two charts hint of a local bullish bias but one that may not be sustainable beyond a few days barring a notable change in data (like a low 0.2% core CPI print). Other words, the jury's still out on the notion that the move highs seen last week are THE highs for the latest leg to higher yields... We hope to know more by this afternoon!
… and for some MORE of the news you can use » IGMs Press Picks for today (12 July) to help weed thru the noise (some of which can be found over here at Finviz).
From some of the news to some of THE VIEWS you might be able to use… here’s what Global Wall St is sayin’ … Ahead of today’s CPI I’m hard pressed to pay too much mind to any of this (even less so than normal) as we all know how quickly the narratives can and will change. That said, before the ink dries, lets jump right in.
Today’s US consumer price inflation report for June stands as a monument to Federal Reserve Chair Powell’s policy errors. No single statistic should matter so much to markets. Coherent central bank communication should leave investors interested in consumer price inflation—but as part of a survey of trends across a wide range of indicators. Obsessing over a single statistic is wrong, and a result of Powell’s policy approach.
Two important points from today’s data: Middle income consumers experience significantly lower inflation than the headline rate because homeowners are not paying the fictional owners’ equivalent rent. This means better spending power. In addition, swathes of the country have seen headline and core inflation fall significantly—core inflation is below 3% in places like Los Angeles. This challenges the idea that there is a structural stickiness to headline or core inflation…
While anything spoken with his accent (you can hear it in his words) SEEMS so convincing AND I cannot argue with factual points he’s making I must pause and ask about the experience of middle income folks here in ‘Merica … if ones WAGE is growing (?) far less than rate of ‘flation (whether ‘flations falling or simply growing less slowly), how is it HE knows the 'experience’?
I’ll tell you … as we ALL know there is ‘in theory’ and there’s ‘IN PRACTICE’. Guys like Paul live up in the Ivory Tower of THEORY and while not incorrect on paper, well, best I get back off my soapbox here and just ask — perhaps he come here and live day to day with ‘middle income consumers’ paycheck and lets then talk about it from down on the ground rather than from behind safety of his pen and paper (fancy Mac laptop) while he’s working at home from his barn, sparing a couple hours a day to write and think … making far more than ‘middle income’ ‘Merica.
For H2 of 2023, our thematic framework presents five ideas that we believe are currently underestimated by the market. Inside we discuss the macro trends and rationale behind these ideas and how they are influenced by the various themes that are driving the world’s markets and economies…
…H2 will be a period that should answer some of the biggest questions on investors’ minds: Will there be a US recession? Will the Fed pivot? Will Europe have enough natural gas? Will China’s economy recover? Regardless of the answers to these questions, we can still assess whether the medium-term trends are pointing to positive or negative outlooks for various assets.
Top ideas for H2: 1. Long short-term US treasuries, softer dollar 2. Avoid credit-exposed assets or over-levered stocks 3. Energy price recovery 4. Avoid stocks with strong labour exposure 5. Long China
… After a volatile H1, US fixed income may be poised for a comeback in H2. Furthermore, the trends that support this may also soften the dollar. If so, there are wide-ranging implications for many investor portfolios in the US, Europe, and emerging markets.
There are two key factors behind our outlook for stronger bonds and a weaker dollar in H2. First, the US monetary policy cycle is ahead of other major markets and, second, a tougher-than-expected growth outlook may force the Fed to tilt its priorities from inflation to growth.
Short-dated treasuries are likely to be the key beneficiary of this trend. If so, this will likely steepen the yield curve and benefit assets sensitive to short-term rates. This will also push down cash yields, marking a big change for investors who spent last year adjusting their portfolios for just the opposite effect. As a result, they may have to perform another significant rebalancing act across asset classes.
The key driver of stronger fixed income and a lower dollar was on display in H1: namely that the Fed is well ahead of other major central banks in the rate cycle. Inflation in the US is falling steadily whilst, in Europe, core inflation is proving a problem while natural gas prices have rebounded 31% from their June lows and we expect further upwards pressure in H2.
Thus, yields may come off in the US more than elsewhere. The resulting yield differential with other major markets will likely be bearish for the dollar. We see both the euro and the yen strengthening against the greenback, with EURUSD going from 1.10 to 1.15 and USDJPY from 143 to 120 by Q4 of this year. The resulting downwards pressure on the dollar is likely to be positive for emerging market assets.
The secondary driver of the trend for treasuries and the dollar is the growth backdrop. We believe this will deteriorate and push the US into a recession by the end of 2023…
…To be clear, we do not see a complete slump in yields at the long end of the curve. Mainly, that is because the evidence indicates that inflation will not return to very low levels in the near future. At the same time, the absence of quantitative easing will also likely help restore the suppressed term premium.
AND interrupting normal flow of info for a moment to bring an updated GLOBAL central banking call,
DB: BoE Change of View – wage growth still too hot, 50bps in August
Today’s labour market data will add to the MPC’s worries of persistent wage pressures. With wage growth (AWE Reg Pay, 3m/YoY) running at 7.3%, and private sector pay growth still looking very strong (7.7%, 3m/YoY), we remain some way away from rates consistent with the Bank's medium-term mandate. That said, there are positive signs brewing in the labour market. Inactivity is continuing to fall. Participation is still rising. The jobless rate is running a little higher than the MPC anticipated back in May. And we’re seeing more survey data point to some downside in wage growth and inflation over the coming months.
For now, evidence of still more persistent wage pressures will keep the MPC's foot on the accelerator. A second consecutive 50bps hike now looks more likely than not. Accordingly, we change our call for August, and now expect a 50bps hike at the next BoE meeting, taking Bank Rate to 5.5%. We keep our terminal rate projection fixed at 5.75%, however, and see the MPC delivering at least one further quarter point hike in September. Risks to our terminal rate projection are tilted firmly to the upside. We will reassess our view following the release of both the Financial Stability Report and the June CPI print.
This in mind, another note from same shop (different stratEgerist) offering,
Hawkish central bank surprises from G10 central banks have returned over the past six weeks, following a calmer six month period when rate decisions were all delivered in line with consensus expectations. Recently, we've seen central banks hike when pauses were expected by a majority of economists (RBA, BoC), and deliver 50bp hikes when smaller ones were forecast (Norges, BoE) (Figure 1).
Finally, for us visual learners (and our inner techAmentalists),
… 10yr US Bond Yields above 4.085% should reexpose long-term support at 4.27/4.40%
US 10yr Bond Yields have as yet been unable to break key support from their 4.085% YTD high from March, but we look for resistance at 3.89/79% to ideally hold the current pullback for a clear break in due course for a move back to test long-term support in the 4.27/4.40% zone – the high of 2022, the 78.6% retracement of the 2007/2020 fall in yields and the “neckline” to the 2006/2007 yield top. Our bias would be to look for a fresh peak in yields here. Should weakness directly extend though, we would see support next at 4.50%, ahead of 4.72%.
Back below 3.79% would suggest the market remains in a broader sideways range still to clear the way for a fall to test the 55- and 200-day averages and price resistance at 3.70/675%. Suspect we need to see a move back below here to warn of a better yield top and a more bullish tone again.