(USTs mixed/steeper on light volumes) while WE slept; foreign private investors BOUGHT. AGAIN (14mo in a row)
Good morning … late yesterday afternoon we learned what foreigners did back in DECEMBER,
ZH: Foreigners BTFD In US Equities In December As TIC Flows Show China's 'Official' Treasury Dump Continues
It appears that foreigners bought the f**king dip in December as US equities tumbled, foreign official institutions bought $1.5Bn, Private foreigners bought $53.5Bn. That is the biggest buying since Dec 2020...
Foreigners, in aggregate, also bought US Treasuries for the 8th straight month, though at a considerably slower pace...
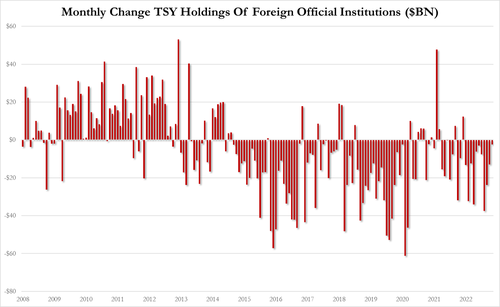
...yet curiously, foreign official institutions (central banks, wealth funds, reserve managers), have sold Treasuries for 14 straight months...
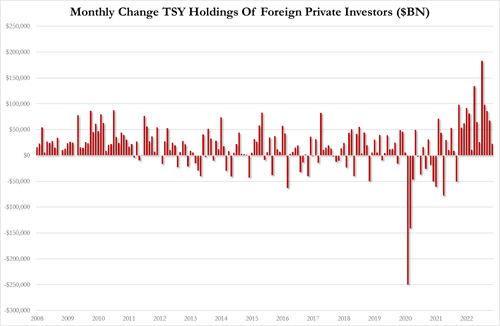
...while foreign private investors bought Treasuries for 14 straight months...
And more … China SOLD AGAIN (but Belgium — a proxy — holdings ROSE), and I’ll move on… here is a snapshot OF USTs as of 706a:
… HERE is what another shop says be behind the price action overnight…
… WHILE YOU SLEPT
Treasuries are mixed with the curve pivoting steeper (2s30s +6.2bp) around a little changed 20yr point this morning. DXY is modestly lower (-0.2%) while front WTI futures are modestly higher (+0.25%). Asian stocks were mostly higher, EU and UK share markets are mostly in the green (SX5E +0.6%) while ES futures are showing -0.1% here at 6:45am. Our overnight US rates flows saw a bid emerge during Asian hours, a respite from recent opening downgrades there. Today's uptick was fueled by the Aussie jobs miss (link above) with a block buy of 2k FV's noted as keeping prices buoyant into the London crossover. Overnight Treasury volume was roughly 75% of average with futures seeing higher relative average turnover versus cash overnight.… we show in today's first attachment of Treasury 2yrs how deeply 'oversold' 2's have become with daily momentum rising to 'oversold' levels last seen after September's grinding sell-off- before a brief correction then. So it was no surprise when the desk alerted us to the increasing tightness in 2yr repo where, at mid-day yesterday, 2's were trading ~135bp through GC to the date (Feb 28th). So the question becomes, "Was that it for the sell-off?" Well, we don't think so even if our work hints that front end rates need a breather that balances out positioning over the coming days. The more enduring problem seems to be that medium-term momentum, which tends to guide for multi-month moves, suggests that the next leg of the selloff in front end rates may be just in the earliest innings still.
… and for some MORE of the news you can use » IGMs Press Picks for today (16 FEB— and STILL SPORTING THAT NEW LOOK!!) to help weed thru the noise (some of which can be found over here at Finviz).
From some NEWS to some VIEWS you might be able to USE. Global Wall St SAYS …
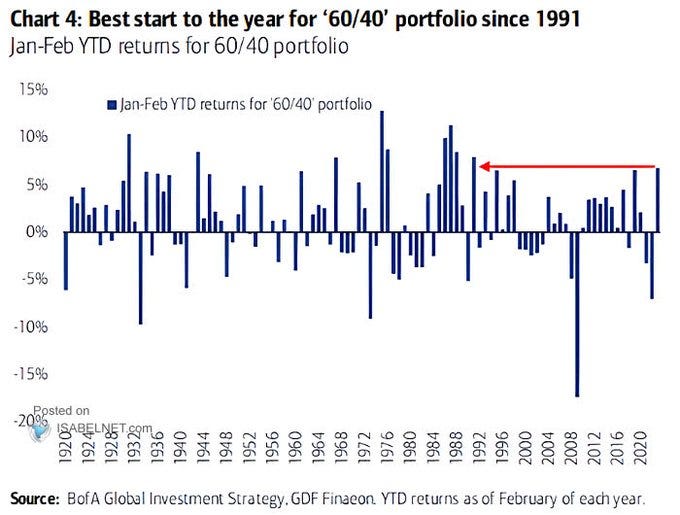
There seems to be a bit of ‘love’ in the air on heels of Valentines Day … ‘love’ of bonds, and why NOT when you’ll find that bonds (the “40” of the dreaded / DEAD 60/40) have helped 60/40 off to best start since 1991 (via TWITTER)
And so without further adieu,
TD: Legging Into Long 10y Treasuries
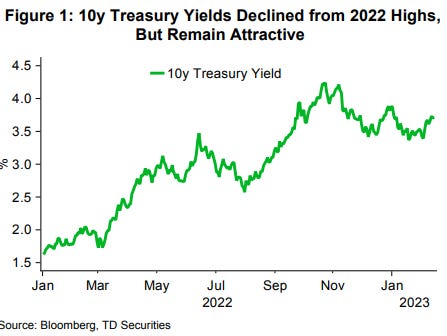
10y Treasury yields have risen by 34bp in just the past two weeks amid stronger economic data as the payroll report showed labor market strength and CPI reflects sticky inflation (LHS Fig)….… The big risks to the trade are a very strong retail sales report and BOJ ending YCC imminently, so we initiate only half the risk.
TD is not alone in making note,
BAML: Bonds near the buy zone: 3.75%-4% 10y
Rising 1y, 2y breakevens = emerging risk-off trigger
It’s too early to say whether the economy is reaccelerating. But the strong January jobs report and rising breakeven inflation rates (1y, 2y BE up 110, 80 bps to 2.8% area in last month) suggest the market is increasingly leaning in that direction – and discounting the benign disinflation narrative. More data likely will be needed to resolve the debate. If reacceleration is indeed the case, another round of Fed hawkishness – more rate hikes and/or higher for even longer – becomes more likely. We see this as one of two possible triggers of an anticipated H1 23 risk-off episode. A too hard to predict geopolitical event is another possible trigger.… Recommendation: down in credit floaters + 30y UST.
We continue to like down in credit high yield floaters in sectors such as leveraged loans, which yield 9%, paired with high quality long duration bonds such as 30y UST, which yield 3.8%…: yield declines in long duration treasuries (or investment grade corporates or municipal bonds) should at least partially offset spread widening. Among quality bonds, 30y UST would be expected to deliver the highest total returns in the more adverse economic scenarios … The 20% allocation to 30y UST has been seen to reduce drawdowns in the context of loan weakness in late 2018 and early 2020. We view any near-term backup in interest rates as a good opportunity to add high quality duration exposure.
As far as WHY one might like bonds, well, it’s NOT due to INCREASING chances of recession (evidence, NFP, CPI, or ReSale Tales) … to whit, Goldilocks
February Recession Watch Tracker: Continued Strength in the Labor Market
Recession odds: We have cut our subjective probability that the US economy will enter a recession in the next 12 months from 35% to 25% (vs. 65% consensus), reflecting continued strength in the labor market and early signs of improvement in the business surveys…… Yield curve: Over the last month, the number of hikes priced by the bond market for 2023Q2 increased and the number of cuts priced for 2023H2 decreased significantly, likely reflecting a lower perceived probability of recession by market participants. The bond market is currently pricing hikes through 2023Q2 and 15bp of cuts in 2023H2 (vs. 46bp in mid-January), 84bp of cuts in 2024H1 (vs. 99bp), and 66bp of cuts in 2024H2 (vs. 56bp).
On that YIELD CURVE related note, WisdomTree (and former MS strategerist)
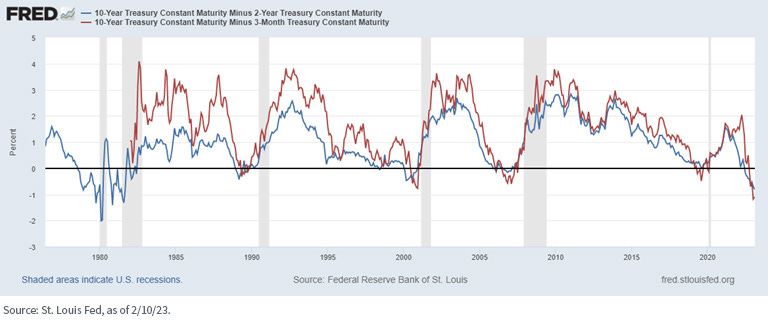
Inverted Yield Curves Reach New Heights…or Is it Lows
… So, why is this historical inversion of importance? In the past, as the graph clearly illustrates, when the two spreads have moved into negative territory, it was a precursor to a recession. While the time lapse between these yield curves going into the minus column and an economic contraction actually taking place varied, the end result was unmistakably the same: a recession.
U.S. Treasury Yield Curves
In prior blog posts on the topic at hand, I readily acknowledged the past relationship between inversions and recessions, but opined that, going forward, some nuances could render future predictability a little less straightforward. Specifically, the role of quantitative easing (QE) stood out front and center. In prior episodes, the Treasury (UST) market was not under the spell of the Fed’s QE program. The jury is still out on whether the yield curve inversions of 2019 would have led to a recession without the adverse impacts of the COVID-related lockdowns…
… Conclusion
Now for the $64,000 question (not adjusted for inflation). Is a recession inevitable given the inverted nature of the UST yield curve? If history is any guide, one would come to the conclusion the U.S. economy is headed toward contractionary territory, it’s just a matter of when. Looking at economists’ estimates for Q1 real GDP, the recession may have to wait. In fact, the Atlanta Fed’s GDPNow forecast has the economy growing by 2.1% in Q1, as of this writing. The recent blockbuster jobs report has also created a narrative that perhaps the Fed can achieve the ever-elusive ‘soft landing.’ However, as I write this blog post, the consensus is still projecting negative GDP to show up in the second and third quarters of this year. Just another factor to keep volatility elevated for the money and bond markets!
Curve and Ivory Tower-O-Nomics aside, some technical views and TLINES to consider …
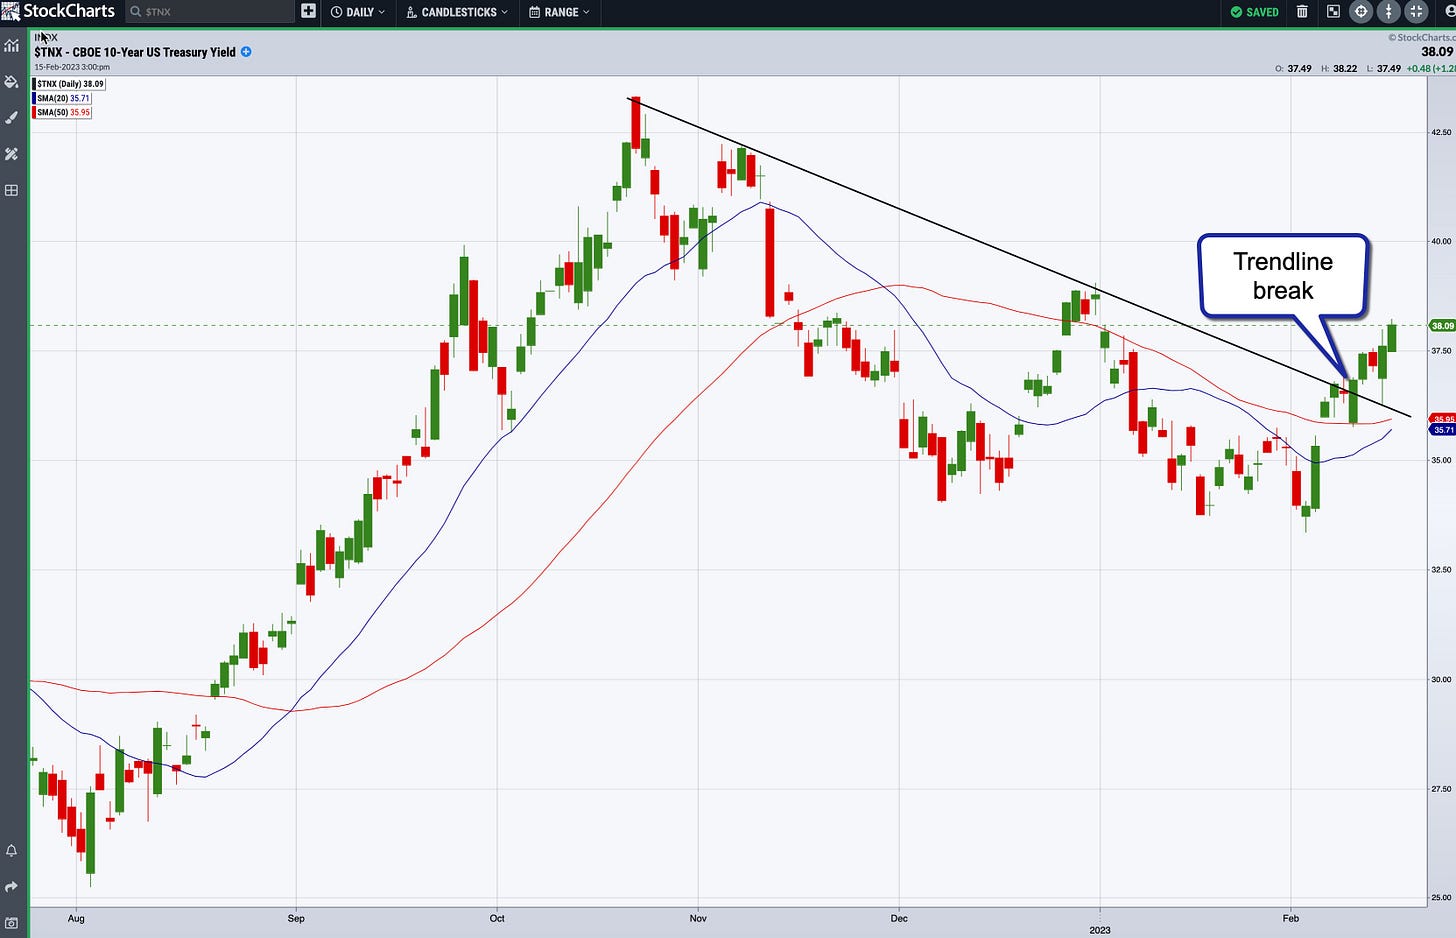
StockCharts DOT COM: Four Charts To Keep Inflation at Bay
… 10-Year US Treasury Yield Index
Like stock prices, bond prices are impacted by inflation. After trending lower since October 21, 2022, the 10-year US Treasury Yield index ($TNX) broke the downward trendline on February 10, 2023.
CHART 2: 10-YEAR TREASURY YIELD INDEX. The 10-year yields broke above a downward-sloping trendline and look to have started an uptrend, although that could change if there's certainty that interest rate rises will start tapering.Chart source: StockChartsACP. For educational purposes only.
Another point to note on the chart is that the 20-period moving average is getting close to crossing above the 50-day moving average. If the cross does take place, it could signal that yields may move higher. This could change in a snap if inflation numbers support a tapering or pivot in the future…
… Three Out of Four Ain't Bad
The S&P 500 index and US dollar are at a critical juncture. 10-year yields are trending higher, although that could change quickly when inflation concerns ease…
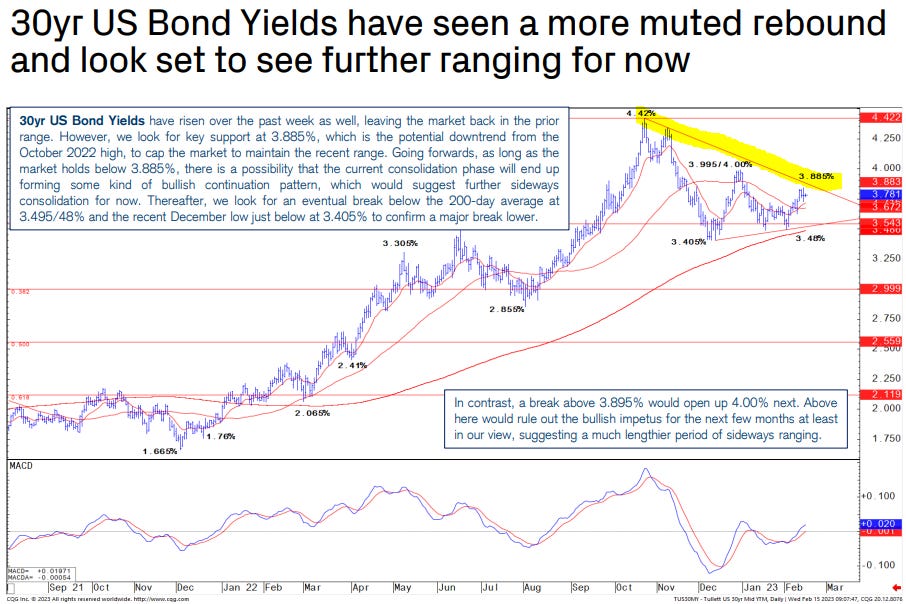
AND some from 1stBOS weekly chartpack
… Outside of Equities, US Bond Yields have risen over the past week, in line with our bias for a short-term recovery back into the range. However, the market is now close to key levels at 3.795/82%, which we expect to cap to keep yields on a downward trajectory…
AND … THAT is all for now. Off to the day job…


