(USTs mixed, 'clinging to support' on avg volumes) while WE slept; LOTTA LIQUIDITY + AI + large dollop of HOPE AND … we're aggressively UNCH over past 9mo (since Jackson Hole)
Good morning … it’s really GREAT that yields are back to rising and stocks are BID and the whole March episode in banks is now firmly behind us and … claims? Well, THAT was all sorted out … phew …. all this did have me worried for a bit,
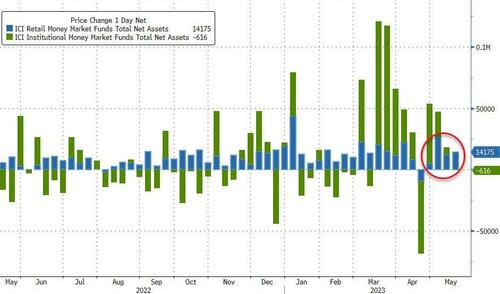
ZH: Fed Emergency Bank Bailout Facility Hits Record High; Money Market Inflows Suggest Deposit Run Not Over Yet
To be fair, it’s REMAINS the case that the bar for a rate CUT REMAINS high and things will have to get measurably WORSE and quickly for CME FedWatch Tools (and those placing bets behind these odds) to prove correctly.
Lets NOT forget (he says, adding something from #fintwit cuz, you know, I believe EVERYTHING on the www),
"higher interest rates, slower growth, and softer labor market conditions will bring down inflation, they will also bring some pain to households and businesses... But a failure to restore price stability would mean far greater pain" Powell in Jackson Hole last year …
… Almost 9 months on from that Jackson Hole speech, we didn't quite get the pain people expected...
S&P opened that morning: 4198 S&P closed yesterday: 4198 Unemployment then: 3.5% Unemployment now: 3.4%
(h/t AT FerroTV) … something, eh? long and variable bla bla bla … are we complacent yet and is the shoe about to drop on our heads OR will we continue to muddle through … Tell you what. In MY humble view, I get the sense the shoe WILL in fact drop but if it doesn’t do so quickly, gloom and doom (and those betting on rate cuts (CME FedWatch Tools) as if they are using DraftKings) will likely have to borrow MY new, fat crayon to redraw their very OWN TLINEs …
Speaking of which,
Attempting here to highly what looks to ME to be an OVERSOLD condition which can resolve in a couple ways — a SIDEWAYS MOVE or a drop in yields.
Thats it. Wait for bullish cross set up some tight stops and … get long if willing to ‘risk’ 20bps upside (top of recently redrawn triangulation ~3.85%)?
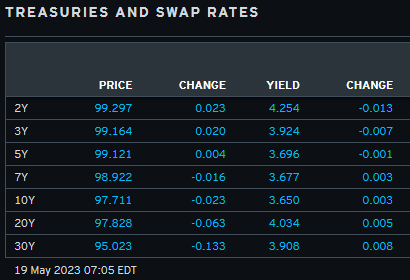
NOT a recommendation just an observation … as always, curious what you think and in meanwhile … here is a snapshot OF USTs as of 705a:
… HEREis what this shop says be behind the price action overnight…
… WHILE YOU SLEPT Treasuries are aggressively mixed as US duration benchmarks gamely cling to range support levels amid a quiet tape (tough to find link-worthy stories this morning) ahead of Powell at 11am. DXY is lower (-0.27%) while front WTI futures are higher (+1.1%). Asian stocks were mostly higher, EU and UK share markets are all in the green (SX5E +0.65%) while ES futures are little changed here at 7am. Our overnight US rates flows saw a rebound in curves after yesterday's flattening with real$ a buyer of 10's and intermediates. Demand remains in the front end with renewed demand for front-end paper on ASW emerging. Overnight Treasury volume was about average with 5's and 10's (120%) seeing some above average turnover, matching our flows.
… and for some MORE of the news you can use » IGMs Press Picks for today (19 MAY) to help weed thru the noise (some of which can be found over here at Finviz).
From some of the news to some of THE VIEWS you might be able to use… here’s what Global Wall St is sayin’ …
Steepeners are in vogue, but are they still a good trade? In this Deep Dive, we analyse the curve through various lenses, including experience from past cycles compared to what is in the price, a more macro-based model, and our term premia.
We conclude that:
The steepening in EUR 2s10s has gone too far too fast, so the risk reward does not look good.
Risk reward is more favourable in forward starting EUR 10s30s steepeners. Investors limited to bonds could consider Germany instead.
Our macro model further draw caution towards EUR 2s10s and 5s10s, with 10s30s a better choice.
However, 2s10s steepeners still make sense in the UK, we argue.
From France TO a large British operation noting stocks may be ‘rich’
The S&P 500's equity risk premium (ERP) has stayed unnervingly low despite rising macro risks, but its sharp divergence from SPW & SML ERPs indicates that mega-cap stocks are inflating SPX valuations, especially after the regional banking crisis. We caution against an overly bullish take, but see selective opportunities.
But then, perhaps stocks ARE CHEAP … IF you believe in CME FedWatch Toolpricing of CUTS … a large German operation weighs in (not on stocks but…)
In today's FICoTD we examine what the options markets considers the probability of central banks taking rates aggressively lower in the next 12 months. To do this, we use narrow put spreads to find the market-implied probabilities for SOFR and SONIA < 4%, and Euribor < 3%.
Unsurprisingly the probabilities were driven sharply higher by the onset of banking stresses. Interestingly though, we see that while the Euribor and Sonia probabilities have retraced these moves, SOFR options have not similarly adjusted.
Whilst the discrepancy in the retracements is notable, the US leg is consistent with our forecasts: our US Economics team have the Fed Funds mid-point at 4.125% at the end of Q1-24 and 3.125% at the end of Q2-24.
And so, back TO figuring out WHERE burden of proof lies …
AND from the intertubes cuz, you know, I believe EVERYTHING I read on the web, I’ll begin with a weekly FIXED INCOME letter from Bloomberg
The Weekly Fix: Debt ceiling deal? The problems don't end there
… In addition, a deal means the Treasury Department needs to sell a lot of Treasury bills to replenish its dwindling cash buffer and maintain its ability to pay obligations. By some estimates, that borrowing could top $1 trillion by the end of September. That would suck liquidity from the banking sector and tighten the screws on the US economy. Bank of America Corp.’s estimates it would have the same economic impact as a quarter-point interest-rate hike.
Speaking of a Rate Hike…
Avoiding financial Armageddon also means the Federal Reserve may not be done with its interest-rate hikes. On Thursday, the bond market assigned about a 40% chance of a rate increase at the Fed’s meeting next month, after Dallas Fed President Lorie Logan said the case for pausing isn’t yet clear.
Just a few weeks ago, the bond market was convinced that the Fed has ended its most aggressive tightening cycle since the 1980s amid the regional bank turmoil, and the next move would be a cut, as soon as July.
If it materialized, such a cut would mark the quickest policy reversal — from tightening to easing — since then-Fed Chief Alan Greenspan slashed borrowing costs in the aftermath of Black Monday in October 1987.
Over the last few weeks though, small banks have shown signs of stability while economic data such as retail sales, suggests the economy is holding up well. Inflation, meanwhile, is cooling, but remains more than double the central bank’s 2% target.
Until inflation comes down more, bond bulls who are betting on rate cuts will have to bide their time …
Long and variable they say. Bet on RATE CUTS they say … CME FedWatch Tool, they say … Not to single anyone out, stock jockeys ALSO have some ‘splainin’ to do and so, to an EQUITY related note on BBG
John goes on in the note to ask WHERE did the rally come from AND by process of elimination he notes NOT EARNINGS
NOT rates EITHER,
AND with somewhat MORE on <NOT> rates,
… Put all of this together, and the market still thinks that the Fed will be easing by the end of the year — but it’s significantly less certain than it was Jan. 1. As the estimates for future fed funds rates derived from the futures market by the Bloomberg World Interest Rate Probabilities function show, the current expected path for the central bank is somewhat more aggressive than the one mapped out for it at the turn of the year. So it’s very hard to attribute this rally in stocks to any greater optimism on lower rates:
John then attempts to turn convo to LIQUIDITY,
… Maybe It’s the Liquidity Then
To Wells Fargo & Co. strategists led by Christopher Harvey, earnings haven’t been the key, as until the last few days the performance of the S&P 500 has been “unimpressive.” From the close on April 13, when the big banks started the earnings season, to Tuesday, the S&P’s price return was slightly negative to the tune of -0.9%. Earnings are not the catalyst for the rally.
Instead, they offer two catalysts, both related to liquidity. 1) The Bank Term Funding Program (BTFP), in which the Fed offered to lend to banks on the assumption that the bonds in their portfolio were still worth their face value, combined with the expansion of the Fed’s balance sheet and 2) the lower cost of capital that came with richer equity multiples and lower bond yields.
For the first, virtually all of the S&P 500’s gain for the year (barring this week’s surge) can be traced to the 7.5% rally from March 13 to April 13, which took it from 3,856 to 4,146. This coincided with the creation and growth of the BTFP as well as an expansion of the Fed’s balance sheet in response to the collapse of SVB and Signature Bank. Whatever the official interest rates, money was available. As money is also fungible, it had a way of finding where it could make the best return. The Fed’s balance sheet grew roughly $400 billion to $8.73 trillion between March 1 and March 22 as it tried to contain the crisis. It currently stands at around $8.50 trillion.
For the second, there was a slide in the expected federal funds rate on the anticipation that the Fed would pivot (since largely reversed). As the rally started, the projected rate after next month’s Federal Open Market Committee meeting had just dropped from about 5.5% to about 4.7%. Coinciding with this was a “defrosting of credit markets” that saw investment-grade corporate spreads compressing almost 30 basis points from this year’s peak of 163 on March 15 — again a phenomenon that was likely helped by the BTFP and increased liquidity.
To illustrate, Wells Fargo offers the “all-in yield” (the 10-year Treasury yield plus the investment grade spread), and shows that it has had a very high 85% correlation with the S&P 500 since stocks peaked and began to fall at the beginning of last year:
“Funding and liquidity, not earnings/fundamentals, are the year-to-date drivers of the S&P 500 rally,” Harvey said. The “risk of a market reversal appears elevated on the back of wider credit spreads and/or a shrinking Fed balance sheet.” Obviously, an unsuccessful outcome to the debt ceiling talks could yet affect this calculation profoundly.
But there is at least some reason to think that the Fed is keeping liquidity flowing through the system, even if it’s keeping rates high to try to battle inflation. The following chart is from Mike Howell of Crossborder Capital in London, a specialist in tracking liquidity. It shows US bank reserves. They declined sharply until last October’s crisis in the UK gilts market reminded everyone of the kind of financial accident that can happen when liquidity dries up and rates rise. Since then, reserves have moved sideways. Nothing, it seems, will be allowed to bring those reserves below the “ample” levels that regulators have prescribed since the Global Financial Crisis. That in turn implies that while there are obvious risks to liquidity ahead (from rising inflation, or defaults, or a debt ceiling disaster), the Fed will do its damnedest to keep the liquidity flowing. That calculation makes investors feel that it’s safe to buy stocks:
And so, the stories conclusion?
AI Think There Might Be Something Else…
There’s one final ingredient to explain this year’s rally, and in particular the performance of the last few days: artificial intelligence. It’s causing bona fide excitement, and that shows up in startling stock moves. Points of Return detailed last week how references to AI were beginning to have the same impact that mentions of Bitcoin or dot-coms had in previous generations. This week’s latest example comes from an ultra-bullish interview that Jensen Huang, the CEO and founder of the chipmaker Nvidia Corp., gave to CNBC on Wednesday:
We have reinvented computing for the first time since the IBM System 360, 60 years ago. There’s a trillion dollars worth of data center infrastructure installed in the world based on that old method of doing computation. Now we have accelerated computing, and we have the killer app for generative computing: generative AI.
Big bold claims like this tend to transport some of us back 25 years to the dawn of the internet age, when similarly transcendent forecasts were being made, and even Alan Greenspan allowed himself to believe in a “new economic paradigm.” The interview had the kind of effect on Nvidia’s share price that we might recall from 1999 and 2000 as well. A 5% gain on Thursday meant that its market cap has risen by $82.5 billion in the four trading days so far this week. For reference, that’s slightly more than the entire market cap of Altria Group Inc., the biggest tobacco manufacturer in the US. Nvidia’s stock has risen 112% for the year so far, and is closing in on its all-time high from 2021.
… This is where markets get into difficulty. The internet was a revolutionary development, and the latest breakthroughs in AI look like they might be comparable.The internet eventually made a lot of money.But the difficulty of working out who would make that money, and pricing gains that remained a long way in the future, helped destroy a lot of wealth.They also created a bubble whose bursting precipitated a bear market and a recession. The catalyst for the latest market surge has come from the conjunction of a lot of liquidity with an exciting story. It’s based on (reasonable) hopes, rather than anything that has yet happened.
And so … LOTTA LIQUIDITY + AI + large dollop of HOPE AND … 9mo on from Jackson Hole and the S&P as well as URATE are essentially UNCH … in other (not)words,
For somewhat MORE and those who are subs to get behind Dr. Ed Yardeni’s paywall,
Our short answer to the question posed in the title: "Bull market." The S&P 500 rose to a new high today of 4198.05 for 2023 taking out the February 2 closing high of 4179.76 (chart). The market has climbed a Wall of Worry thanks to Wall Street's Worriers, who've predicted that the banking and the debt ceiling crises could make their widely expected imminent recession worse.
They could still be right, at least about a recession (eventually).However, concerns about both crises are abating rapidly. The S&P 500/400/600 Financials rallied in recent days. We think they are bottoming (chart). We are expecting a wave of mergers and acquisitions among the regional and community banks. Instead of worrying about which will fail, investors should bet on which will be acquired.
… Retail funds saw over $14 billion of inflows while institutional funds actually saw a small outflow...
Source: Bloomberg
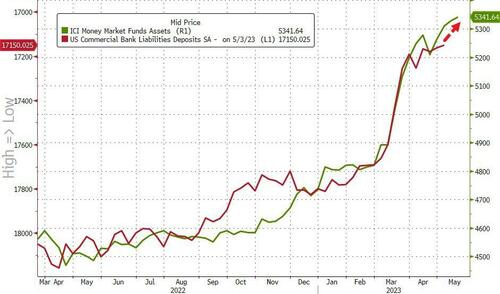
This surge in money market fund inflows strongly suggests tomorrow's H8 deposit report will show the bank walk/run is continuing...
Source: Bloomberg
… and so, I’ll leave you back TO the part of the show where all this ABATES QUICKLY ahead of a weekend giving much needed rest to those who’s PEN is mightier than any investor / trader sword (?)
In closing a couple VISUALS for us visual learners …
McClellan Financial: Copper Shows Bearish Message For Stocks - Chart In Focus
Read on and see NYSED Daily A/D Line and SP500 and Tom concludes
… The message of both copper and the A-D Line is that liquidity is tight, and you can thank the Federal Reserve for achieving the goal it has set out to accomplish. They think that they can suppress price inflation by removing liquidity from the banking system via higher short term rates and "quantitative tightening", or QT, meaning selling off their bond holdings. Whether that will actually suppress inflation is a separate question, but there is no doubt that it is hurting financial market liquidity.
I reiterate the new math …
LOTTA LIQUIDITY + AI + large dollop of HOPE AND … 9mo on from Jackson Hole and the S&P as well as URATE are essentially UNCH
AND then there’s this visual which is often bantied about — QQQ and USTs — cuz, you know, tech is a very long duration asset and so,
… Growth stocks tend to trend with bonds since they’re both long-duration assets. Changes in interest rates directly impact US Treasuries and affect tech stocks more than other equities.
Check out the tight relationship between the Long-Term Treasury ETF $TLT and the Technology sector $XLK:
Notice how these two ETFs peaked and troughed together during last year’s primary downtrend.
Interestingly, this strong intermarket relationship broke down early in the year. TLT continues to churn sideways while the tech sector catches higher.
Divergences such as this are commonplace. But strong relationships like those between TLT and XLK often fall back in line.
Here’s the big question…
Will TLT catch a bid toward tech stocks?
Or, will XLK drop down to bonds?
I’m leaning toward the former based on the weight of the evidence…
Tech leading bonds following TECH aside, and back TO the reliable triple DUBS, a SPIN which does speak TO the PIVOT’istas and those who are betting on rate CUTS and so, the wind beneath the CME FedWatch Tools wings,
ZH: Battered By Inflation, 90 Million Americans Struggle Paying Bills As Credit Card Usage Spikes
noted by chartreport, "...The S&P 500 broke out to nine-month highs on an absolute basis this week. Austin points out that it's also breaking out relative to Bonds ($SPY/$TLT). This ratio closed at all-time highs after emerging from a seven-month base within a secular uptrend. If Stocks are in a bull market, you want to see them outperforming their alternative, and that's exactly what we're starting to see."
stocks bottom and outpacing bonds good combo / setup?


S&P 500 Chart.....Looks like a Double Bottom ????
I'll leave that to professionals but did notice in context of BONDS, SPY / TLT tweet
https://twitter.com/meanstoatrend/status/1659647723165851650?s=20
noted by chartreport, "...The S&P 500 broke out to nine-month highs on an absolute basis this week. Austin points out that it's also breaking out relative to Bonds ($SPY/$TLT). This ratio closed at all-time highs after emerging from a seven-month base within a secular uptrend. If Stocks are in a bull market, you want to see them outperforming their alternative, and that's exactly what we're starting to see."
stocks bottom and outpacing bonds good combo / setup?