Good morning … in these last few hours before the NFP — which will shape shift the narrative into the weekend — there’s truly very little for me to add here and now.
I will say (and it is noted below) that the better stocks do and the more rates fall, the EASIER ‘financial conditions’ (choose your methodology and ticker) get and so we are back to asking if that is good or bad news (and then if bad = good = bad … or vice versa).
I’ll leave that philosophy aside for now and begin with a look at 5yy …
What YOU see may very well depend on this past week and however YOU perceive the macro narrative to have shifted (Fed DONE, next move a HIKE — so taking chips OFF the table here / now and getting OUT of belly longs … OR perhaps you are looking longer-term at US economic locomotive slowing and see room for rates to move even lower — ie the weekly).
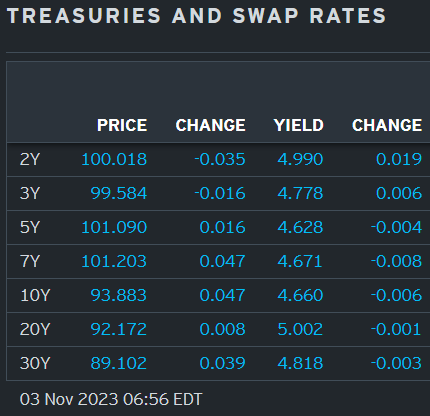
YOUR view far more relevant than mine (and theirs, tbh) and so without further delay ahead of the data (and lack of SUPPLY news announced this past week) and WEEKENED … here is a snapshot OF USTs as of 656a:
… HEREis what this shop says be behind the price action overnight…
… WHILE YOU SLEPT Treasuries are mixed with the belly outperforming as markets hold breath from NFP and ISM services. DXY is lower (-0.15%) while front WTI futures are little changed. Asian stocks followed NY higher this morning, EU and UK share markets are mixed while ES futures are showing -0.15% here at 6:35am. Our overnight US rates flows were unavailable at press time and overnight Treasury volume was ~average all across the curve.
… and for some MORE of the news you can use » The Morning Hark - 14 Aug 2023 and IGMs Press Picks (who CONTINUES to be sportin’ that new, fresh look) in effort to to help weed thru the noise (some of which can be found over here at Finviz).
And speaking of noise, before I move on from the ‘news’,
We are entering an era of higher and more volatile inflation, leading to broad changes in the investing landscape The writer is chief US economist at Brevan Howard
Predicting precisely when markets will reflect macro forces is nearly impossible. As economist Rudiger Dornbusch quipped: “In economics things take longer to happen than you think they will, and then they happen faster than you thought they could.”
But investors sooner or later face an important adjustment — all assets will need to reprice because of the end of three big trends…
… The dramatic rise in long-term interest rates since mid-year is a useful case study. For the past couple of decades, the term premium — the compensation that investors require to buy longer duration assets — had been trending lower and even turning negative in recent years. Demand for long-duration assets was so large that investors were willing to forego protection and actually pay up for yield.
… This “new abnormal” will be characterised by higher and more volatile inflation as well as a return to structurally higher interest rates. In retrospect, the new normal looks like a unique period of historically depressed interest rates after the financial crisis. In the future, investors will have to learn anew how to operate without a fiscal or monetary safety net.
NOW, moving from some of the news to some of THE VIEWS you might be able to use… here’s SOME of what Global Wall St is sayin’ … as the narrative shape shifts and turns ahead of this mornings most important of all time NFP …
… The rally that began in the wake of the refunding announcement has extended to start the session and 10-year yields reached 4.665%. There's little in the way of relevant data before tomorrow's payrolls report, and we expect the price action itself will be in focus as the market sets up first for the jobs numbers, and then for next week's refunding auctions.
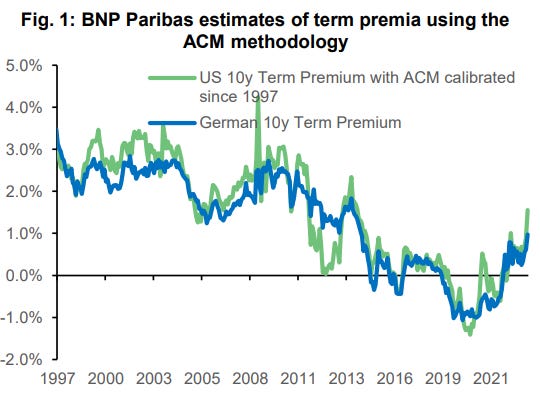
BNP - Global rates: Term premium comes out of hibernation (thought winter time meant the exact opposite was to happen … maybe it’s got to do with science and steerin’ into the <economic> skid?)
KEY MESSAGES
Our analysis suggests the material re-pricing higher in global term premia is justified and here to stay, supporting our continued preference for curve steepeners.
Especially in Europe, we see any further upward yield repricing likely to be led by real rates and term premium.
In the US, the record forecasted supply outlook appears largely priced by the market. The evolution of the economic and Fed cycle is key to the path from here.
This piece concludes our three-part series on global liquidity, supply and now term premium.
Consistent with this analysis, we hold on to our 3s10s UST steepeners, 5s10s30s UST flyand tactical Bund short.
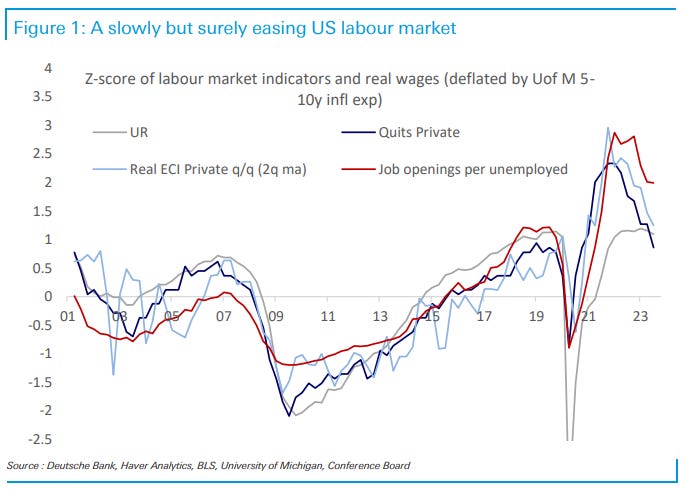
DB - US job market: Slowly but surely easing (this is good, right? or bad? or bad IS good? someone wake me when bad is bad … k thanks, bye)
Following the release of the quarterly ECI data and ahead of NFP, we update the chart of various labour market metrics (private sector quits, Openings/unemployed, unemployment rate) vs. real wages (private sector ECI deflated by 5-10y inflation expectations, 2-quarter average). Here are a few observations:
The latest ECI was broadly in line with the quit rate. The quit rate continues to prove to be the best leading indicator of wages and as such the most reliable measure of labour market slack.
Both wages and the quit rate have been trending down for 6 quarters.
The labour market is no longer extraordinarily tight, but it is still healthy.
On current trend, wages will be consistent with the 2% inflation target in Q2/Q3 2024.
DB - Payrolls could pose a serious dilemma (Ruskin …)
The last payroll was so strong that with revisions, it completely changed the solid downward profile in the 3m average that looked to be heading to 100K per month by the end of the year. But in some ways the September NFP looked too good to be true. It also potentially complicates our understanding of the coming employment report. For example, what would we make of a 50K non-farm payroll for October. Prima facie it looks weak, but the 2m,3m, 4m, and 6m averages without revisions to prior months would be respectively 193K, 204K, 212K and 206K (see Figure 1) and if we make adjustments for striker distortions the 2m, 3m, 4m, and 6m averages would be 208K, 214K, 220K, and 211K respectively.
In other words,a 50K number would still be consistent with an ongoing trend in payrolls of a little above 200K per month. The question is, would a 50K number represent a backlash to the prior months above trend strength; or, is it a genuine sign of a serious loss of labor market momentum? That is the dilemma. How does the market solve for this hypothetical but very plausible situation?
In general, trading in the immediate aftermath of yesterday's FOMC has shown a market that "wants to believe" that now is the time to trade the "Peak Rates" thesis. "Peak Rates" trades include all of: short USD, long carry, long duration, and long risk/equities.
The good news for "Peak Rate" trades is that the market has set a very high bar on payrolls that is quite easy to miss on the softer side. Figure 1 also shows what the market's expectation for NFP (180K actual + 30K strikers) imply for the averages. The 2m, 3m and 4m averages are all above 250K per month, which is very strong by almost any other business upswing standard.
DB - Data DBrief: Productivity to add to Powell's positive potential growth story
Last year, we highlighted how the strong trend in wage growth could be pointing towards a coming productivity boom based on the historical relationship between these two variables (see "Is a productivity boom in the offing?"). While this relationship appeared to breakdown for some time, this morning's robust productivity data indicate that this dynamic may be starting to play out, with labor market tightness driving productivity gains.
The pickup in wage gains is consistent with a continued uptrend in productivity growth over the next two years. This dynamic is also likely to find some support from AI adoption (see our AI site here). A productivity pickup could therefore add to Chair Powell's case for temporarily stronger potential growth due to labor supply gains (see "November FOMC recap: Sustained selloff needed to sell Fed on 'sufficiently restrictive'").
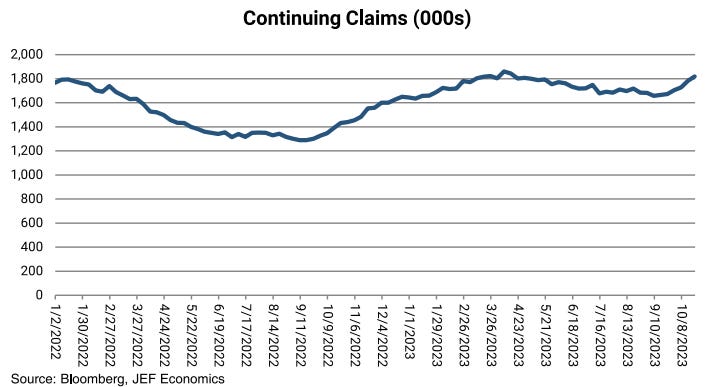
In previous work, we found that continuing claims were the best leading indicator for recessions, signaling one was looming when the four-week moving average is more than 11.5% above its minimum over the last 52 weeks. By this metric, recent continuing claims data are concerning, registering a 40% rise at the recent peak.
In this piece, we argue that this metric is less appropriate in the current environment because of both normalization in the labor market from the extreme tightness in 2022, as well as issues interpreting seasonal factors in the wake of a methodological update to the models used to produce them. This update seems to have introduced some excess seasonality into the claims data, particularly for continuing claims.
We present alternate ways to interpret upcoming claims data, including a preference for initial claims over continuing, consideration of the current levels relative to 2019 levels, and whether the year-over-year change in non-seasonally adjusted data deteriorates.
We estimate nonfarm payrolls rose by 195k in October, above consensus of 180k and reflecting a 225k underlying gain offset by a 30k drag from autoworker strikes (mom sa). The more reliable Big Data measures indicate another month of strong job growth, and initial jobless claims fell further. We also believe tight labor markets may have incentivized a pull-forward of pre-holiday hiring, for example in the retail sector…
… We estimate a 0.20% increase in average hourly earnings (mom sa) that lowers the year-on-year rate to 3.94%, reflecting waning wage pressures and negative calendar effects (the latter worth -5bps month-over-month, on our estimates). Consensus for average hourly earnings is +0.3% month-over-month and +4.0% year-over-year
BOTTOM LINE: Nonfarm productivity increased 4.7% in the third quarter (qoq ar), above expectations, and the year-on-year rate increased 1.0pp to +2.2%. Unit labor costs decreased 0.8%, below expectations. Initial jobless claims were slightly above expectations, while seasonal distortions likely boosted continuing claims.
JEFF - Initial Jobless Claims Rise Modestly, But Is There Trouble Brewing With Continuing Claims?
Key Points ■ In the week ended October 28th 217k people filed for unemployment insurance, up 5k from the prior week's upwardly revised 212k (initially 210k). The consensus call for claims this week was 210k. ■ The 200k print from 2 weeks ago was the lowest level of initial claims since January 28th, 2023. ■ Unadjusted claims were unchanged from the prior week at 191.9k. This measure has been under 200k for 11 straight weeks. ■ Claims have risen 17k in the last 2 weeks, but this does not qualify as a break in trend. Claims have been under 220k for 7 straight weeks, and they remain well below the range that prevailed over the summer.
… We remain of the opinion that the labor market is becoming increasingly vulnerable, and the turning point is likely at the end of this year or early 2024. Businesses will struggle to pass on further price increases to an increasingly strained consumer, and margins will fall as inflation slows, leading to layoffs eventually. As with every other element of the economic outlook, it is taking longer to play out than expected.
We are especially concerned about small businesses in this regard. Interest rates on SBA loans are floating rate, and the monthly payments have ballooned over the last 12 months. The increase to-date has likely been a force behind the overall slowdown in hiring. It has not translated to layoffs yet, but it will eventually…
We forecast payrolls rose 190k in October, with private payrolls up 180k. Strikers subtract 30k, but the pickup in payrolls of the last three months also animates our forecast. Average hourly earnings rise on-trend 0.3%M. Despite payroll strength we expect the unemployment rate +0.1 to 3.9%.
UBS (Donovan) - It’s “average hourly earnings are not wages” day
Today is the monthly reminder that average hourly earnings are not wages. When the composition of the labor market shifts, the gap between the two is likely to grow. In other words, it is time for the US employment report. The UK recently admitted that no can trust its labor market data, and it is worth remembering that US non-farm payrolls is based on a survey with a less than 50% response rate.
The survey is expected to show moderate job creation and stable unemployment (albeit with past data revisions). The general message is that US consumers have no reason to save out of fear of unemployment, but that the labor market is unlikely to be a major boost to their consumer spending power…
… Seasonal hiring for the holidays is soft this year, Challenger says … Layoff announcements fell back to 37K on a not seasonally adjusted basis in October, down from the 47K cuts announced in September. The report released by Challenger, Gray and Christmas was up 9 percent year-over-year. The west led job cut announcements, accounting for nearly 17K, and cuts were most concentrated in the technology sector, with almost 7K. Challenger also announced that US firms have announced just over 573K seasonal positions as of October, the lowest for this point in the year since 2013. Retail and transportation firms reported among the lowest byindustry hiring announcements, adding to a generally soft picture for the holiday season.
Wells Fargo - A Productive Summer for American Workers
Summary Nonfarm labor productivity grew at a robust 4.7% annualized rate in the third quarter, the second consecutive strong reading. Over the past four quarters, labor productivity has grown 2.2%. An acceleration in productivity alongside slowing nominal wage growth bodes well for the Federal Reserve's fight to return inflation to 2% on a sustained basis
The market barely reacted Wednesday afternoon following Powell’s remarks, cooking up a big, fat nothing burger for investors.
Market participants took the decision to leave rates untouched in stride. After all, the pause in the hiking cycle was the expected outcome. Since investors already pegged the Fed, the valuable information hung on Powell’s words or forward guidance.
Yet judging by today’s performance, it appears the market just needed a little time to marinate.
Yesterday’s failed reaction has given way to a delayed response as long-duration bonds scream higher.
But before we get ahead of ourselves and rush out to buy the bond market bottom, let’s check the charts…
First, the monthly 10-year T-note chart:
JC broke it down last night in his monthly strategy session. Reviewing monthly candlestick charts sits atop our list of best practices, forcing us to reconnect with the underlying trend.
Bigger picture: The path of least resistance remains lower for US Treasuries.
On the other hand, early signs of a potential bullish reversal are developing over shorter time frames.
Check out the 10-year T-Note futures daily chart:
Price is challenging the upper bounds of a multi-month downtrend line while the 14-day RSI nears its highest reading since May. Plus, momentum is posting a bullish divergence.
Christian Tharp joined the Morning Show earlier in the week, discussing the bullish divergence and the implications of a near-term bounce in the US T-Bond ETF $TLT. Keyword: near-term.
Christian is a swing trader eyeing a quick tactical rally. Here’s a TLT chart highlighting a couple upside objectives:
The 91.75 level coinciding with the 2022 trough and this year’s Aug. low marks a logical area of potential resistance and an initial upside target.
Perhaps a steep rally toward 99 is in the cards. But I imagine a prolonged base-building process occurs before price challenges that shelf of former lows.
Increased uncertainty rules the day. It’s evident in the choppy, indecisive market conditions.
Nevertheless, bonds are bouncing this morning, especially the 10- and 30-year futures.
As always, we must know who we are as traders or investors before entering the market. That’s especially true for approaching bonds at these levels.
Are you looking for a quick swing trade that could last a few days or a couple weeks?
Or, are you a longer-term investor?
If it’s the former, you have potential upside targets in TLT outlined above.
But if you have a longer time horizon, what’s the rush? The structural and intermediate downtrends remain intact. You could even call TLT a “falling knife.”
Instead of picking the bottom, give the bond market room to dance and see where it decides to land heading into the weekend…
Bloomberg Weekly FIX - The Weekly Fix: Financial conditions are the Fed’s fickle friend
… Boomerang Effect There was an irony embedded in the market action following the Fed’s second straight hold this week. After Powell specifically name-checked rising bond yields as helping to tightening financial conditions, a roaring cross-asset rally immediately unwound some of that progress.
“One problem, I think, the chairman has at this point, is by talking to markets in a supportive way, stocks rally, bond yields fall — that’s loosening financial conditions,” Bill Dudley, the former president of the New York Fed, said on Bloomberg Television. “That’s removing some of the restraint that was creating some impetus for not tightening monetary policy further.”
After breaking above 5% for the first time since 2007 last week, 10-year Treasury yields plunged below 4.70% on Thursday, while the S&P 500 posted its best day since April. That nudged the Bloomberg US Financial Conditions Index — which measures stress in money, bond and stock markets — back towards less-restrictive territory, following three months of tightening.
It’s a tricky situation for policymakers, who have repeatedly stressed that financial conditions are the mechanism through which monetary policy touches the real economy.
Bloomberg - Not even thinking about thinking about rate cuts (Authers OpED)
… Meanwhile, the basic belief that the extreme low-inflationary environment that has persisted for much of this century appears to remain intact. Thirty-year inflation breakevens have been rising for several months, topping 2.5%. There are plenty of good reasons to believe that inflation will be higher in future, even if it doesn’t become extreme — demographics and de-globalization both suggest it’s a real possibility. While people still have this idea, and 30-year swaps are indeed going up, it again looks premature to be betting on rate cuts:
… So How to Allocate Assets? For weeks now, rising yields have been seen as the driver of equities, with both moving in lockstep. That’s resulted in pain for the time-honored portfolio of 60% stocks and 40% bonds. More recently, a Bloomberg gauge of the 60/40 model had slumped roughly 8.4% since July until the recent rebound. While they move together, they offer no diversification:
Such high correlations make sense for now, but they’re not sustainable, said Adam Abbas, portfolio manager and co-head of fixed income at Harris Associates. The volatility of the iShares 20+ Year Treasury Bond ETF (ticker TLT) now exceeds that of the SPDR S&P 500 ETF Trust (SPY). The ICE BofA MOVE Index, which tracks price swings on US bond options, has had an average reading of 124 over the past year, almost double its measure over the previous decade. “That doesn’t make any sense and that certainly does not create a healthy backdrop,” he said.
“Equities will normalize as the full cumulative effects of the tightening cycle start to get into the real economy,” Abbas added. “So you’ll actually see the traditional flight to safety trade come back into US Treasuries and high-quality bonds and the correlations invert to risk assets.”
It’s also worth noting that even after the S&P’s huge Thursday rally, the relative performance of stocks to bonds, as measured by the TLT and SPY ETFs, has just suffered its biggest interruption of the year.
Further, if there are to be rate cuts, they can only happen for reasons that cause bonds to beat stocks. Ian Harnett of Absolute Strategy Research in London draws attention to the way the unemployment rate is inversely correlated with equities’ performance relative to bonds…
Debt worries have been one factor moving long yields lately, and we take another look at debt sustainability metrics. Meanwhile, yields have fallen rapidly from their highs, and markets are already pricing in more easing compared to our baseline.
… US debt metrics more problematic on many measures A US debt crisis is seldom seen as an imminent threat, and we do not expect such a crisis to surface any time soon either. However, a similar debt sustainability analysis as the one done for Italy above does not look pretty for the US. True, the US debt-to-GDP ratio is lower than that of Italy. But the outlook is more worrying due to the massive primary deficits the US is running. One does not need to do any stress testing on the IMF baseline forecasts to find a rising debt-to-GDP ratio.
US public debt on a worrying path
On a path set by the IMF forecasts for the following five years, the average interest rate that would stabilise the debt-to-GDP ratio is in the order of 1-2%. This is not far from the average interest rate on the debt stock of around 2% last year, but at current yield levels the average interest rises rapidly (around a third of US public debt matures over the next 12 months), putting the US debt on an unsustainable trajectory.
US debt metrics not compatible with the current level of interest rates
This is not to say that we expect to see a US debt crisis in the near future. Far from it. The global role of the dollar and the Treasury market allow the US to run irresponsible fiscal policies for longer than other countries, and we are unlikely to be close to the breaking point. And buying by the Fed also serves as a backstop, if needed. As we have argued before, cyclical considerations and new signals from central banks are a more likely driver of long bond yields than rising debt worries.
However, this does not mean that the US fiscal outlook would not pose considerable risks. Market focus could easily stay on the debt outlook and the huge amount of bonds that private investors have to buy at a time when the central bank is reducing its holdings, which could yet propel yields higher. Government debt burdens can quickly become unsustainable if the willingness to finance new borrowing vanishes. The higher the debt burden, the higher the risk of this happening. As stated above, we do not think we are near such a point, but such risks certainly cannot be disregarded…
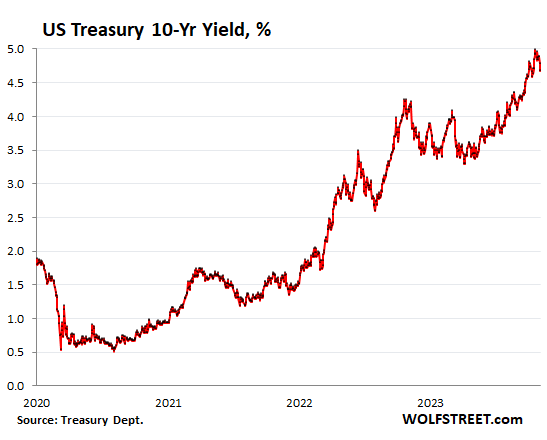
WolfST: Anything Unusual in the Drop of the 10-year Treasury Yield? Despite the Hype & Hoopla, it Hasn’t Done Anything Special
…This multi-day drop fits right in with the ups and downs that mark the volatility of the 10-year yield, and no pattern was broken, and there wasn’t any kind of paradigm shift or whatever despite what the hype-and-hoopla organs are spreading around out there:
… But when was the last time a 30-basis-point drop in 10 trading days occurred? In March 2023 (-58 basis points); in January 2023 (-45 basis points); in December 2022 (-34 basis points); in November 2022 (-46 basis points); in August 2022 (-36 basis points); in July 2022 (-43 basis points), etc. etc.
You get the idea: The 10-year yield is volatile, as Powell pointed out, and this stuff happens a lot, and to a larger extent.
And all these drops were followed by big surges in the yield, and amid all the ups and downs, the yield kept wobbling higher.
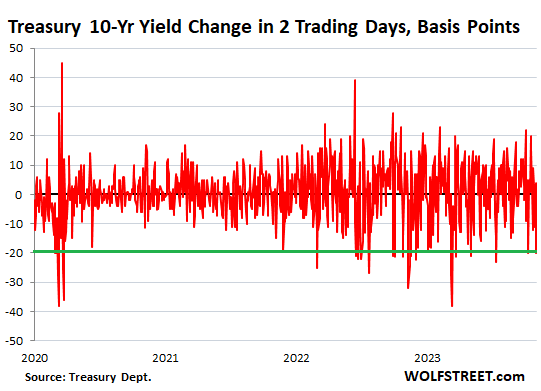
In two trading days from the close of 4.88% on October 31, to the current yield of 4.68%, the yield dropped 20 basis points, which is a pretty big move for two days. How often has that occurred recently? A lot, starting with October 10 (-20 basis points), July 14 (-23 basis points), etc. etc.:
And so I’ll hand it all over TOO NFP …
AND if I’m <LATE / EARLY — please choose> on Monday …
… and hope to have something to say over the weekend but for now … THAT is all for now. Off to the day job…