Bloomberg 5 Things (Americas, tech layoffs? here we go again…?)
… Bitcoin ETFs got approved, the latest inflation reading is on the slate and jobs are being cut in the tech industry. Here’s what’s moving markets…
…Tech layoffs Google is laying off hundreds of staff that work on its digital assistant, hardware, and engineering teams as it continues to cut costs. The move comes as Google, part of Alphabet, has seen its core search business face more pressure from rival AI offerings from Microsoft and OpenAI. It’s the latest in a slew of tech companies to announce layoffs already this year, echoing what happened at the start of 2023. Amazon is cutting workers in its Prime Video and Twitch units and Unity Software is planning to slash 25% of its workforce…
Here’s somethings to read and consider AFTER you’ve planned your BITC ETF trades now that BITC is … ‘out of the bag’
Bloomberg: Caveat emptor — Bitcoin is out of the box for good (Authers OpED and IF you can get beyond all the BITC stuff, there IS a section on the immculate disinflation expected later on this morning … )
The green light for ETFs will open the floodgates for retail investors, whatever warnings the SEC tries to offer.
More from John below but SEEMED like a quiet day yesterday. Perhaps the proverbial calm before the CPI and 30yr auction supply storm?
Looking at a chart of the longer-end of the curve which is up for auction later on today AFTER CPI, it appears they opened ~4.19 and closed ~4.20% … one might be so bold to call yesterday a big fat nuthin’ burger …
ZH: Bonds & Black Gold Dip, Big-Tech Rips As Event Risk Looms
A nothing-burger of a day from a macro (and micro) perspective left stocks and bond yields to drift higher ahead of tomorrow's big inflation print and bank earnings on Friday.
The only thing of note occurred in the last hour when Fed's Williams who appeared to push back against the recent dovish narrative of tapering QT earlier than expected (he was also hawkish on rates)...
*WILLIAMS: DON'T SEEM CLOSE TO POINT OF SLOWING ASSET RUNOFF
*WILLIAMS: NEED TO MAINTAIN RESTRICTIVE STANCE 'FOR SOME TIME'
*WILLIAMS, CITING FED'S BARR, SAYS BTFP EXPECTED TO END MARCH 11!
… In his own words,
… “The FOMC’s policy actions over the past two years have put in place a restrictive policy stance that is helping achieve balance between demand and supply and restore price stability.”
“I expect that we will need to maintain a restrictive stance of policy for some time to fully achieve our goals, and it will only be appropriate to dial back the degree of policy restraint when we are confident that inflation is moving toward 2 percent on a sustained basis.”
“The outlook remains highly uncertain, and I will continue to carefully watch and assess the data to judge whether the stance of policy is best positioned to achieve our goals.”
… Read the full speech HERE … and these comments came AFTER the 10yr auction and a quick recap shows how 10yr auction came and went …
ZH: First 10Y Auction Of 2024 Prices To Tepid Demand, 4th Tail In A Row
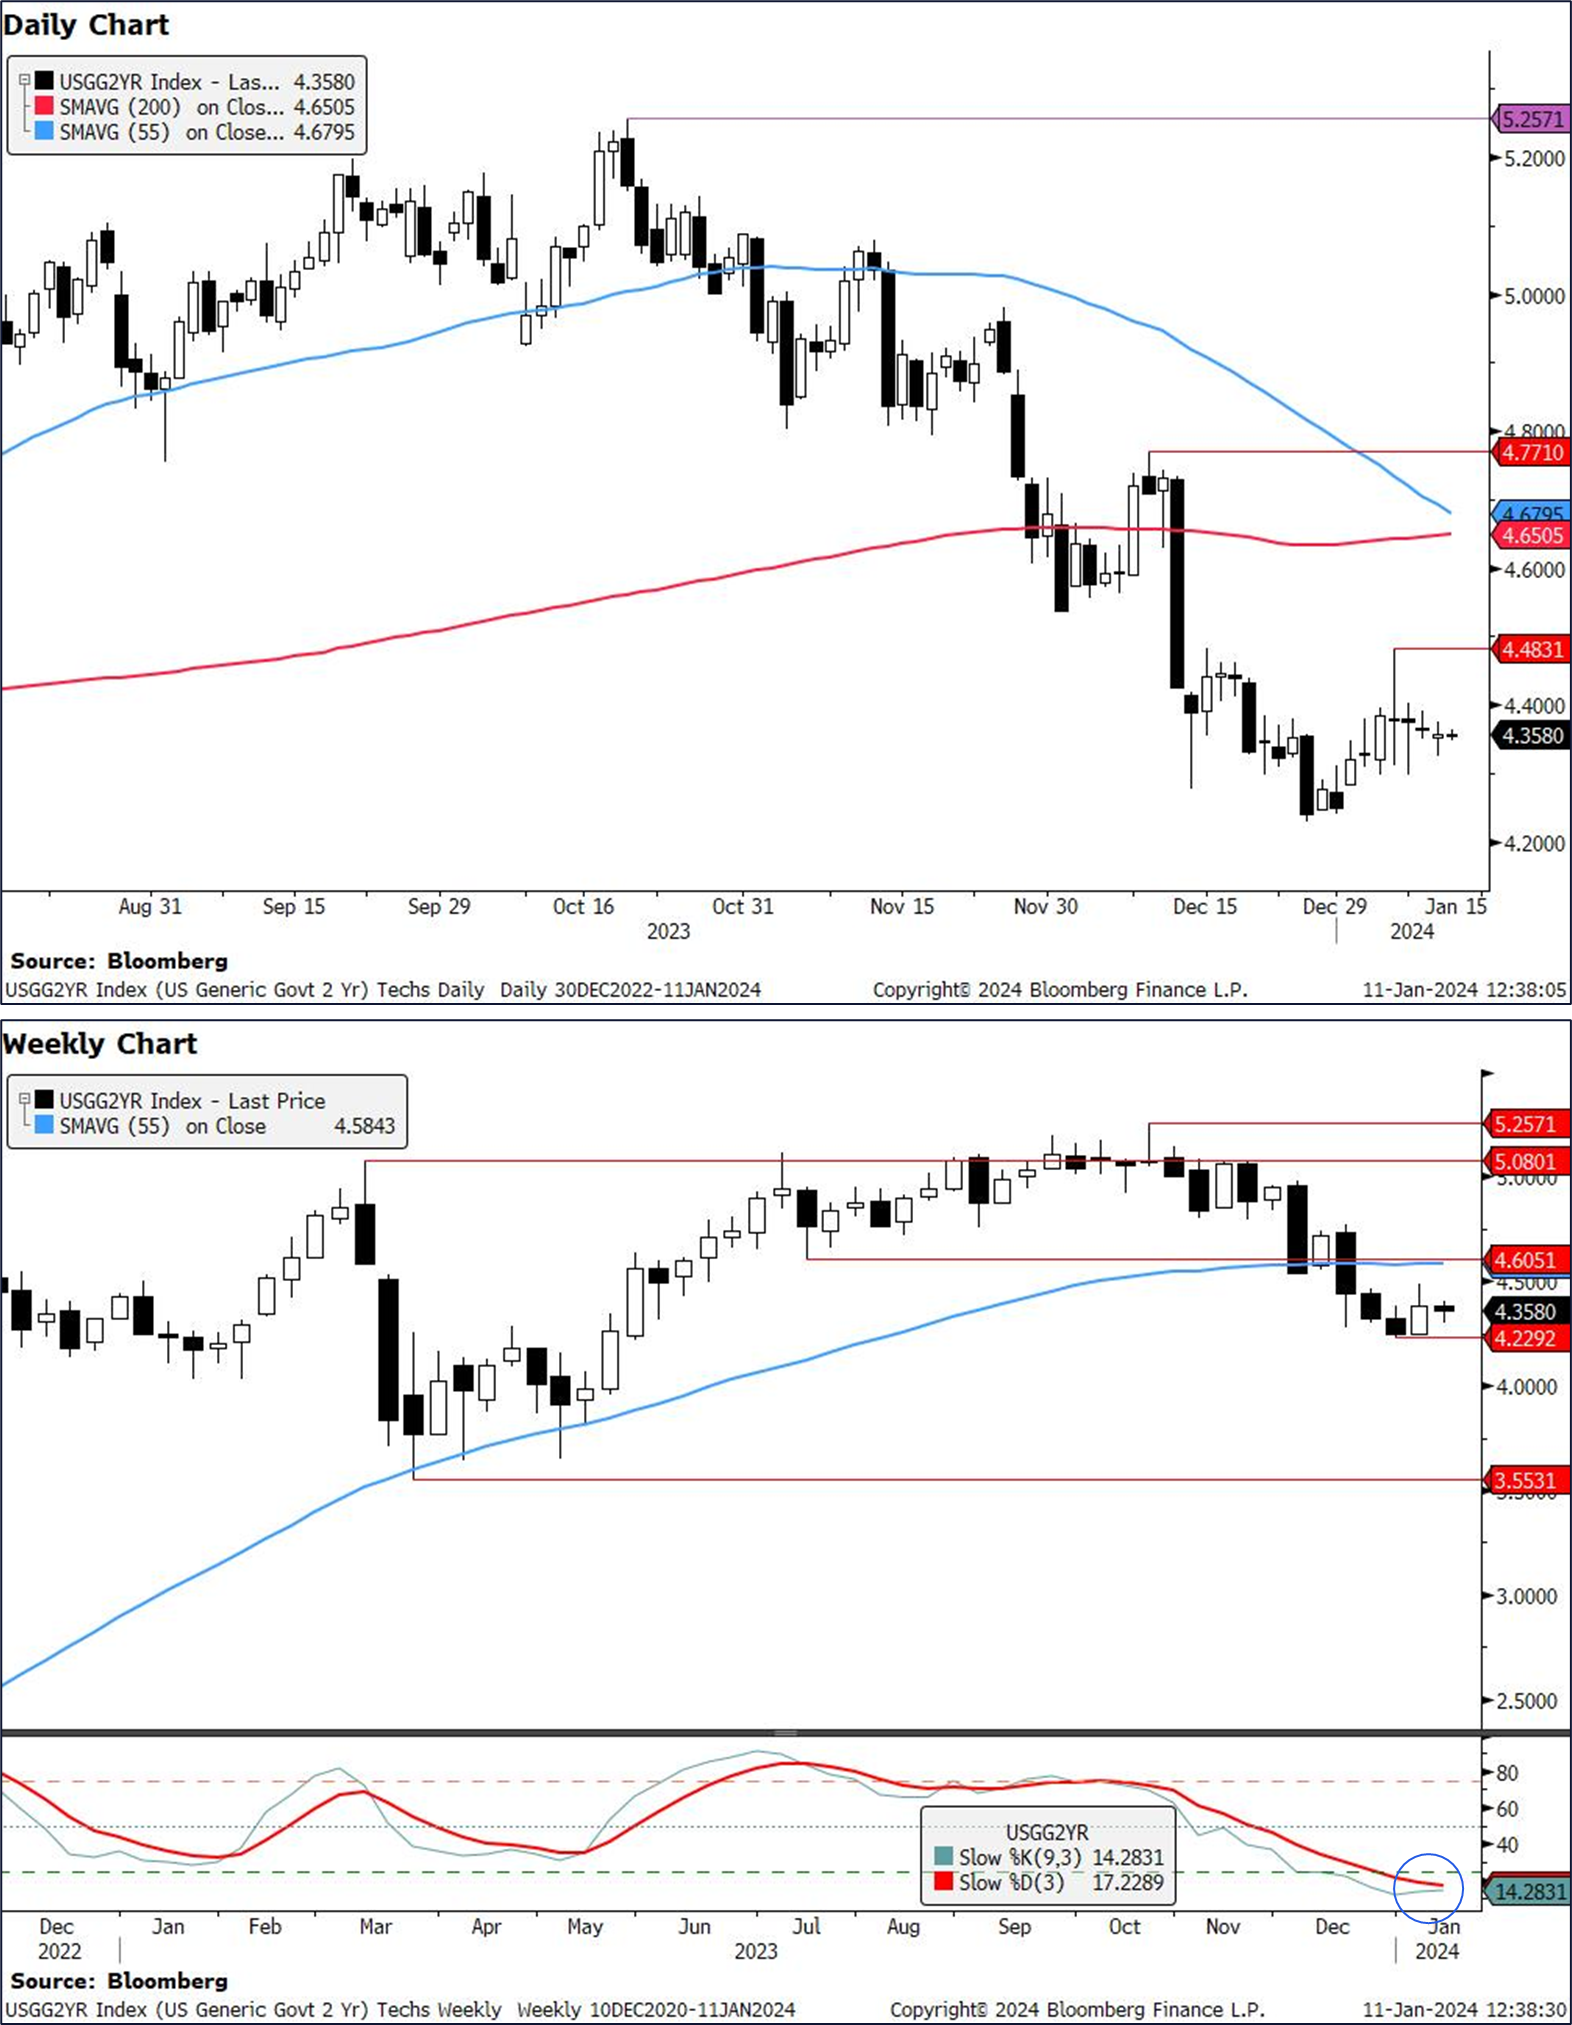
… this 4th tail in a row had yields back up OVER the magical 4.00% and I’d like to tell you what the crystal ball then says about this afternoons 30yr auction but I can’t. I know who may be able to … this mornings CPI release and with that in mind, price action and MOMENTUM — a visual to keep in mind …
… TLINE BREAK but momentum has flipped and this ahead of CPI and supply. I’d THINK higher yields as a concession not necessarily a bad thing but there’s lots of moving parts here (as always) and likely better to check back AFTER dust settles.
… here is a snapshot OF USTs (BID ahead of CPI and supply) as of 712a:
… HEREis what this shop says be behind the price action overnight…
… WHILE YOU SLEPT Treasuries are marginally higher with the curve a touch flatter as the hijack of an oil tanker off Oman had led to a mild risk-off tone ahead of CPI and claims this morning. DXY is modestly lower (-0.1%) while front WTI futures are higher (+2%). Asian stocks saw Japanese stocks (NKY +1.8%) pace gains in the region, EU and UK share markets are mixed/higher while ES futures are showing +0.1% here at 6:55am. Our overnight US rates flows saw modest real$ buying in intermediates during Asian hours but that was about it. In London's AM hours the desk reported that Treasuries followed Bunds higher this warning with real$ buyers in 10's alongside continued interest for intermediates on ASW. Going the other way, fast$ sold the upticks in 10's throughout the session. Overnight Treasury volume was ~75% of average across the curve.
… and for some MORE of the news you can use » The Morning Hark - 11 Jan 2024 and IGMs Press Picks (who CONTINUES to be sportin’ that new, fresh look) in effort to to help weed thru the noise (some of which can be found over here at Finviz).
Moving from some of the news to some of THE VIEWS you might be able to use… here’s SOME of what Global Wall St is sayin’ …
ABNAmro: Global manufacturing PMI edges down, container tariffs up on Red Sea turmoil | Insights newsletter
Global manufacturing PMI drops further below neutral mark in December. Demand components still weaker than supply components. Despite rise of container tariffs, cost price components still well below 2021/22 peaks.
BMO Technicals: Going with post-CPI Move
Interesting setup technically for CPI once today's 10-year reopening is taken down. Along with the charts (more below and attached), the calendar is very empty in terms of data until month-end.
Only the release of the January refunding questionnaire on Friday at 12pm EST and retail sales on the 17th. This means there won't be much to stop whatever trend we get coming out of the inflation data (BBG consensus is 0.3% MoM for core, 'whisper' is a high 0.2%) can run.
Purely from a technical perspective, there's the risk of a bearish "cup and handle" in 10-year yields in the event a selloff follows the data a break of the bullish trendline in the handle (also close to the 200-day moving average), points to a challenge of 4.25%.
What if CPI brings in a bid? Momentum is curling (purple circle), and so a stochastics cross would be a tailwind for a rally back to what is left on an unfilled opening gap from 3.892% to 3.879%.
Asymmetry from positioning: Q4 earnings season gets fully under way this week with some Banks (JPM, C, WFC, BAC) reporting Friday. At this time last year, Q4 earnings drove a bullish start to 2023. Strong earnings were not the driver, as forecasts remained in a downgrade cycle through Q4 earnings. Instead, the rally was more a function of short positioning coming into earnings season.
SPX squeezed 6.2% higher through January 2023. The most-shorted names led the market up 25%. The consensus narrative was bearish heading into 2023, and that was reflected in positioning. In contrast, this year we see a much more bullish consensus. Our BNPP Equity Positioning indicator is at 89 versus just 15 this time last year (0 being most defensive, 100 maximum long, details on page 6). When we look at price action over the past two years, we see a large skew to earnings season performance subject to positioning ahead of earnings. On average, equities rallied -2.2% when our EPI is >50 heading into reporting season versus +6.2% when <50.
US index optionality looks low in absolute terms, fairly priced relative to recent realized and attractive for directional trades, particularly bullish trades. However, we do see opportunities to overwrite on some of the beneficiaries of the Q4 “dash for trash”. RTY stands out as a US index in which short-dated vol looks expensive relative to history. In the short term, RTY carry has been excellent, but we see scope for volatility to compress through earnings as spot momentum fades.
…US Positioning Indicator elevated headed into earnings
CA: This curve cycle is different (famous last words … it’s different this time?)
With the market expecting Fed easing to start as early as March, an inverted yield curve has puzzled many rates investors. One would think the curve would be steeper given almost six quarter-point cuts priced in for the year.
The key to the inversion puzzle lies in the macro backdrop of elevated policy rates to fight high inflation.
CPI will be next key data point this Thursday, with a continued bifurcation between YoY headline and core indexes.
… In the past six easing cycles, 2-10Y Treasury curve averaged about +10bp two months before the first rate cut, much steeper than the -36bp in 2-10Y today, if the Fed starts easing in March (see Figure 1). The shape of the curve currently suggests a March easing is too early or the curve has a lot of room to steepen…
CitiFX Techs - Make it or break it (ahead of CPI …)
3 charts as markets head into US CPI on Thursday.
S&P 500: US CPI could be a key catalyst for S&P 500, with moves making or breaking a constructive equities techs view…
DXY: Short term dollar upside remains likely after we posted a weekly morning star formation and we saw a weekly crossover in slow stochastics in oversold territory on the weekly chart…
US 2y yields: CPI could be the next major catalyst for US 2y yields. However, upside could be limited with decent resistance at 4.48%-4.50% (psychological level and Jan high). Beyond that, 55w MA at 4.58% is strong as well. Near term support is likely at 4.23% (Jan low)
Medium term, we continue to expect a drop towards the 200w MA (55-200w MA setup) and expect strong support at 3.55% (Mar 2023 low)
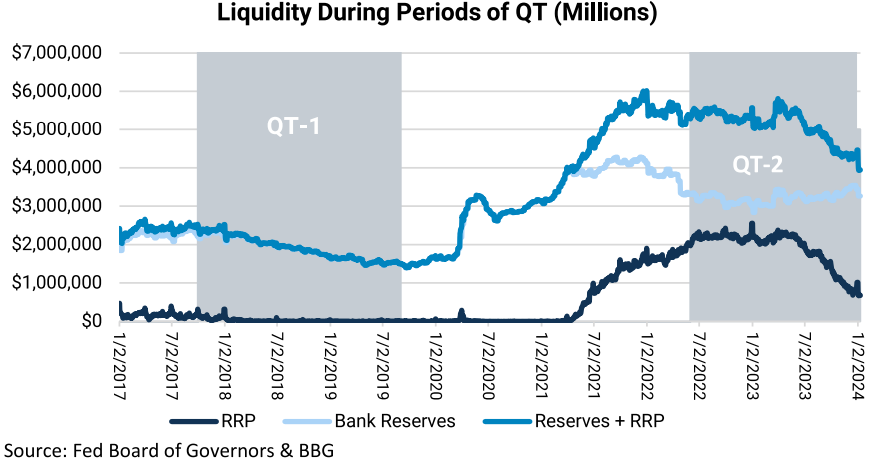
JEFF: Dusting Off the Fed's QT Playbook... Which Worked SO Well the Last Time (I can’t tell if they are joking or not…)
With the release of the FOMC Minutes last week, and Dallas Fed President Lorie Logan's comments over the weekend, the prospect of a tapering or end to Quantitative Tightening has come squarely into focus. We have been receiving a lot of questions about our views on the end of QT as a result, so we will discuss the reasoning behind our view in today's note. In summary, we expect:
■ A significant discussion of tapering the ongoing redemptions of Treasury and MBS securities from the SOMA portfolio. ■ Robust inter-meeting communication about tapering QT, reducing the pace of Treasury redemptions by as much as 50% to a $30-$40B/month pace. ■ Announcement at the March meeting that the tapered pace of QT for Treasuries will begin in April. The announcement will indicate that MBS rolloffs will continue at the current pace until prepays pick up, and there will be guidance that the Committee is closely monitoring the declining rate of participation in the ON RRP, any potential decline in bank reserves, and any increased participation in the Standing Repo Facility.
It is important to keep in mind that this tapering is aimed at managing risks around getting the balance sheet down as small as possible without causing any damage, rather than deliberate step-down to zero at some pre-determined date…
… As she points out in her most recent speech, reserves are no longer "super abundant", but they are still "more than ample". Most banks have reserves well in excess of their own individual LCLoR, but there are risks that individual banks can approach scarcity well before the system as a whole. So, it appears that Logan is arguing for slowing down the pace of QT very soon, so as to reduce the risk that these individual banks run into a scarcity situation that threatens the system overall. This would be a tapering of QT, but with an intent to continue on, presumably for quite a while.
This is a major break with the Fed's playbook for QT-2 vs QT-1. The approach with QT-1 was to transition the pace of rolloffs to a full stop as bank reserves approached a level that was just above the LCLoR, the so-called "buffer". For QT-2, the Fed can take a much more gradual approach, slowing the pace of roll-offs earlier, and allowing more time to collect data in determining how close reserve balances are to the LCLoR.
President Logan may have an uphill battle ahead of her to gain more traction with her colleagues on tapering QT roll-offs because it is hard to tell if reserves are approaching the LCLoR. Bank reserves held by the Fed are relatively little changed since the beginning of QT-2 on June 1, 2022, now sitting at $3.267T vs $3.322T, despite $1.017T in total Treasuries and $275.7B MBS having rolled off of the balance sheet over this time. The bigger impact of QT-2 has been on the participation in the Overnight Reverse Repo facility (ON RRP), which saw participation peak at $2.554T and is now currently down to about $675B.
The impact of QT-2 so far has mostly been limited to a shift in money market mutual fund cash out of the ON RRP and into bills. QT increases Treasuries financing needs as they borrow from the public to fund the redemption of the Fed's holdings …
… Assuming there is some good inter-meeting communication, there is no reason the Fed couldn't announce a tapering of QT in March, with the new pace to begin in April. We think that reducing the pace of Treasury rolloffs to $30B-$40/month from $60B makes sense. For the time being, the Fed probably does not need to worry about the pace of MBS rolloffs since they haven't come close to hitting their monthly target since QT-2 began, and the connection to bank reserves is less direct than it is for their Treasury holdings. If continued declines in inflation along with expectations for rate cuts lead to lower mortgage rates and an increase in refis/prepays, then the Fed could consider a tapering of MBS later in the year as well.
… President Logan introduced an additional argument for slowing the pace of runoff beyond just reducing the risk of accidentally overshooting, namely that a slower pace will allow more time to smooth the distribution of reserves across banks. Runoff is moving at twice last cycle’s pace and the distribution of reserves is more uneven this cycle, so the FOMC probably sees a higher risk of dysfunction in money markets as its balance sheet shrinks. By slowing the pace of runoff, the FOMC can ensure that banks who need reserves are likely to get them in an orderly way, reducing the risk that market dysfunction forces the FOMC to stop runoff early, all else equal.
We continue to expect the FOMC to end balance sheet runoff in 2025Q1, and we expect the stopping point to be determined by the aggregate level of reserves rather than their distribution. We expect the FOMC to stop runoff when reserves go from “abundant” to “ample” in aggregate—that is, when changes in the supply of reserves have a real but modest effect on short-term rates. So far, key short-term rates are still well below the interest on reserve balances (IORB) rate on most days and the fed funds rate remains insensitive to changes in reserves, suggesting that reserves remain abundant.
While we expect the uneven distribution of reserves to inform the FOMC’s decision to taper and not the ultimate stopping point for balance sheet runoff, President Logan’s comments raise the risk that the FOMC will be more conservative and stop runoff while reserves are still clearly “abundant.”
We continue to expect the Fed’s remaining balance sheet runoff to have modest effects on interest rates, broader financial conditions, growth, and inflation— much less than the impact of interest rate hikes this cycle. We likewise do not expect the earlier slowdown in the pace of runoff to have meaningful effects on the economy
UBS (Donovan): Inflation—does spin or substance matter more? (yes)
US December consumer price inflation is due. Are investors are focused on the Federal Reserve’s policy response, or economic realities? If the former, then headline numbers and Fed comments likely matter the most (the Powell Fed is more about spin than substance). If the latter, then the headlines matter less than the signals buried in the detail.
Middle-income homeowning US households face lower inflation than the headlines suggest because the fictitious owners’ equivalent rent is still distorting the data higher. This helps account for consumer resilience—the US middle class has more spending power than the data suggests. Resistance to profit-led inflation should subdue parts of the data, and used cars, shelter, and airfares add volatility…
Wells Fargo: Consumer Credit Rises in November as Card Spending Surges (ruh roh RelRoy…)
Summary Consumers continued to reach for their credit cards in November, pushing outstanding consumer credit north of $5 trillion. The highest interest rates in decades make the cost of carrying this debt even higher for the consumer and is leading to some financial stress.
… And from Global Wall Street inbox TO the WWW,
Apollo: This Is Not a Soft Landing (no sir, it is not and so then … ‘bout rate CUTS?)
There is an ongoing debate about how core PCE inflation could come down from 5.5% to 3.2% without a slowdown in the economy, but this debate ignores that the cyclical components of GDP, including housing, have slowed sharply as a result of Fed hikes, and the non-cyclical components have continued to see strong growth in particular with strong post-Covid tailwinds to restaurants, hotels, and airlines.
The cyclical components of GDP are the interest rate-sensitive components such as housing, capex, and durable goods, and these parts of the economy slowed significantly when the Fed started raising rates, see chart below.
Put differently, it is misleading to say that Fed hikes have not had any negative impact on the economy. Fed hikes had a very negative effect on the interest rate-sensitive parts of the economy, most notably housing, and the result was a decline in housing inflation. With housing having a 40% weight in the CPI basket, the result was a decline in headline and core inflation for both CPI and PCE.
So why did the economy not slow down more, and why did Fed hikes not result in a rise in unemployment? There are two reasons.
First, the post-Covid economy saw surprising strength in the non-cyclical components of the economy, such as eating at restaurants, staying at hotels, and flying on airplanes, etc. Consumers wanted to travel, go to concerts and sporting events after Covid, and this has kept consumer spending strong.
Second, financial conditions eased significantly following SVB, and this boosted GDP growth to 4.9% in the third quarter of 2023. Similarly, the rally in the stock market, credit markets, and Treasury markets since October and after the Fed pivot in December have also eased financial conditions significantly, likely boosting the cyclical components of GDP over the coming months.
As the chart below shows, the bottom line is that the non-cyclical components continue to grow steadily because of post-Covid strong demand for consumer services, and the cyclical components are rebounding because of easier financial conditions.
The likely scenario is that the economy will reaccelerate over the coming months, which will put renewed upward pressure on inflation and, hence, bring back a more hawkish Fed.
In short, the Fed is not done fighting inflation, and, as a result, it is too early to argue that this is a soft landing because both the cyclical and non-cyclical components of GDP are likely to be solid over the coming months, see again the chart below.
Bloomberg: Fed Needs to Tame Rampant Bond Volatility (um … no it doesn’t)
Swings in the value of US Treasuries threaten to make debt sales trickier.
The Federal Reserve won’t want a repeat of 2023 where 10-year Treasury yields soared from a low of 3.3% in April to peak at 5% in October — only to plummet back to 3.8% by year-end. That’s too much volatility for the world's interest-rate benchmark — particularly when there's a record amount of government debt to sell.
A steady-as-we-go two-pronged plan is carefully being engineered by Fed officials, of reversing economic tightening via conventional monetary policy in conjunction with measures to shrink the swollen balance sheet. It helps that dissent within the Federal Open Market Committee has been notably absent under the leadership of Chair Jerome Powell. With inflation down to 3.1%, a third of its mid-2022 peak, the central bank hopes to achieve a soft landing for the economy.This should allow it to steadily bring its official Fed funds rates down this year from its current upper bound of 5.5% — but reducing the bond market turbulence that accompanied the increase in borrowing costs is in everyone's interests. Average volatility has doubled in the past two years compared with the three prior years, and remains elevated.
Bloomberg: Caveat emptor — Bitcoin is out of the box for good (Authers OpED and IF you can get beyond all the BITC stuff, there IS a section on the immculate disinflation expected later on this morning … )
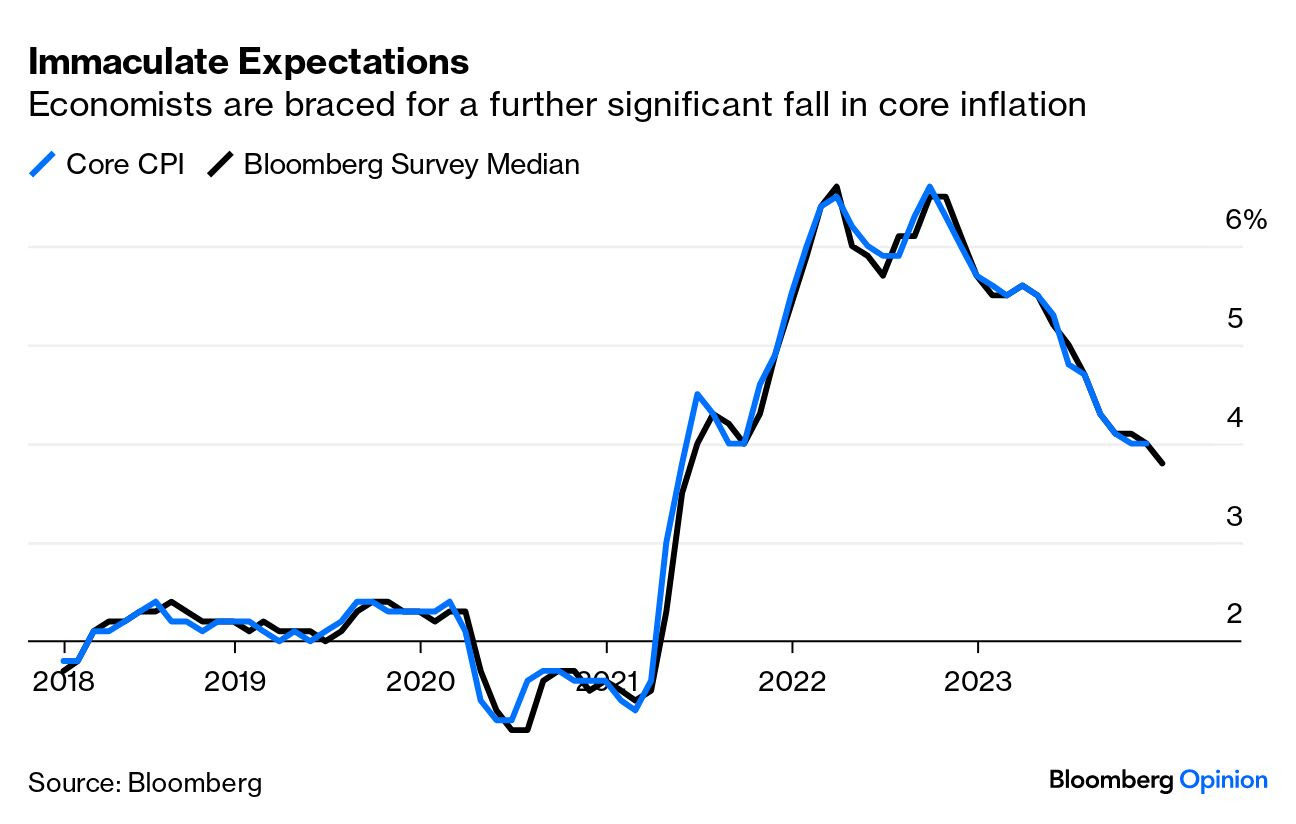
…Immaculate? Stand by for the concluding US inflation report for 2023, and just possibly the latest step in the road toward a potential “immaculate disinflation” — in which inflation would come back down to target without major job losses. Such an outcome would be great, and its chances have improved over the last few months. If it happens, then the central bank can cut rates, which is what many desperately want to see.
How good are the chances really? Expectations for the December inflation report, due Thursday morning in the US, are skewed toward the downside, with the median prediction of economists polled by Bloomberg News expecting core CPI to log a fall and drop below 4%:
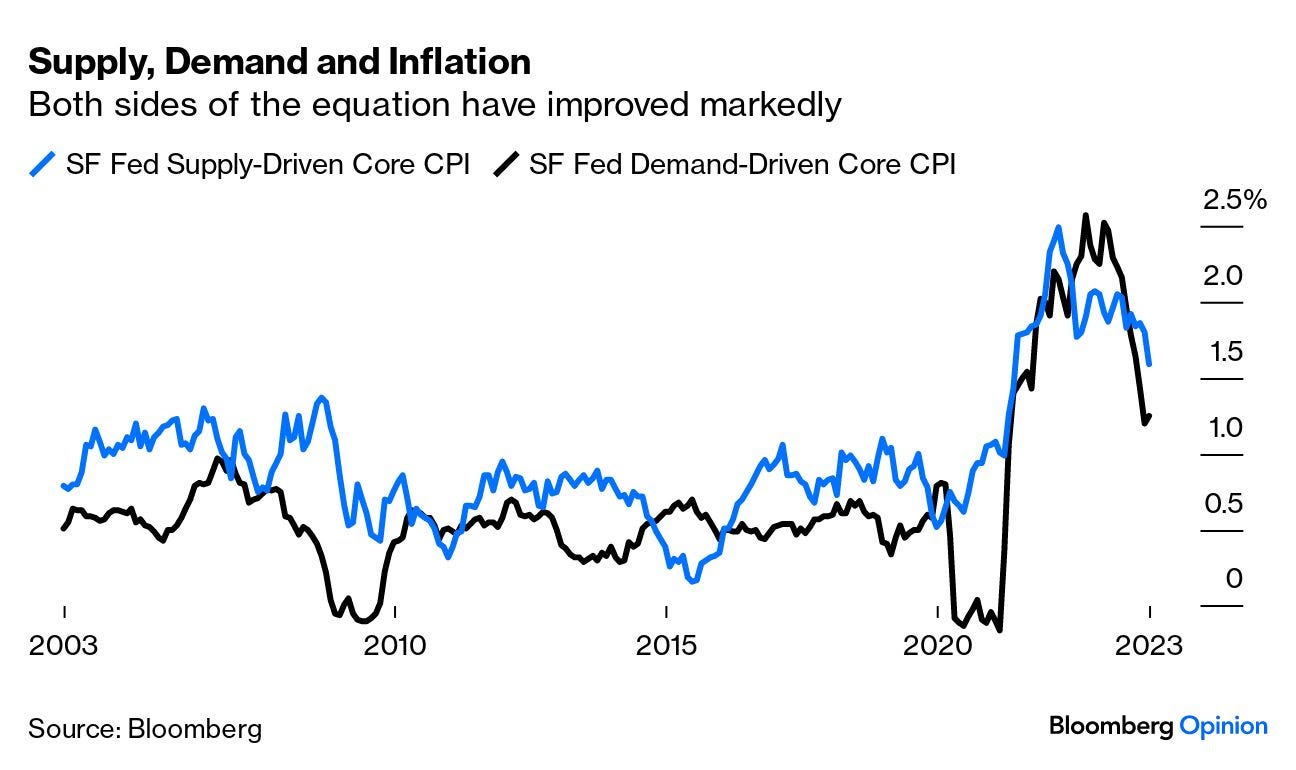
That data will tell us a lot, as it always does. For now, let’s check on what might divert disinflation off its immaculate course. If we divide inflation into price rises driven by rising demand and those caused by tighter supply, indexes kept by the San Francisco Federal Reserve show that both are in a very promising decline. These measures aim to show the amount of core CPI driven by demand and by supply. Both are somewhat higher than the norm for the decade before the pandemic, but both are falling swiftly:
Supply-driven price rises, moved by post-pandemic bottlenecks, peaked in 2022. Demand-driven prices, which tanked during lockdown and rebounded dramatically during reopening, have seen even greater disinflation. What are the risks to continuing falls?
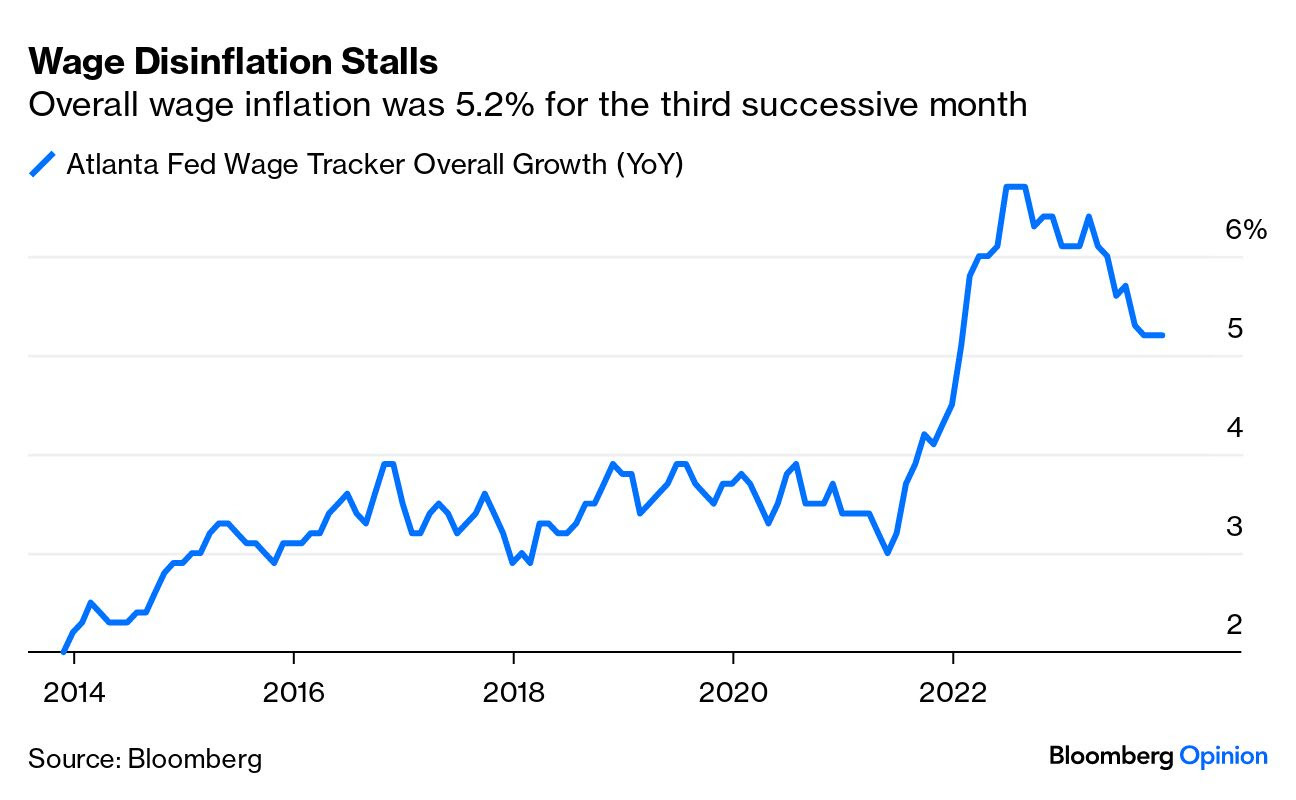
Demand If people have more to spend, they will likely bid prices up. Wednesday saw the publication of the Atlanta Fed’s wage tracker numbers, which follow rises in pay using census data. Here, the good news is that wage rises are higher than they were during the slow economy that followed the 2008 Global Financial Crisis. That should be good for social cohesion. The bad news for central bankers is that disinflation has stalled, with overall wage growth sticking at 5.2% for the third successive month:
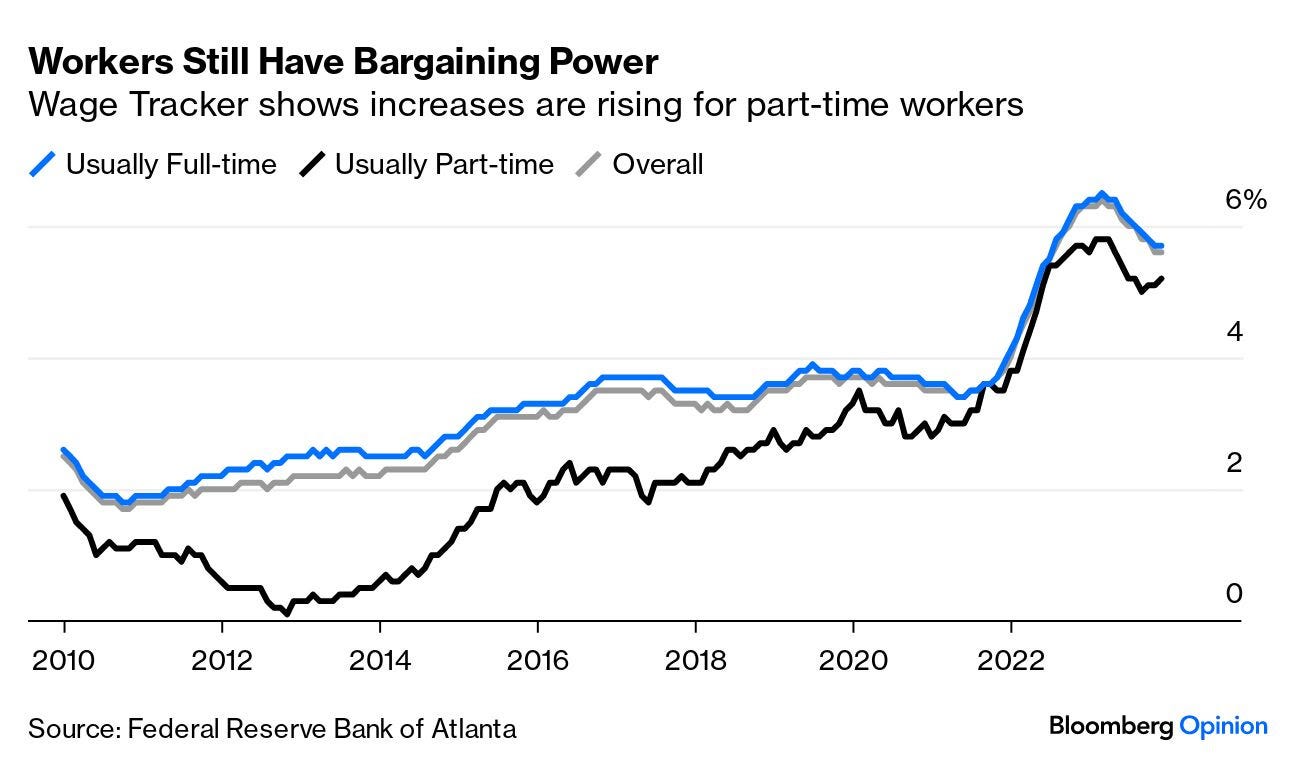
The Atlanta Fed’s website is a great resource for getting a granular view of the US labor market. One data point that is a tad concerning covers the difference between part-time workers, who had a really terrible deal in the last data, with full-timers. Part-time workers closed the gap in wage rises in 2022 before falling back a little — and their raises are now moving upward again. That is particularly important for prices charged by the services sector, which makes wide use of part-timers:
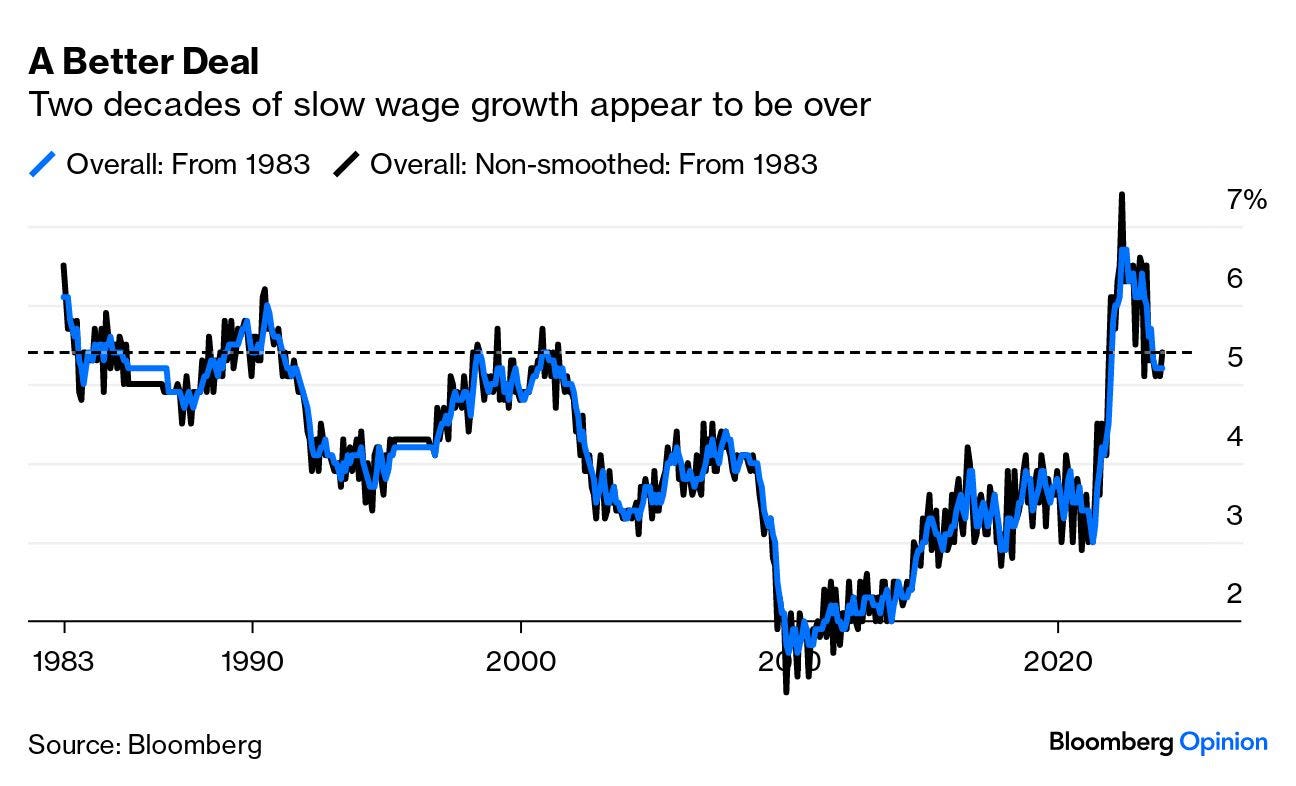
To be clear, this in all probability makes for a happier and more equal society; but it could also mean service prices go up. Wage growth is almost certainly too high for the Fed’s comfort, given the great emphasis it’s put on the labor market. Disinflation, and lower rates, will surely require lower wage rises than this. Wage inflation has stalled at exactly the level it reached during the boom of the late 1990s. This is the full dataset from the Atlanta Fed, on both a smoothed and non-smoothed basis:
Bloomberg: The Bond Market Rally Is Overlooking a Soaring $2 Trillion Debt Problem (not a HERE / NOW problem but one that’s been litigated in elections and the press over the course of ones career … eventually there WILL be a day of reckoning …)
Investors are ignoring the cloud of rising deficits around the world…
AND rate cut ‘istas chatting amongst themselves be like …


Hard to see the FED moving in either direction too quickly....Steady as she goes.....
Thanks for all the Information...
Looks like your CPI forecast was Right On the Money....