Momentum DOES appear oversold AND CROSSING (bullishly) and while the Fed is likely to continue raising rates, one must wonder if its one and DONE or simply nearer the end of the cycle … whatever your view, you’ll get the chance to express it at this afternoons 3yr auction…get those bids in early and often.
In OTHER news, yesterday, the FRBNY released it’s CONSUMER SURVEYand, well, the good news …
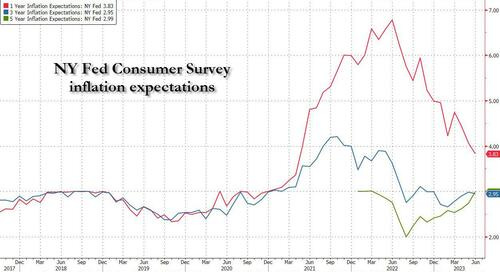
ZH: Near-Term Inflation Expectations Tumble To 2 Year Low As Longer-Term Price Outlook Unexpectedly Jumps
… According to the NY Fed, near-term inflation expectations - those for the one-year horizon and which traditionally just follow the latest move in the price of gasoline - dropped again to 3.83% in June from May's 4.07%, the third straight decline - one which was broad-based across all demographic groups - and the lowest reading since April 2021. The measure has now fallen by 3 percentage points from its series high in June 2022. This drop, however, was offset by a virtually flat inflation expectation in the three-year-ahead horizon (which dipped to 2.95% from 2.98%) and a surprise increase in the five year inflation expectations, which rose to 2.95% from 2.72% in May, the highest print since March 2022.
… is also the bad news? Inflation expectations drop in the s/t but in the long-run … right, we’re all dead SO who cares?
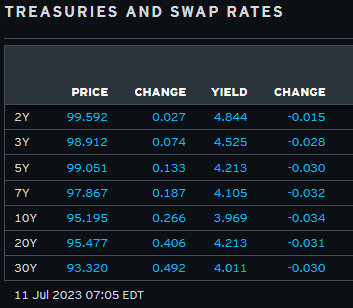
… here is a snapshot OF USTs as of 705a:
… HEREis what this shop says be behind the price action overnight…
… WHILE YOU SLEPT Treasuries are modestly higher again this morning after some block futures buying during Asian hours and after some high demand was seen in a EU 30y syndication tap (ITC). DXY is lower (-0.3%) while front WTI futures are modestly higher (+0.4%). Asian stocks were mostly higher after gains here yesterday, EU and UK share markets are mixed/higher (SX5E +0.5%) while ES futures are showing +0.1% here at 6:50am. Our overnight US rates flows saw a firm trade in Treasuries after ~400k in total block buys during their hours. In London the desk reported that the rally back below 4% in 10's sparked some on-balance buying (mostly out the curve) this morning- but on a smaller scale ahead of CPI tomorrow. With NFIB already printing, all that lies ahead for us is the 1pm 3yr Tsy auction. Overnight Treasury volume was ~90% of average overall with 7yrs (145%) seeing some relatively elevated turnover overnight- perhaps linked to the earlier block flow.
… 5yr (TIPS) real yields, daily: This picture was in last night's chart pack and it's a set-up that strongly warns that last week's breakout to new move highs for 5y reals may not be sustainable because of the multi-month sell-off that preceded it. Simply, the risk of a false bearish breakout looks high right now and we'll be waiting to see if 5yr real rates close back below 1.994 this Friday, as we suspect they might. Such a close would confirm a 'false breakout.'
… and for some MORE of the news you can use » IGMs Press Picks for today (11 July) to help weed thru the noise (some of which can be found over here at Finviz).
From some of the news to some of THE VIEWS you might be able to use… here’s what Global Wall St is sayin’ …
First up since stocks VS bonds so topical (see this weekends thoughts HERE) I’ll begin with this note and visual from an old storied operation in operation for nearly 100yrs
Our bond/stock asset allocation model indicates that bonds are the asset class currently offering the most value, as interest rates have risen and stocks have recovered some of the ground they lost last year. But stocks are not yet seriously overvalued. Our model takes into account current levels and forecasts of short- and long-term government and corporate fixed-income yields, inflation, stock prices, GDP, and corporate earnings, among other factors. The model output is expressed in terms of standard deviations to the mean, or sigma. The mean reading from the model, going back to 1960, is a modest premium for stocks of 0.15 sigma, with a standard deviation of 1.0. The current valuation level is a 0.70 sigma premium for stocks, which is inside the normal range but up from the 0.50 sigma premium at the beginning of the year. Other measures also show reasonable valuations for stocks. The current forward P/E ratio for the S&P 500 is 17, which is within the normal range of 10-21 and down from 22 a year ago. And the current S&P 500 dividend yield of 1.6%, while below the historical average of 2.9%, is up from an ultralow 1.2% as recently as 2021. Based on the current valuation levels, as well as our interest rate and earnings forecasts, we have called for a recovery in stock prices in 2023 from bear-market lows and are now boosting our year-end S&P 500 target to 4,600. Our current recommended Asset Allocation Model for Moderate accounts is 67% Growth assets, including 65% equities and 2% alternatives; and 33% Fixed Income, with a focus on opportunistic segments of the bond market.
I’ll come back to the idea of stocks OR bonds in a moment but in as far as HOW one pays for either (or both) … there are savings and investments and any one time you can lower your savings to spend OR invest, right? Ok, maybe it’s NOT a binary choice BUT you try and segue from stocks/bonds TO this
Prior to 2008, when the Federal Reserve ran a “scarce reserve” monetary policy, just about every bank in the US had a federal funds trading desk. These trading desks lent and borrowed federal funds (reserves) amongst each other.
In other words, there was an active marketplace that set the federal funds rate. Yes, the Fed could guide the overnight rate by adding or subtracting reserves. But this system meant there was a direct link between the money supply and interest rates.
Since the financial panic of 2008, and the introduction of Quantitative Easing, the Fed has flooded the system with reserves. Reserves are so abundant that banks no longer borrow or lend them. The Fed pays banks to hold them. As you can imagine, the Fed would like to pay almost nothing to banks, as it did for nine out of the last fifteen years. Under the new system there is no direct link between interest rates and the money supply …
… We have been focused on the M2 measure of the money supply, which has dropped the most since the Great Depression. The US economy is still absorbing the massive money printing during COVID, but this is almost over. A decline in M2 should pull the economy into recession soon.
Apparently, investors aren’t worried about that because they think the Fed will cut rates. And we would not be surprised if 2024 brought more aggressive rate cuts than the market is currently pricing in. However, our model says that if the 10-year yield fell to 3.00% but profits fell 15%, the S&P 500 would have a fair value of just 3,800.
In other words, the Goldilocks future, where the Fed manages everything perfectly, is likely too optimistic. Some stock valuations have become too high in our opinion. More defensive strategies are appropriate at this juncture.
SO much talk of stocks and only mention of bonds … lets solve this with a visual
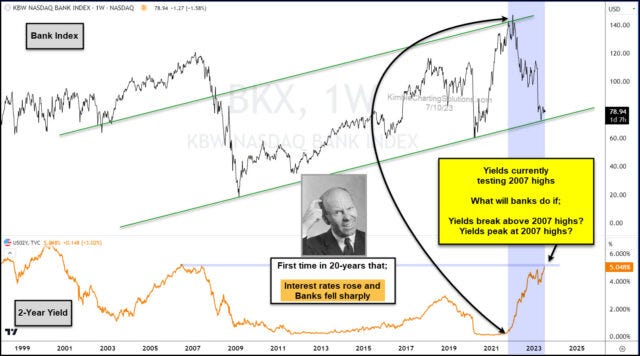
Kimble: If rates break out here, will banks continue to tank?
It’s always nice to see bank stocks leading the market higher… but it doesn’t always work out that way.
Which is why we always let the price action (and patterns) dictate our investment choices.
For most of my career, though, bank stocks have liked rising interest rates.
BUT for the past 2 years, interest rates have risen nearly 5 percent and the all-important
KBW Bank Index (for bank stocks) has declined nearly 50%.
I have not seen this in my 43-year career.
You can see this in today’s chart, where we compare the Bank Index to the 2-Year Treasury Bond Yield.
As you can see, the 2-year yield is testing its 2007 highs.
As this occurs, a couple of questions come to mind… what if interest rates peak here, what will banks do? What if rates breakout, what will banks do???
This dynamic is definitely worth watching. Add it to your trading radar… and stay tuned!
#GotBANKS? Perhaps there is more to that trade than the 2yy?
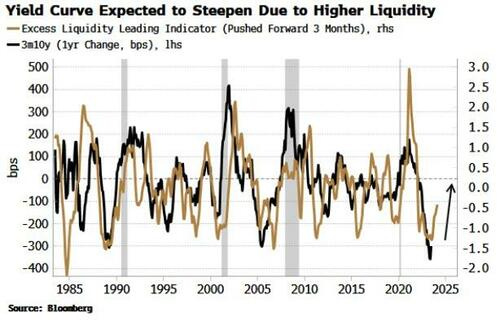
Bloomberg (via ZH): Steeper US Yield Curve Promises Less Restrictive Rates Authored by Simon White, Bloomberg macro strategist,
It’s early days, but there are tentative signs of a trend change in the yield curve.
The 2s10s curve has steepened ~25 bps in the last week. Other parts of the curve, such as 3m10y and 5s30s have also steepened.
There are indications this trend will continue. Excess liquidity has been rising and this points to further steepening.
More buoyant liquidity conditions likely mean a preference for riskier assets at the margin, i.e. stocks over bonds, as well as a preference for lower-duration bonds as the velocity of money rises.
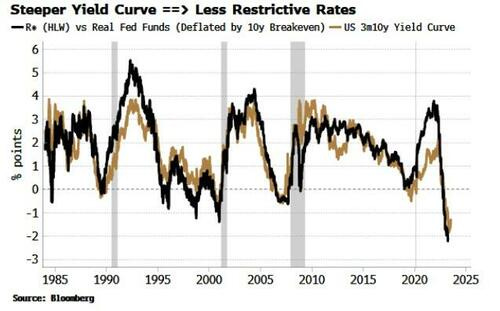
The Fed’s rate-hike campaign has left real rates very restrictive. A steepening yield curve would alleviate some of this restriction, further aiding risk assets.
Higher nominal rate expectations have driven longer-term yields which have in turn led the yield curve steeper. Term premium, in simplified terms the market’s expectation of higher inflation, has been steady. However, that could change later in the year if we see a re-acceleration in inflation.
Term premium would then likely rise, causing the curve to steepen in a way that would not be indicative of a positive environment for risk assets.
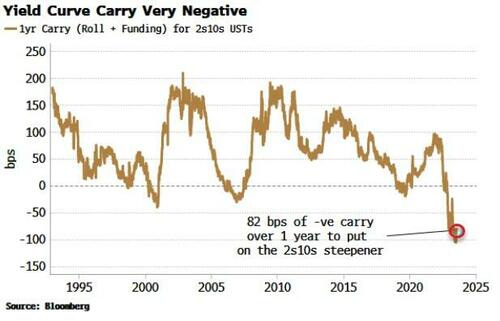
Nonetheless, in the shorter term, the yield curve faces some resistance from carry.
If we look at the total carry cost (roll + funding) for an investor putting on a 2s10s steepener in USTs one year forward, there is over 80 bps of negative carry on that position - the biggest it’s been for several decades (consistent with the extreme depth of the curve’s inversion).
CARRY is the mothers milk of MANY trades and investment portfolios and it would seem to me something the Fed could impact, even if only indirectly, depending upon what it does beyond July hike…
With that idea in mind, back TO another idea from Global Wall Street,
… Initiating short 2y UST: A short-lived rally in US rates after a below-consensus NFP print was likely due to elevated expectations set by strong ADP and ISM services employment, we argue. The rally has led to UST 2y dislocating from its MarFA™ Trading short-term fair value of 5.04% by about -2.3 z-scores (around -12bp).
US data continue to surprise to the upside, reinforcing the narrative of “avoiding weakening of economic fundamentals”. This is likely to lead to reduced market expectations of rate cuts, in our view.
We are therefore entering a short 2y UST position, targeting 5.04%.
This idea clearly NOT gonna work IF inflations TOP IS IN and ahead of tomorrows data, consider
Headline PCE inflation moderated to 3.8% year-over-year in May, while core PCE inflation remained firm at 4.6%. Updating our suite of statistical models, we find that our trend inflation measures remain mostly stable at historically elevated levels around 3.4-3.5%. Lack of convincing evidence that core inflation is on a clear downtrend, is a key reason that a majority of Fed officials see the need to raise rates at least two more times this year despite keeping rates steady at the June FOMC meeting (See School is not out for summer).
One thing to keep in mind IF — and thats a BIG IF — inflation has begun to top and is starting to subside, the longer end of the yield curve SHOULD then start to perk up.
The sharp rise in the equity/bond correlation and its negative effect on multi-asset portfolio performances in 2022 may not have been a Covid-19 related bug. Shifting macro trends suggest that a tighter correlation between the two primary asset classes could be a longer-lasting feature of the market environment in the decade ahead.
Focusing on fundamental macro drivers, a survey of academic and practitioners’ research suggests upside volatility in inflation and growth, the correlation between these variables as well as the central bank’s response to persistently elevated inflation are the major sources of upside risk in the equity/bond correlation.
This leads us to propose a portfolio of three liquid alternatives strategies across rates and commodities that offers, in our view, the best chance of mitigating the risk of higher equity-bond correlation for the purpose of Strategic Asset Allocation.
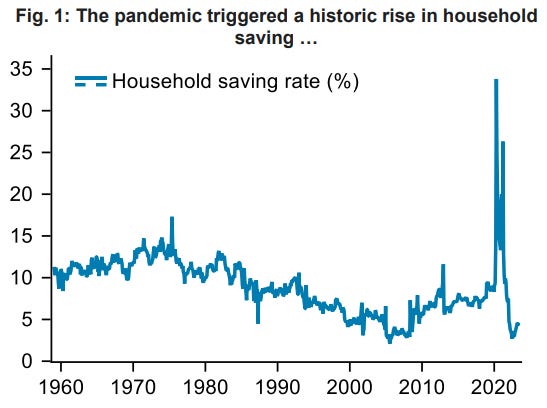
… MMT: A stillborn theory? Not so sure Rarely have we seen an economic theory tested out so quickly as with Stephanie Kelton’s book The Deficit Myth: Modern Monetary Theory and the Birth of the People’s Economy (2020). In response to the Covid-19 crisis, US fiscal and monetary policymakers supported the economy with massive stimulus packages, including direct payments to consumers - needless to say, with little regard for the deficit.
Only two years in and Jeanna Smialek at the New York Times asked, “Is this what winning looks like?” Persistent inflation and the challenges of fighting it may have revealed a more nuanced set of trade-offs for policymakers. Still, it is unclear whether the lessons of this MMT try-out will be fully distilled and accepted in the US, and more broadly elsewhere. Surveys indeed show that new generations expect more from the government.
… Capturing the central bank response Fig. 21 highlights how money market rates tend to trend while market pricing often suggests investors positioned (wrongly) for mean reversion. This has been true in both hiking and cutting cycles across advanced economies. A medium-term trend-following strategy can therefore bring valuable protection to a solution designed for hedging the equity-bond correlation. It will offer a proxy exposure to the volatility of money market rates (discount rate), capturing well larger moves compared to expectations. This is key to address the risk of central banks tightening for longer to tackle persistent inflationary pressures.
Our proposed solution leverages heavily on time series momentum, in different implementations and underlying, to gain protection against upside inflation volatility. We use it in an asymmetric fashion through the call delta-replication on breakeven rates or the Bloomberg Commodity index overlay, or in more traditional format through a trend-following strategy on money markets futures. The asynchronous trends in inflation and the central banks’ response function bring diversification and limit pain at major turning points. In addition, a commodity curve carry strategy limits the pro-cyclical nature embedded in breakeven rates while bringing a welcome source of carry in periods of range-bound markets. We highlight in Fig. 22 the hypothetical performance of a portfolio invested in the three strategies, using naïve risk parity (inverse volatility-weighting)