(USTs marginally bid, belly leads on ~avg volumes) while WE slept; global inversion; curve and 'Earl; JPOW speaks, is he worth listening to? 'PIVOT AHEAD'; assets and the 4 Fed phases;
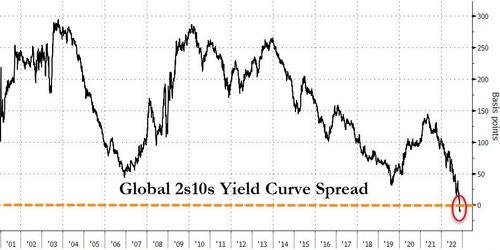
… Finally, for the firs time since at least 2000 (since Bloomberg's records began), the average yield on global sovereign debt maturing in 10 years or more has fallen below that of securities due in one-to-three years...
“Central bankers paralyzed by inflation fears will keep cash rates anchored in the restrictive zone for longer,” said Prashant Newnaha, a rates strategist at TD Securities Inc. in Singapore.
“This will be a key catalyst for ongoing curve flattening.”
The inversion of the yield curve is typically seen to herald a recession, as investors switch money to longer-term bonds due to pessimism over the economic outlook. Those fears are growing as policy makers around the world pledge further monetary tightening to tame rising consumer prices.
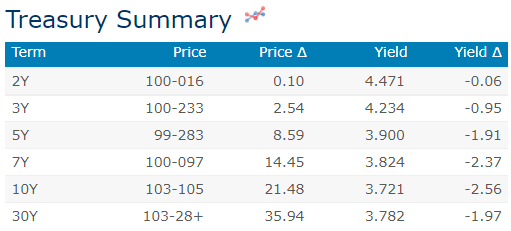
… here is a snapshot OF USTs as of 705a:
… HEREis what another shop says be behind the price action overnight…
Treasuries are modestly higher and the belly's outperforming (same as yesterday at this time) after some weaker than feared/expected inflation and manufacturing data that we've highlighted above. DXY is lower (-0.25%) and front WTI futures are higher (+2.25%). Asian stocks saw modest declines in Japan but strength elsewhere, EU and UK share markets are all higher (SX5E +0.65%) while ES futures are showing +0.25% here just after 7am. Our overnight US rates flows were again unavailable as we finished this up and overnight Treasury volume looked a hair below average overall with little average turnover seen in 7yrs (39%) but a lot seen in 3yrs (206%).
… The daily chart of the Treasury 2s5s curve has been highlighted in our publications over the past few days because A) the ~37bp flattening over the past 4 weeks has predictably left this curve appearing short-term 'oversold' and B) there is some evidence of a consolidation/base being built around the -60bp level for this curve.
But as we show in the weekly chart of 2s5s curve, the path of travel for this curve over the past 13 months has been one that looks like a curve that has been stepping down stairs that are increasingly steep, as we've drawn in. And with weekly momentum (circled, lower panel) at the kind of 'oversold' levels seen before the prior two steps/ consolidations unfolded earlier this year... we wonder aloud if another step (pause/range that refreshes positioning) is about to be built around this -60bp area, say.
And then looking at 2s5s on a more macro scale, the monthly chart of the Tsy 2s5s curve is shown next and there is ZERO evidence via long-term momentum (lower panel) that a sustainable rebound in 2s5s is even threatened yet. Yeah, 2s5s curve shows a long-term 'oversold' condition but momentum is also at levels seen in early 2018 before this curve proceeded to flatten further through 2018 and even well into 2019. The bottom line might therefore be that 2s5s curve may be in the earliest throes of working off a short and medium-term 'oversold' condition via a range trade around current levels- but all in the context of a still-viable macro flattening trend? One thought, anyway.
… and for some MORE of the news you can use » IGMs Press Picks for today (3 NOV) to help weed thru the noise (some of which can be found over here at Finviz).
From news to VIEWS you might be able to use (or which might simply amuse).
First up is THIS from UBSs Paul Donovan asking a decent question ahead of JPOWs speech later on today,
Federal Reserve Chair Powell is speaking, but past comments have done little other than chant “hike, hike, hike.” Powell has yet to explain the mechanism by which hiking rates is supposed to reduce inflation (which matters to analyzing when rates might peak). Today’s speech should signal a slowing of rate hikes, but Brainard and Williams of the Fed have already signalled that. …
In other words, NO?
Yesterday was the bond vol and stocks analog and today it is ‘Earl and the UST CURVE (via CSFB)
FX Compass: Flashing red
Since the release of below-expectations US Oct CPI data on 10 Nov, we switched tactically from our previous bullish stance against EUR, JPY and GBP to a neutral one. The good news now is that from here FX markets have the possibility of becoming livelier. For starters, indicators like a strongly inverted US yield curve and oil prices breaking to lows last seen in 2021 suggest that a genuine risk now lies ahead in terms of a major deterioration in the already-dire global growth outlook. In the first instance, by suppressing US yields this “global recession” fear can be said to be weighing on the USD. But longer term, the question will need to be asked about whether the ex-US space can really outperform the US in a downside global growth surprise environment that is not entirely US-centric.
On the slate today will be Fed chair Powell (1:30pm EST). With the market already largely pricing in only a 50bp rate hike at the 14 Dec FOMC, we suspect that if Powell were to manage to move the market, it might be through more hawkish commentary that leads to some more pricing of a higher terminal rate and a longer period of staying at those high levels. But beyond this speech, what really matters is data outcomes…
The MSCI All Countries World equity index is critically placed at its falling 200-day average, downtrend from the beginning of the year and 38.2% retracement of the 2022 fall which we look to ideally cap to add weight to our view current strength is still a bear market rally. The Credit House View is negative Developed Equities.
The S&P 500 rally is showing tentative signs of stalling at our recovery objective of its key long-term 200-day average and we continue to view strength as corrective and a bear market rally.
10yr US Bond Yields hold a small top and could be in the process of forming a larger top, seen confirmed below 3.56%...
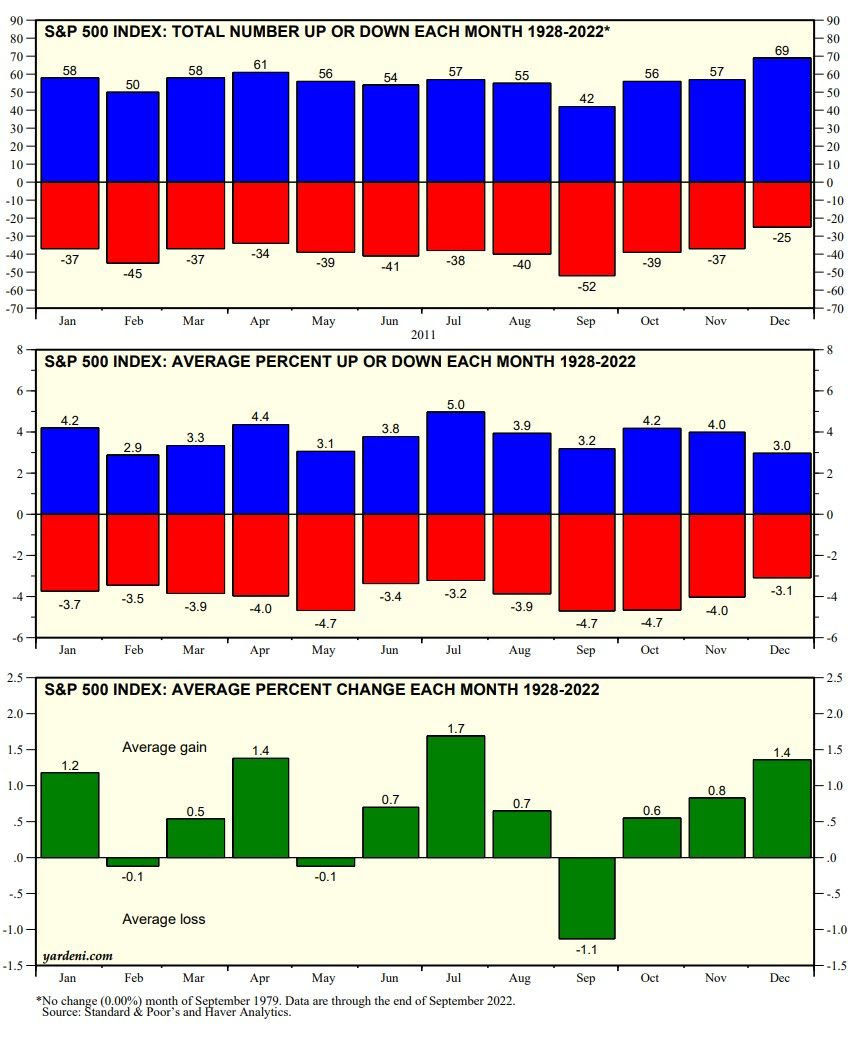
AND there’s more … And if your looking for charts of a different style, perhaps Dr. Ed VIGILANTE ‘deni’s latest look at S&P may be of interest,
Since 1928, Decembers have had more up months and fewer down months for the S&P 500 than any other month of the year (chart). The average change in the S&P 500 during Septembers has been -1.1%, the worst of the months. That was followed by October (0.6%), November (0.8%), and December (1.1%). Yes, Virginia, there is a Santa Claus rally.
… Technicians will be watching the S&P 500, which was back up to its 200-day moving average last week, but failed to take it out (chart). If Powell sounds less like the Grinch Who Stole Christmas tomorrow, then a breakout to the August 16 high of 4305 is likely by the end of the year.
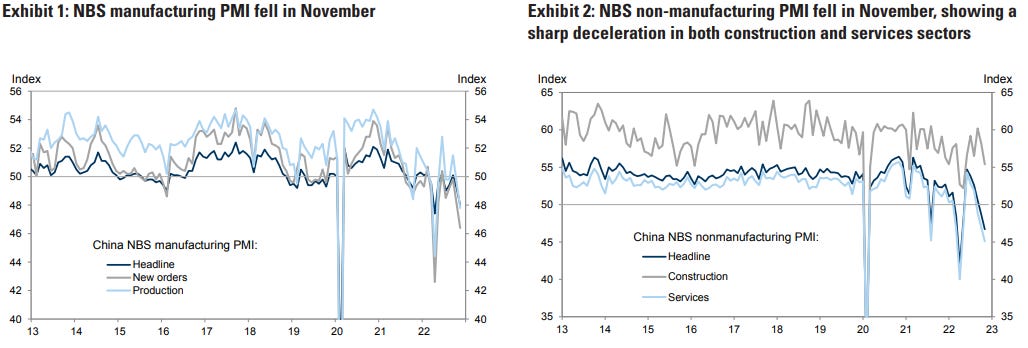
Moving along then TO Chinese data overnight — think nothing (lockdowns) without consequence — Goldilocks,
Bottom line: The NBS manufacturing PMI decreased to 48.0 in November from 49.2 in October on tightened Covid curbs and weak demand. In the NBS manufacturing PMI survey, both the output sub-index and the new orders sub-index dropped by roughly 2 points. The NBS non-manufacturing PMI fell to 46.7 in November from 48.7 in October, showing a sharp deceleration in both construction and services sectors.
Speaking of nothing without a consequence, turning back to our own shores, BBG on housing DEMAND hit by higher rates and after-effect from COVID,
Tighter credit conditions have led to widespread warnings of a housing market collapse -- particularly in the UK. Yet limited supply should keep prices supported even as activity declines, and that would have positive implications for home builders and banks. House building remains woefully below the Government’s ambition of 300,000 new homes per year, with supply of just 216,000 in 2020/21 on Covid lockdowns and supply-chain disruption. A bounce back is unlikely as long as credit remains tight and the outlook stays uncertain. Which, counter-intuitively, could keep house prices supported into next year. And while falling mortgage approval rates -- banks and building societies authorized 58,997 home loans in October, the fewest since June 2020 and down from 65,967 in September as seen in the chart by Liza Tetley -- seem to back up the bearish argument, it’s perhaps better seen as a signal of a lower-liquidity market than one heading for collapse.
Zig zagging right along through the morning here, jumping back across the pond to a note from a rather large French bank on what happens in Japan
We offer our preferred trade ideas across equities, FX and rates, to help investors navigate potential Bank of Japan scenarios for our economic base case and three additional risk cases, while taking advantage of the relative positioning in major Japanese assets.
On a relative basis, we find the long-end of rates market has priced in a BoJ policy change the most. FX reaction functions look more mixed, and equities appear least-prepared for a big policy shift.
As highlighted in Japan: Risk scenarios for BoJ monetary policy, dated 18 November, our economists expect the Bank of Japan to keep its policy unchanged in 2023 and 2024 amid a global economic downturn.
If the global economy beats our expectations for the coming year, we expect a modest BoJ policy tweak. However, if the Federal Reserve has to hike more aggressively than we anticipate, and the yen depreciates significantly further, we think the BoJ is unlikely to move.
If the BoJ does move, the market’s reaction is likely to depend largely on whether policymakers can convince participants that the normalisation is a one-off.
Moving from there to here and of hiking to cutting — fitting ahead of JPOW today — is THIS NOTE from rather large German bank
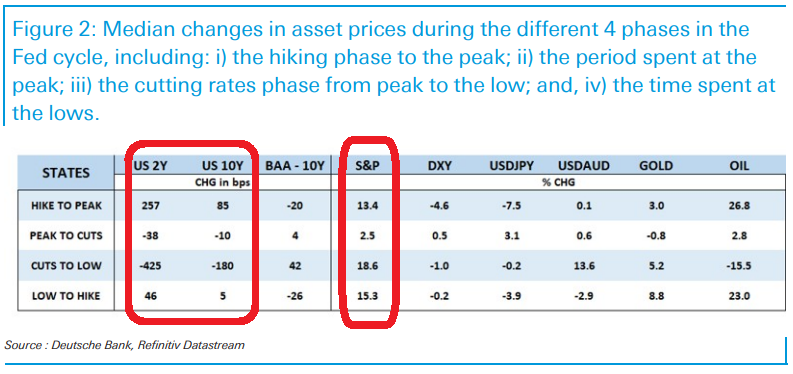
This piece includes tables highlighting the price action of major asset markets during four stages of Fed cycles that are divided into: i) the hiking cycle; ii) the plateau period, when rates are bumping along the top; iii) the rate cutting cycle; and, iv) when rates are bumping along the bottom of the rate cycle.
The median/average hiking cycle extends some two years, followed by a very brief (median 2 months) bumping around the peak, followed by an approximate two year period of rate cuts, and then a highly variable period where rates remain at the bottom
The nature of the current cycle has already had rapid rate hikes, possibly to be followed by a long period where rates remain at their peak - if many Fed officials are correct. At least for the last five decades, we have never had that kind of cycle. Rapid and larger rate hikes, have been quickly followed by rate cuts.
A "normal" (median) rate hiking cycle, typically includes surprising equity solidity and USD weakness. The cycle that best fits the current hiking experience of large increases in bond yields; equity underperformance; and, an unusually strong USD, is the Volcker tightenings of the early to mid-1980s.
It is then logical to think that a future playbook might resemble what happened to asset prices after the Volcker rate hikes. Unfortunately, Volcker rate hikes were followed quickly by large rate cuts, so if the Fed is correct that a long period of rates bumping along a plateau will follow the rate hikes, then the current asset cycle (after rates peak) is likely to also be somewhat different from the early 1980s Volcker cycles.
As a pattern, what we do see is that equities tend to register their big rebound after underperformance, only when the funds rate is cut, but the market would likely bring this forward earlier in this cycle, if there is any sense that the plateau period for rates is truncated. For the DXY, the experience after the Volcker hiking in 1980-81 vs 1983/84 are very different, but the overriding message is that after large DXY run-ups like 1983/84, the USD was very vulnerable to a large correction when the rate cutting cycle began. EM currencies typically have to wait longest to participate in USD slippage, in large part because even in a Fed rate cutting cycle, they are subject to credit pressures, weaker global growth and negative terms of trade.
Perhaps one of the most definitive conclusions is the message on volatility. Rate hikes and particularly cuts are associated with higher vol. Vol only tends to come off significantly when the funds rate is bumping along the bottom of its cycle. The recent period of widespread elevated vol can extend for a long time.
… Since the 1970s, the median pattern during a hiking cycle has included a 250bp+ increase in 2y yields; an 85bp yield increase in the 10y yield; surprising median increases in the S&P; and, a decline in the DXY, including large declines of the USD against the yen. While credit resilience has been a hallmark of this cycle this is not unusual, with credit spreads tending to widen more as the economy slows, even as the Fed cuts rates.
The very NEXT section includes a look at how / why THIS cycle is DIFFERENT
… In so much as the price action for the equities and the USD has been fundamentally different in this tightening phase than what has typically happened in the last 50 years, special attention is warranted as to i) what cycles does this exceptional price action best resemble? And ii) what price action followed in those cycles?
The cycle that best fit the large rises in 10y yields, equity underperformance and stronger USD, is the Volcker tightenings of the early to mid-1980s.
This is much as we would expect, since the latest Fed tightening also reflects a Fed that is doing its best to weigh down on a large inflation overshoot and recoup Fed credibility.
The logical action is then to think in terms of what happened to asset prices after the Volcker rate hikes. Unfortunately, Volcker rate hikes were followed by large rate cuts, so if the Fed is correct that a long period of rates remaining near their highs will follow the rate hikes, then asset cycles are likely to also be different from the early 1980s Volcker cycles. The more that rate cuts quickly follow rate hike the closer this cycle should resemble the Volcker early rate hiking cycles…
Ok then … from its different this time TO how / why it may not be — specifically in form of RECESSION — When, Not If (via BBG from ZH) … but what there’s more — from same / same (BBG via ZH)
Sometimes, just sometimes, the markets want to hear what they want to and discard what seems discordant -- even if policymakers keep hammering home the same message.
And so it was on Monday when Federal Reserve speakers let traders know that they were underestimating their intent on how far rates may climb in this cycle. Fed St. Louis President James Bullard, who has often been an accurate bellwether for where benchmark rates are headed, put it bluntly:
The Fed needs to get to the bottom end of the 5%-7% range;
Markets are underpricing the risk that the policy committee may be more aggressive; and
The Fed needs to move farther into restrictive territory
His New York counterpart, John Williams, followed up with remarks that the Fed will need to stick with a restrictive policy through next year, meaning a rate cut -- contrary to market expectations -- is unlikely before 2024. For good measure, he has revised up his rate trajectory since the September dot plot.
Despite those reminders, Treasuries seem to be singing from a different hymn sheet of late. Two-year yields have basically sleepwalked through November, while 10-year Treasuries have rallied on conviction that the economy is wilting. It’s the reaction at the front end of the curve that seems particularly jarring. Front-end Treasuries don’t seem to give one the impression that they are quite priced for a terminal rate that may be higher than 5%.
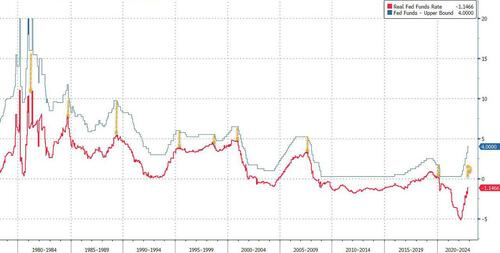
Analysis shows that the differential between front-end yields and the Fed’s benchmark has always been positive before the conclusion of monetary tightening. And the Fed hasn’t been able to conclude its tightening cycle before the real funds rates is significantly positive -- and at the moment we are at around -1%.
Given all the concerns about the strength of the economy, long-dated Treasuries may still be relatively better bid, but the front end could come for a re-assessment in the days to come.