Good morning … Shaking things up a bit this morning (slow news day) and leading off with a snippet of a Global Macro Commentary detailing yesterday.
UST sell-off continues amid more harmonious debt-limit talks, relief rally in regional US banks; NOK lags G10 peers, despite rise in Brent crude; BTPs outperform EGB peers, bull-flatten; Riksbank's Floden defers on June meeting action; USD/CNH rises above 7.00; US 10y at 3.564% (+3.0bp).
A more harmonious tone to debt-limit negotiations and a relief rally in regional US banks leads to a further sell-off in US duration; USTs bear-flatten as markets imply less near-term Fed easing.
Despite better risk appetite and a rise in Brent crude oil (+2.7%) near $77/bbl, NOK lags against both risk-sensitive and low-yielding currencies in the G10…
…USTs sold off for the fourth consecutive session as the curve bear-flattened. The two main factors that supported market pricing of less near-term Fed policy easing were the more harmonious tone regarding debt limit negotiations and a relief rally across regional US banks after a regional bank disclosed deposits rose by $2bn since March 31. OIS pricing for the June FOMC meeting sold off by ~2bp to ~5bp, to imply a ~20% probability of a 25bp rate hike. With a 5.9bp sell-off d/d, the recent rise in 5y UST yields extended to 3.58%, near the upper-end of the 3.40-3.60% trading range since the emergence of banking sector stresses.
At 1:00pm ET, the $15bn 20y UST auction stopped-out at 3.964%, 1bp through, with underlying auction statistics representative of the solid result. The allotment to indirect bidders rose to 70.6% (P: 68.7%), which more than offset a slightly lower allotment to direct bidders of 18.1% (P: 19.2%), and brought the allotment to primary dealers down to 11.3% (P: 12.0%). The bid-to-cover ratio came in at 2.56x, above the average for the past six new-issue auctions (2.46x). After a quick rally to 3.95% post-auction, 20y UST yields (+1.3bp d/d to 3.96%) resumed their broader trend higher during the NY session and temporarily traded above 3.98%…
AND so I’ll ask — WHO got 20s?
ZH: Solid 20Y Auction: First Stops Through Since Jan As Foreign Demand Jumps
And yet, increasing FOREIGN demand seems to be overwhelmed by HOPE for positive debt ceiling negotiations — USTs bear flattening implying LESS NEAR TERM FED EASING — and so, we’re near to breaking OUT of 20yy triangulating pattern, watching 4% and if/when THAT breaks, I’ll get out a new, thicker and even BETTER crayon with which to etch in some meaningless lines in effort to portray past / present and future expertise as IF I knew / know what I’m doing …
As we await whatever next turn of events to impact both front and longer-end of the curve, here is a snapshot OF USTs as of 705a:
… HEREis what this shop says be behind the price action overnight…
… WHILE YOU SLEPT Treasuries are modestly lower and the curve modestly steeper, following a risk-on, bear-steepening move in the Bund market this morning. Many EU countries are off today (Ascension Day), dampening liquidity. DXY is higher (+0.25%) while front WTI futures are little changed. Asian stocks were mostly higher after NY's strong gains yesterday, EU and UK share markets are all higher (SX5E +1.25%) and ES futures are showing +0.25% here at 7am. Our overnight US rates flows saw a firm trade in Treasuries during Asian hours amid demand for the front-end (TU block buy posted). During London's AM horse the tone changed to better selling from fast$ in 20yrs though real$ continues to grab T-Bills just past the assumed/feared X-date maturities. Overnight Treasury volume was decent (~115% of average) for a day with much of Europe out with 2yrs (151%) seeing some elevated average volume this morning….
… Another recent write-up from Citi's Tom Fitzpatrick of CitiFX Technicals also caught the eye and this morning we've attached his recent work this morning. The whole document deserves a read we believe but two pages stood out to us: 1) Page 21 shows how the cycle peaks and troughs in U-Michigan 1-year inflation expectations have been wrong about year-ahead inflation 100% of the time. Overestimating it at the highs, underestimating it at the lows. Recency bias indeed... 2) Page 22 looks at the sterling record of jobless claims as a leading indicator of trend changes in the unemployment rate. This is perhaps of little surprise but the average lead time over the past ~half-century between, say, claims coming off its move low and the unemployment rate rising off its low... has been 7 months. The move low in claims was ~7mo ago. Interesting, we thought…
… Treasury 2yrs, daily: The 4.25% range high remains an important support levels for 2yrs. We've said in recent weeks that a daily close above 4.25% in 2's would put a stain on our macro bull/steepening thesis where a close above 4.440% might force at least a nearer-term abandonment of it. That said, 2's of course have a way to go still and daily momentum (lower panel) is now edging into 'oversold' readings (>80 in the daily Stochs). So time may be running out on this corrective move toward support; we'll see.
… and for some MORE of the news you can use » IGMs Press Picks for today (18 MAY) to help weed thru the noise (some of which can be found over here at Finviz).
From some of the news to some of THE VIEWS you might be able to use… here’s what Global Wall St is sayin’ …
CSFB US Economy Notes: A debt ceiling deal still seems likely, but accident risk lingers
The soundbites from the May 16 meeting between President Biden and House Speaker McCarthy were mildly positive. McCarthy said that a lot of ground remained to be covered, but that a deal was possible by the end of the week. Biden assigned three senior staffers to negotiate with McCarthy and his representatives.
President Biden is also cutting his trip to Asia short to return to the US this Sunday.
We think the most likely scenario is that brinkmanship and tension rise as negotiations intensify, but that a deal happens before Treasury breaches the X-date. See here, here, and here for our previous analysis.
Nonetheless, we address below possibilities for scenarios in which a deal is delayed leading to Treasury having to halt payments on obligations other than Treasury securities or on both its securities and its other obligations. We can imagine Treasuries rallying if Treasury prioritizes servicing them and selling off if Treasury does not, but think the risk is equities fall in either case.
We think investors should also keep in mind that the broader macro backdrop is recent positive data surprises are likely to end soon. We argue in our latest Global Cycle Notes that industrial momentum, and growth more generally, are likely to slow sharply in the coming months. Peaks and slowing in industrial momentum have historically correlated with falls in risk appetite.
As we all continue ‘dealin with the ceilin’ a few more thoughts from a large British shop,
NatWEST - US Rates: Uncomfortably close The debt ceiling negotiations are reaching their 11th hour, while Treasury’s cash balance is falling fast and the headroom under the debt limit is almost depleted. The first week of June will be the most difficult one to pass - we still do not expect a default, but odds of a missed payment are non-negligible. We break down our forecast for the next weeks, our outlook on the TGA and a discuss potential political outcomes. Finally, we look at risks for market functioning and performances across asset classes based on different scenarios.
Timeline
With the debt ceiling front and center in the news, in this note we revisit our Treasury cash flow forecasts, discuss market mechanics, and our views around which financial assets might benefit from alternative scenarios. The timeline illustrated below (Chart 1) summarizes our expectations for when the high and low risk periods are with respect to the debt ceiling in the months ahead.
AND there’s more … In as far as MARKET IMPACT, well we all know there will be,
…winners and losers within asset classes
Market functioning.
Similar to previous debt ceiling episodes that stretch out, there is always the question of not just a non-payment of Treasuries, but also of market dysfunction. Main issues are delays of principal and coupon, which presume a one-day-at-a-time extension of the “operational maturity” (not legal maturity) of the Treasury security, as well as no-extension of the operational maturity.
SIFMA updated its discussion of scenarios for disruption in Treasury markets (see here). To summarize, Scenario 1 and 2 are the “least bad” options as Treasury can instruct Fedwire to extend the operational deadline of US Treasury securities one day at a time. During this period, there won’t be a change in the way securities are exchanged and they remain transferable, however, we still think it is likely that market participants change trade terms nevertheless (e.g., not accept those securities as collateral). Presumably, the payment of principal would be made to the legal holder as of the operational maturity date, while delayed coupon payments would be made to the legal holder as of the business day before the originally scheduled interest payment date. Our understanding is that delayed interest cannot be paid without Congressional action and we do not know if/what the compensation would look like. Scenario 3, where Treasury doesn’t extend the operational maturity date of the security is the worst case one as the Treasuries would be deemed non-transferable and trading would cease. In this case, repo and Treasury market functioning would be severely impacted, an outcome which is hard to imagine would remain contained.
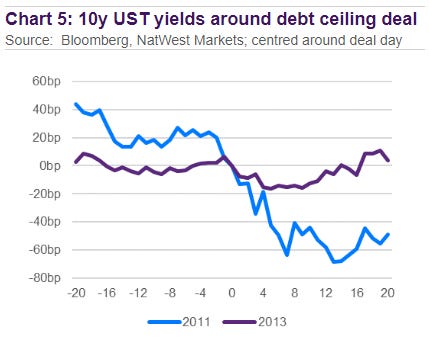
… Further out the curve, the answer is less clear cut. When the 2011 and 2013 debt ceiling crises were resolved and a deal was reached, Treasury yields went lower (Chart 5). We should note that the larger reaction was during 2011, but the net impact of the debt ceiling on US rates is hard to distinguish given risk-off rally due to the European crisis at the time. There is a case to be made for a risk-on recovery, but there is hardly anything for risk assets to recover from, while rates have traded sideways for the most part. Our base case is for a slight rally into and post a debt ceiling increase/suspension.
Sorry for all the dramatic notes and narratives BUT there’ll likely be MORE ink spilled as we move closer TO resolution — whenever it is — and then in the days / weeks right AFTER.
The more Global Wall Street writes, the more likely they’ll be able to take victory laps having ‘told us so’.
From the Swiss I’ll turn your attention to those who put NORTH in NORTH America,’
RBC: Five signs North America’s labour markets are starting to crack Labour markets have been far more resilient than expected in early 2023. Employment has surged higher in both the U.S. and Canada and the unemployment rate is at or around multi-decade lows. Still, while traditional ‘headline’ measures of labour markets are firm, signs of vulnerability are emerging under the surface. These, combined with the impact of aggressive interest rate hikes over the past year, suggest labour demand is softening.
1. The scramble to hire staff is losing momentum
2. Layoffs are edging higher 3. Fewer workers are testing their luck in the job market 4. “Temporary help services” employment has rolled over in the U.S.
Employment at temporary help agencies typically leads the labour market cycle. These are among the first jobs to be added during an upswing (it’s cheaper and less risky for businesses to hire more from temp agencies when demand is first rising) and they’re also the easiest jobs to cut when demand starts to slow. Temporary help services jobs have already declined in five of the last six months and are down over 5% from peak levels last year.
5. Job openings are also slumping in Canada
RBC seemingly out to prove a point — for whatever reason, I dunno — also reiterated,
Proof Point: Banking turmoil tightening already strained U.S. lending conditions
Fallout from the upheaval in U.S. regional banks has further squeezed borrowers south of the border.
This is a key concern for commercial real estate investors, since smaller U.S. banks are particularly active in this space.
American companies are less reliant on bank loans than they are on other market-based funding sources like bonds and equities.
But higher interest rates, wider spreads, and weaker equity markets have made those sources less attractive as well.
The bottom line: The U.S. Federal Reserve’s aggressive tightening cycle has made borrowing tougher across the board. This will hinder American businesses looking to invest in operations—at a time when labour shortages make these productivity-enhancing moves critical. We expect business investment to remain sluggish this year but look for a modest recovery in 2024.
On the former JOLTS related note, one of the popular kids asks / answers
The response rate to the Job Openings and Labor Turnover Survey (JOLTS) has plummeted almost 30pp since the start of the pandemic to just over 30%, raising questions about the survey’s reliability at a time when the focus on its monthly prints has never been greater…
… More importantly, a declining response rate can systematically bias the job vacancy estimates in one direction or the other if the probability of nonresponse is correlated with changes in job openings. And indeed, the BLS cites the increase in remote work as one of the key drivers of nonresponse. Combining company-level data on job openings and remote work status, we find that job openings have declined by 7pp more at companies with flexible working arrangements over the last year—consistent with an upward bias in today’s JOLTS job openings figures. Put another way, companies with flexible working arrangements and lower job openings tend to be underrepresented in the JOLTS sample. We believe this helps explain a modest share—roughly 200-300k—of the divergence between JOLTS and online job postings—which do not have monthly survey response issues—over the last year. These findings argue for currently treating JOLTS less like the “true” level of job openings and more like another series to be viewed in conjunction with a suite of job openings metrics.
Out of nowhere, regional banks in the US enjoyed their strongest rally since 2021 on Wednesday. And the good news that sparked the rise didn’t seem so remarkable: Western Alliance Bancorp, a Californian bank whose market cap dropped to only $2 billion earlier this month, said deposits had grown by more than $2 billion since the end of the first quarter. That was roughly $200 million higher than last week’s update.
Why did this matter so much? Western Alliance was among the banks that had been bogged down ever since the banking turmoil that erupted in March. The downfall of First Republic Bank at the beginning of this month had reignited worries that the troubles may not be isolated to banks that had miscalculated their risk management, and the sector’s share prices continued to drift lower. Wednesday’s news offered a glimmer of hope ofsome recovery.
The graph below shows the daily change of the S&P Composite 1500 Regional Banks Index. This was easily its best day since Jan. 6, 2021, coincidentally the date of the infamous insurrection at the US Capitol:
The stock of Western Alliance rose 10%, while its peer, PacWest Bancorp, saw shares jump by 22%. Progress is progress, after all. The developmentdemonstrated “stability amid an uncertain operating backdrop,” wrote Bloomberg Intelligence’s Herman Chan and Sergio Ferreira. “Asset sales are on track, while capital is nearing the 2Q [common equity tier 1] target above 10%. We see the bank as well positioned, with $22.6 billion in available liquidity and only about $10 billion in uninsured deposits.”
This is all good news for one relatively small bank, but it wouldn’t usually be enough to spark such a rally for the entire sector. Perhaps the surge was driven in large part by the way bets against regional banks have continued to pile on. Before Wednesday, short interest as a percentage of shares outstanding in the SPDR S&P Regional Banking ETF had risen to a massive 92%, from 74% a week ago, according to data compiled by S3 Partners, a technology and data-analytics firm. When accounting for the synthetic long bets created in each short sale, this means that almost 48% of the positions held in the ETF were wagering on a decline, up from 42% a week earlier.
Heightened short interest in banks isn’t surprising after the turmoil in the sector, and shows that many investors are still prepared to bet that banking’s difficulties will get worse before they get better. But it also created the ideal conditions for a bounce in regional bank-linked funds, as any short sellers wanting to exit their bets had no choice but to buy the stock. Even after the Wednesday bounce, KRE remains the worst performing unleveraged equity ETF this year among about 2,000 such funds that are tracked by Bloomberg Intelligence. But it certainly looks like evidence that a lot of really bad news is already in share prices, which offers an explanation for the resilience of the broader S&P 500 in recent months.
Whatever the precise reasons for the investors who are shorting banks, the strategy has proven profitable thus far. KRE shorts are up $305 million, according to Ihor Dusaniwsky, S3 Partners’ managing director of predictive analytics. Shorts of the Financial Select Sector SPDR Fund, an ETF that tracks a broader range of financial groups including investment banks, asset managers and credit card processors, are sitting on gains of$34 million. For bulls, this should be good news. If the shorts have nice profits already, the chances are that they will soon want to close their positions.
Zooming out, Wednesday’s climb leaves the industry with much further to go. Western Alliance, for instance, is down by 42% this year, while PacWest is lower by 76%. As for the KBW index, it has slid by 27%. This is why Andrew Slimmon, a senior portfolio manager at Morgan Stanley Investment Management, still isn’t optimistic about banks’ prospects in the near term:
“None of them were really down that much,” he said. “If you think about Lehman or Countrywide, those were credit problems... This is not a credit issue, it’s a deposit issue. So how do you handicap that?”
But the longer the stock market manages to digest bad news like this while still staying far above the low set last October, Slimmon suggests, the better. That will imply to fund managers that last year’s selloff has indeed adequately discounted the bad news out there, and improves the chance that the next stock market pivot will be toward bullishness. There will need to be a lot more days like Wednesday to convince people of this — but such a strong move on a not-particularly important item of good news is certainly what bulls want to see.