This mornings note will be short as last night was extremely long …
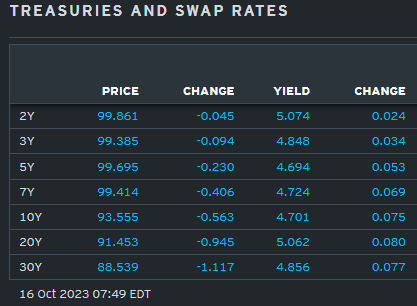
… here is a snapshot OF USTs as of 749a:
… HEREis what this shop says be behind the price action overnight…
… WHILE YOU SLEPT Treasuries have unwound some of Friday's pre-weekend, FTQ bid overnight amid super-light volumes. DXY is lower (-0.16%) while front WTI futures are little changed (+0.15%). Asian stocks fell, EU and UK share markets are mixed while ES futures are showing +0.2% here at 6:45am. Our overnight US rates flows saw fast$ interest to add 10s30s steepeners while central banks looked to add 10's after this morning's weakness. Overnight Treasury volume was very weak at ~55% of average.
… We’re cautiously optimistic on US bonds. The caution stems from the fact that bear trendlines (typically in place since May 4th) remain intact as we show in our first attachment of Treasury 10yr yields this morning. On the other hand, Treasury 2yr yields closed last week ~UNCHANGED from levels traded at 1:59pm on September 20th- or just seconds before the Fed released their Statement and SEP that day. And that mark was before JOLTS, NFP and CPI too... So with 2yr Tsys clearly trading ‘sold-out’ here, the performance of the long-end seems to depend on the whims of curve flow right now with 2yr yields a fulcrum, in ways. The overnight bear steepener is yet another obvious example of this.
Last week we wrote that after all the ‘upper range level noise’ during the week, our attention was shifting to the medium-term (momentum signals for next 2-4 months, say) weekly charts to see if they generate new signal amid their persistently deep ‘oversold’ condition. Well, if you squint in the lower panel of the weekly chart of 10yr Tsys in our second attachment, you can actually see that the weekly momentum oscillator confirmed a bullish flip on Friday. This adds some weight to the argument that the twin shooting stars traced out two weeks ago (see first attachment, highlighted) may indeed be indications of blow-off rate highs (~4.90%) for the bear move that began on May 4th this year.
… and for some MORE of the news you can use » The Morning Hark - 16 Oct 2023 and IGMs Press Picks (who CONTINUES to be sportin’ that new, fresh look) in effort to to help weed thru the noise (some of which can be found over here at Finviz).
Moving from some of the news to some of THE VIEWS you might be able to use… here’s SOME of what Global Wall St is sayin’ (in a similar sorta way you’ll find content if you pay for ZH PREMIUM? except … they are SELLIN other folks data where as I’m just point it out and links provided — should work IF you have permission and should NOT work if you don’t … HOW can THEY do that?? askin’ for a friend as I never understood how they do it…)
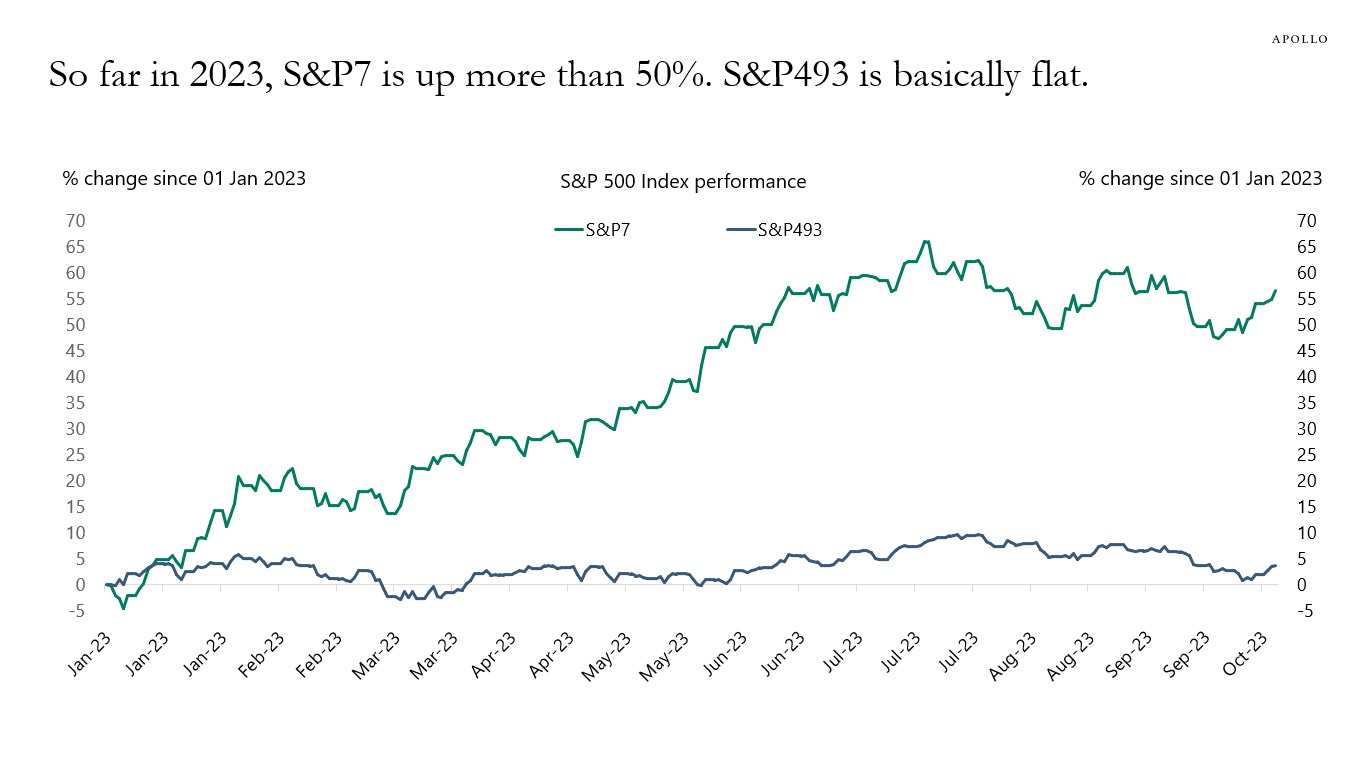
Apollo - Monthly Outlook Chart Book (as a visual learner, this note speaks volumes to me and I hope you enjoy … and yes, this chart SHOULD make one pause to consider portfolio construct…)
Our monthly outlook for public and private markets is available here.
BNP - Sunday Tea with BNPP: Shifting to steepeners (interesting as this was supposed to be the year of the steepener)
KEY MESSAGES
Heightened emphasis by Fed officials on tighter financial conditions boosts our long-held conviction in curve steepeners.
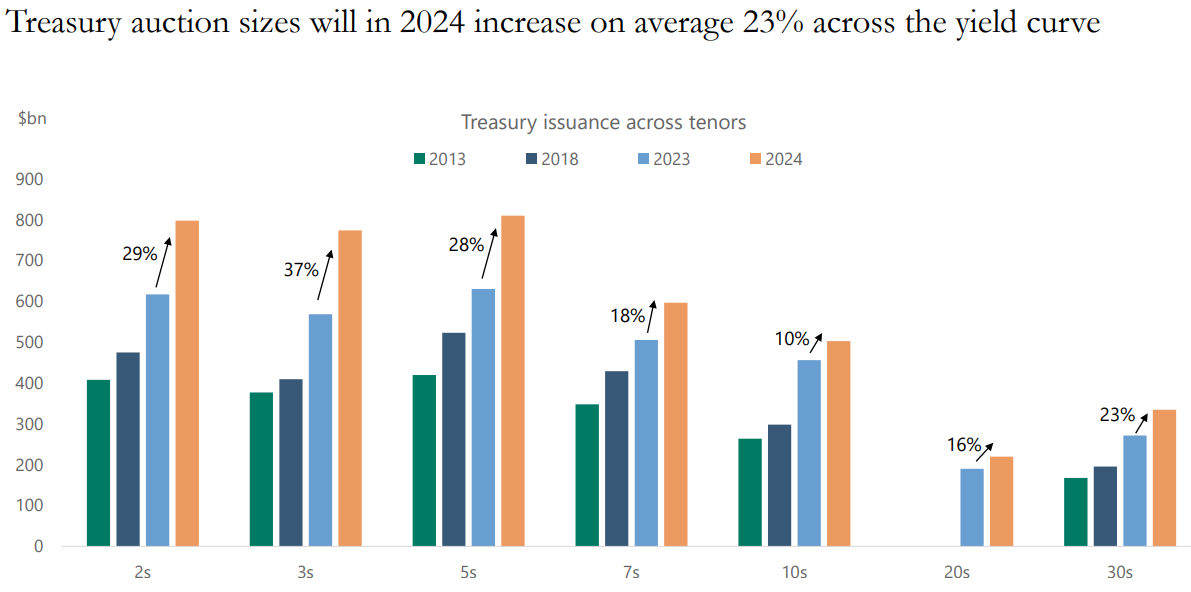
The poor US 30y auction last week is concerning, particularly with further auction size increases likely at next month’s refunding.
We see upside risk to oil prices as geopolitical risk premium rises. Reflecting this, we like XLE call ratios in equities and short EURCAD in FX.
… Given the evolution of the data, surely one would have expected the Fed to prep the market for at least one more rate hike this year (especially as it’s the median forecast in the SEP dots!). However, the synchronous chorus of recent Fedspeak re-focusing on financial conditions – and in particular, the notion that there is less urgency to raise short-term rates against a backdrop of rising longer term rates – has shifted the market’s reaction function. Accordingly, after having been received the front-end of the curve shortly after the September FOMC meeting, we took profits on the trade last Friday and have pivoted into curve steepeners, where we now see better risk/reward (Figure 2).
Goldilocks - US Economics Analyst: The Impact of Higher Rates on Small Businesses (small biz ARE ‘Merica)
…Small business financing differs from that of large corporations in two important ways. First, small businesses spend a larger share of revenues on interest payments—we estimate around 6% for small and 2% for large businesses in 2021. Second, while the average maturity of small and large business debt appears to be roughly similar, economic research finds that small business debt has a bimodal maturity profile: roughly half consists of credit lines, short-term loans, and other floating-rate debt (vs. 20% for large businesses), while the other half consists of term loans with 7-year average maturities when issued (vs. 5½-year for large firms).
We forecast total small business interest expense by combining a top-down projection for floating-rate payments with a forecast for the fixed-rate segment using loan-level data from the Small Business Administration. We estimate that higher rates will increase the interest burden for small businesses by just over 1pp by 2024, from roughly 5.8% of revenues in 2021 to around 7% in 2024. Under our current rates forecasts, we forecast this share would increase further to just under 8% as term loans gradually mature—above the pre-pandemic share of 6.8% but similar to that of the mid-1990s.
Combining these interest cost headwinds with our standing estimates of the modest sensitivity of employment and capital spending to interest rates, we estimate that the GDP growth drag from small business borrowing costs will peak this year at just 0.1pp. In our baseline, we forecast this growth headwind will wane in 2024 before rising modestly later in the decade as term loans are refinanced…
MS - Higher Rates and Slower Growth Weigh on Stocks (makes sense…)
While attention is squarely on the S&P 500's technical set-up between the 50- and 200-day moving averages, the average stock has already broken down technically. In today's note, we contextualize narrowing breadth, factor leadership, falling EPS revisions and fading consumer confidence.
… When looking at the S&P 500 index, we can continue to point to a number of cross currents technically. After falling close to 9% from the July highs, the index made an impressive stand at the 200-day moving average. The fact that this level also coincided with the uptrend from the October 2022 lows made the stand more valid in the mind of many and gave credence to the idea that a powerful 4Q rally was likely to begin. However, that rally ran into some stiff resistance right at the 50-day moving average last week and promptly reversed lower, leaving the benchmark index right in the middle of these two key technical levels ( Exhibit 1 ). The cause of this reversal is likely related to both higher rates and concerns about slower growth. On the former, we experienced one of the weakest 30-year Treasury auctions in recent memory last week from a demand standpoint as supply continues to overwhelm. Meanwhile, new geopolitical risks emerged, leading to questions about the impact on confidence (both consumer and corporate) and on global growth.
MS - Sunday Start | What's Next in Global Macro: Humility amidst Geopolitical Uncertainty
The tragedy unfolding in the Middle East understandably has captured the world’s attention. There has been no shortage of prognostication in the media about whether the conflict escalates, how other countries might get involved, and what the effects would be on the global economy and markets. Unsurprisingly, clients have been asking for our insights. As a student of geopolitics and a strategist whose practice relies on unraveling its complexities, what I can say with confidence is this: there’s no obvious path from here, so we must be humble and flexible in our thinking.
While this may not be the clear guidance you’re hoping for, let me suggest that accepting uncertainty itself can bring clarity. As we’ve discussed many times in our work on the transition to a multipolar world, geopolitical uncertainty has been on the rise for some time. Governments are implementing policies that buttress economic and national security, in the process rewiring global commerce to avoid empowering geopolitical rivals…
… So, what are the market implications of an environment where uncertainty is rising and we can reliably expect governments to react to it? Vis-à-vis the specific situation in the Middle East, many unforeseen market consequences are likely, but more generally, here are three conclusions we feel confident in today:
1. Security’ spending is rising as an investing theme: We expect that US and EU companies may spend up to US$1.5 trillion to ‘de-risk’ value chains (i.e., re-engineer supply chains to reduce reliance on foreign rivals and enhance physical, natural resource, food, health, and energy security). ‘Critical infrastructure’ stocks could be key beneficiaries here.|
…3. Oil prices may rise, but investors should resist the assumption that this will lead rates higher: Again, while it may take several more steps of escalation to get there, one possible outcome from the current Middle East crisis is oil supply disruption, either from potential dislocations just discussed in our prior point or increased Iranian sanctions. As our economists have noted, higher oil prices clearly mean higher gasoline prices, but the effects are more muted and temporary across goods and services broadly. In prior oil supply shocks, a 10% jump in price on average added 35bp to headline US CPI for three months but just 3bp to core CPI. Further, higher gasoline prices can meaningfully crimp lower-income consumers’ behavior, weakening demand in the economy. Hence, one shouldn’t assume higher oil prices translate to a more hawkish central bank posture.
Business activity slowed in October as a plurality of respondents indicated that conditions worsened. Respondents were split on whether structures investment has risen in recent years. Artificial intelligence (A.I.) adoption remains high. Cost-management initiatives continue.
MS - The Weekly Worldview: FCI – What is it good for…?
What do tightening financial conditions mean for the Fed? The Morgan Stanley Financial Conditions Index has risen and Fed officials are talking.
… The MSe FCI takes the Federal Reserve Board staff’s FRB/US model and traces out the effect on the real economy of moves in a variety of financial indicators. These variables include: the federal funds rate, bond yields (using 10-year US Treasury yields), the stock market (using S&P500 price index), the dollar (with the Fed’s nominal broad dollar index), oil prices, and the credit spread of BBB corporate bonds over 10-year US Treasury yield. Severalother indexes are also available, but the MSe FCI translates any given change in financial conditions into federal funds rate equivalents.
… And from Global Wall Street inbox TO the WWW, this economist link is from a couple / few days ago and perhaps still worth considering
Bloomberg - Time Is Running Out for the ‘Year of the Bond’ as Losses Mount
Bond bulls including JPMAM, HSBC reassess views and positions
But there’s no capitulation: recession a ‘when’ not an ‘if’
The tagline from Wall Street was that 2023 was the year of the bond. Instead, fund managers are coming to terms with one of the toughest years ever.
Lacy Hunt, Hoisington Investment Management Co.’s 81-year-old chief economist, who’s been analyzing markets, Federal Reserve policy and the economy for around a half-century, says it’s been the hardest of his entire career.
At HSBC Holdings Plc, Steve Major says he was “wrong” to assume the US government’s growing supply of bonds didn’t matter. Earlier this month, Morgan Stanley finally joined Bank of America and moved to a neutral position on Treasuries.
“It’s been a very, very humbling year,” Hunt said. A 13% year-to-date loss for the firm’s Wasatch-Hoisington U.S. Treasury Fund comes on top of 2022’s 34% drop, data compiled by Bloomberg show.
Treasuries declined on Monday as concerns eased that the Israel-Hamas war would escalate to engulf other countries in the Middle East. The yield on 10-year US notes rose five basis points to 4.66%. That’s nearly 80 basis points higher than where it started 2023…
The Economist - Retail investors have a surprising new favourite: Treasury bills. Banks face a fresh form of competition. (IF I had seen / passed this one along last week it would / MIGHT have been a(nother) timely reminder)
…When treasury bonds (or t-bills) last yielded as much as they do today—5.5%—punters were relieved that the world had not been destroyed by the millennium bug, Destiny’s Child were atop the charts and the dotcom bubble was going strong. The recent surge in yields has been remarkable (see chart).
AND as far as that call … or lack thereof … the HOLD itself was longer than Aaron Rogers NYJ 2023 season and afterwards, a look at Wallers jersey


I haven't finished reading your excellent article, but I want say I appreciate the section on
Treasury Refunding Allocation.
At a cursory glance it looks to me that the Treasury is predominately BORROWING SHORT..
WHY ?????
They are paying Higher ST Rates with a TIGHT payback time period.......
That's not the way to borrow money, if your cash strapped, is it ????
Sure we don't know where rates will peak.....But stretch out the Duration, take the Pressure
off the Frequency and amounts of the Refunding....
It's too Front Loaded !!!!!
Please let me know your thoughts.....
Thank you for your work and your humor......
We needed Robert Rubin, but we have Janet Yellen.....
Bob Rubin and Bill Clinton achieved a Balanced Budget and even made a Principal Payment on the
National Debt, I believe.......
We need people of Rubin's or Milliken's Caliber at Treasury......
They need a Debt Strategy......it looks like they are overwhelmed.....