(USTs lower on strong volumes, better than EGBs after CPI)while WE slept...; from “cute wiener dogs in the metaverse” TO 10yy facing a, "tough battle to break above 4%
Inflation in two of the euro zone's biggest economies rose unexpectedly this month, data showed on Tuesday, pushing up European Central Bank rate hike expectations and challenging the narrative that a rapid easing in price growth is now underway…
… Inflation in France rose to 7.2% from 7.0%, beating forecasts for 7.0%, while in Spain, it jumped to 6.1% from 5.9% and ahead of the 5.5% seen in a Reuters survey.
This headache for the ECB can easily then be viewed with this visual — clearly not the best one you’ll find on the intertubes BUT best I can do now, sans Terminal
Staying tuned ‘til this time tomorrow when I believe we’ll get German ‘flation data.
For now, though, here is a snapshot OF USTs as of 705a:
… HEREis what another shop says be behind the price action overnight…
… WHILE YOU SLEPT Treasuries are modestly lower and notably outperforming EGBs after upside surprises in the February CPI data in Spain and France this morning (links above). DXY is UNCHD while front WTI futures are higher (+1.5%). Asian stocks were mixed, EU and UK share markets are mixed too (IBEX +1% but FTSE 100 -0.3%) while ES futures are showing +0.22% here at 6:45am. Our overnight US rates flows saw a quiet Asian session with a -3.8k block sale in TU futures setting the tone this morning there. Some back-end, real$ buying was noted into the dip. In London's AM hours the desk noted a generally quiet trade with ongoing FRM buying in the front end (see our discussion in text below). Overnight Treasury volume was still quite decent at ~150% of average with 3yrs (251%) seeing some relatively elevated average turnover this morning.
… 2's did trace out and confirm a Shooting Star yesterday akin to the price action seen on November 4th when 2's first kissed the 4.80% level. Our first attachment of the daily chart of Treasury 2's shows all this and what seems clear is that a 'barrier of demand' remains near the 4.80% level as first revealed back in November. Note too in the lower panel that daily momentum has been pinned at 'oversold' levels for ~the past three weeks which suggests a surfeit of tactical shorts to work through if yields find cause to press higher. Away from the technicals, we've recently been writing about our hunch that 5%-handle front end yields are generating their own demand with this article from Bloomberg yesterday (short-duration bond funds see huge inflows as stocks whipsaw...) somewhat confirming the thesis: BLink
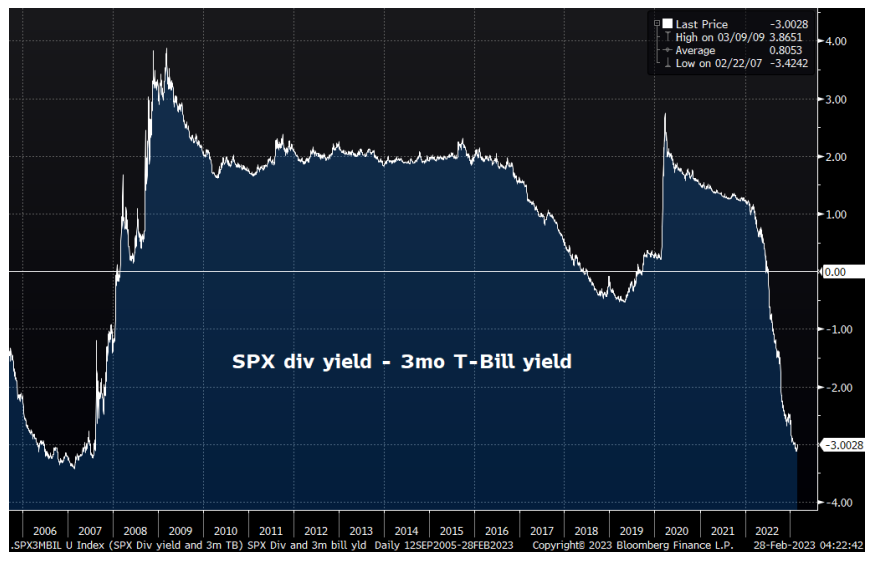
Our next attachment is a related one from our archives showing the SPX div yield-3mo T-Bill spread now getting back to its 2006/2007 nadir while well below levels seen in late 2018/early 2019 when stocks hit turbulence then. We're sure there are better ways at flagging-up portfolio balance channel relationships like this but... Hmmm...
… and for some MORE of the news you can use » IGMs Press Picks for today (28 FEB— and STILL SPORTING THAT NEW LOOK!!) to help weed thru the noise (some of which can be found over here at Finviz).
From some of the news to some VIEWS you might be able to use. Global Wall St SAYS:
First and foremost, whenever I see an updated f’cast I instantly think of that dart throwing excercise — guesses made, decisions become MORE informed with each day passes and then said guesses are ‘marked to market’ …
It is with that in mind, a large German bank offers
Forecast Update - Still Expecting Significant Steepening in H2
We update our 2023 US rates forecast, building from our US Economics team's recently revised Fed policy projection.
The key inputs to the forecast have been the same since last fall. We take a probabilistic approach, with the Econ team's projection as our baseline and alternative scenarios that entail higher and lower fed funds rate paths. We view near-term risks as roughly balanced, but anticipate recession will be needed to bring inflation to the Fed's 2% target, and the main dynamic driving bond pricing later this year will be the depth and duration of recession and the extent to which the Fed cuts below neutral.
The updated forecast entails a higher near-term trajectory of short- and medium-term Treasury yields. We continue to project sharply lower front-end rates and a steeper curve in the second half of the year, with the 2y and 10y Treasury yields at 3.15% and 3.6%, respectively, at year-end.
We continue to recommend patience in positioning for lower front-end rates and a steeper curve, given upside inflation risks. In particular, we're looking for more evidence of labor market weakness or more clarity on fiscal tightening coming from debt limit negotiations.
Again, keep in mind — having read many year ahead forecasts and understanding full well these are done with very best of intentions — I get how these are simply never done with ability to incorporate the KNOWN UNKNOWNS (aka SURPRISES) and in no way am I suggesting I would have / could possibly have done any better — likely just the opposite, but … here we are. The economy has yet to fall out of bed and rate CUT bets all but run outta town and now, folks (re)adjusting ‘forecasts’, marking them to market …
And so it goes. Economists and macro strategists (to some degree — we all know how they are all created equally, just that some are MORE equal than others) are like weathermen … rarely correct yet NEVER in doubt.
And speaking of NEVER being in doubt, Goldilocks ASKS / attempts to answer / connect some dots
… We see three main drivers of the recent moderation in wage growth. First, we estimate that the recent declines in headline inflation and inflation expectations have reduced wage growth by about 0.3pp. Second, the expiration of Covid-related labor market policies, the end of pandemic bonuses, and the normalization of other Covid-related labor market disruptions have likely lowered sequential wage growth by roughly 0.6-0.8pp. Finally, the decline in our jobs-workers gap from its peak has likely lowered wage growth by a further 0.2-0.3pp, a modest share of the total deceleration so far…
… Taken together, we expect wage growth to slow to just under 4% by end-2023 (qoq ar) and to 3.5% by end-2024. Nevertheless, we see upside risks to our wage growth outlook, and the Fed would likely have to generate a larger drag on aggregate demand to cool wage growth if job openings or inflation expectations prove stickier than we expect.
And Goldilocks SAYS / defends:
OIL: OPEC Supply: Lower for Longer? … We forecast that oil prices rise gradually to $100/bbl by December, where we expect it to stay in 2024, assuming OPEC increases output by 1mb/d in H2. However, if OPEC were to stay put, then Brent would likely reach $107/bbl in December, and keep grinding higher thereafter. Finally, Brent would likely still reach $100/bbl in December if production were flat for Russia and OPEC, slightly firmer for the US, and if OECD demand were slightly softer than our baseline.
Finally, with EARL heading up TOWARDS $100/bbl one would think de / disinflation (and so, soft ‘ish landing) horse has left the proverbial barn BUT
… Taken together, we forecast core PCE inflation to still fall significantly this year, from +4.7% currently to +3.3% in December (vs. our forecast at the start of the month of +2.9%). On a sequential basis, the increase in our forecast is concentrated in 2023H1 (+0.5pp to +3.4% annualized, Feb.-June average), mostly reflecting our higher path for used car inflation and to a lesser extent a slightly higher path for shelter inflation over the next couple months. Market pricing appears too optimistic about the inflation outlook, embedding an almost 1pp larger decline in headline CPI inflation (where used car and shelter prices have a larger weight) this year relative to our own forecast for +4.0%.
From temporary setback (ie transitory) TO something more global in nature … 1stBOS,
Global Economy Notes: The long road to 2% There’s still a long way to go to get inflation back to comfortable levels. Several January inflation releases in major economies surprised to the upside. We don’t think they portend a reacceleration, but they challenge hopes of a smooth return to target.
Despite a recent decline, even short-term run rates of core inflation remain uncomfortably high. Other measures of underlying inflation, which we show in the following pages, tell a similar story. In the US, overshooting inflation is mainly a services story, whereas Europe has wider problems.
The risk for policy rates is still skewed toward higher for longer. Fixed income markets are now better priced for the long road ahead. However, we do not expect cuts from any major central banks this year. Equity markets look rich relative to a ‘higher for longer’ scenario.
The longer inflation stays too high, the more central banks shouldfeel the need to prompt economic weakness, sooner. This would imply a higher risk of policy-driven recessions.
Oh. OK then … when you put it THAT way, all sounds so dang simple … Just how BIG of a recession? The bigger the bubbles the harder they pop?
The stock market rally so far this year seems based largely on speculation rather than fundamentals. Investors appear hopeful the Federal Reserve will soon return to a policy of cheap and abundant liquidity while ignoring the Fed’s repeated warnings to the contrary.
Speculation and bubbles require significant liquidity. Economic fundamentals do not point to the Fed soon changing course and easing credit conditions or lowering interest rates and have more recently argued the exact opposite: the Fed could stay tighter for longer than investors currently expect.
Accordingly, we continue to be defensively positioned within our portfolios, rather than loading up on those assets most likely to fizzle out.
He goes on to DEFINE 5 characteristics OF a bubble, SHOWS the YoY growth rate of M2 (the rise and dramatic fall), reminds us all of how all this global liquidity being drained leading him to another important FACT on p4 of 7,
Our recent opinion column in the Financial Times outlined our view that the so-called “Fed Put” is dead (End the Fed Put (rbadvisors.com))…
… However, with inflation well above the Fed’s 2% target and the labor markets historically tight, the Fed no longer has the flexibility to save the day for financial market participants. We believe The Fed Put is dead.
Chart 3 shows how the Fed’s flexibility is now constrained. From 1995 until the pandemic, CPI-based inflation averaged 2.2% remarkably close to the Fed’s 2% target. Since the pandemic’s massive monetary and fiscal stimulus, however, inflation has been well-above their target.
Rich continues with reminder that corp cash flows coming under pressure and then he concludes with how it is he KNOWS the rally in stocks is NOT fundamental. “Look at Cryptos.” and his conclusion actually did provide ME a chuckle…
… Longer-term we continue to see a shift from “cute wiener dogs in the metaverse” to real productive assets, and we remain more positive on cyclical sectors such as Energy, Materials, and Industrials than we normally might be at this point in the cycle.
Please dont AT me — send all your comments and criticisms to Rich (www.RBAdvisors.com)!
speaking of simple and all of this being semi related (at least within my head — sorry if seems as though I’m jumping around quite a bit), here’s something from BBGs Simon White (via ZH) because as the Fed and global CBs continue to have to react to data (rather than lead), well, price action will have consequences … and price action has seemingly remained extremely MUTED.
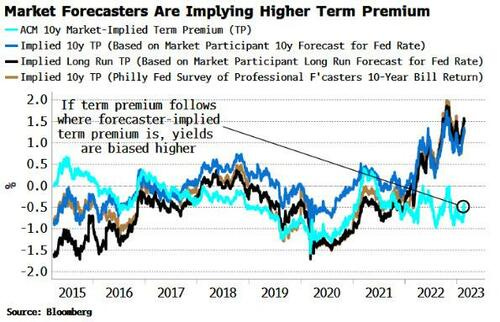
ZH: Yields Yet To Fully Reflect Living In An Inflationary World
… One remarkable feature of the current cycle has been how relatively contained longer-term bond yields have been despite the highest inflation for decades. Term premium has remained well behaved, as the market has not, yet, demanded an extra premium for inflation risks.
But term premium implied by forecasters is already much more elevated than market-implied term premium. Given the inflationary backdrop, there is as yet an unpriced risk bond holders could soon start to demand a higher premium, taking yields higher.
With that in mind (bond holders demanding higher premium), Advisors Asset Management asks / answers IF there are,
After finishing the worst year on record for bond performance in 2022, the first month of 2023 saw an about face in the corporate bond market. January was reported to be a record month for investment grade corporate bond ETF (exchange-traded fund) flows. Sure, corporate bond yields are the highest in nearly two decades but the record demand for corporate credit has caused a collapse in the spread that investors receive when buying a corporate bond versus a “risk free” Treasury note. The credit spread is the amount that an investor is being paid to take the corporate credit risk over the “risk free” alternative. In fact, this spread has contracted to levels generally only seen prior to major recessions….
… The credit rating agencies have been very clear that they expect the default rate to climb for lower quality corporate borrowers as the bite of higher interest rates take hold. On top of this, the Federal Reserve (Fed) has been very clear that they are not done raising rates and that they intend to keep rates above the rate of inflation for an extended period. The following chart shows the significance of the drop in corporate spreads as measured between BBB- rated corporate bond and 90-day U.S. Treasury yields.
Please note that the spreads have narrowed because of record demand rising to levels not seen since 2007…
… In conclusion, history is clear that when corporate credit spreads are as tight (narrow) as they are today, investors should look for better days ahead to take on significant credit risk. It is incredibly important for investors to be adequately paid for the risk they are taking versus what they think they are taking.
Finally, getting back TO YIELDS — there is going to be a “…tough battle to break above 4%” — Bloomberg,
Some mixed data and perhaps a burst of month-end rebalancing flows helped Treasuries rebound overnight. But that also draws further attention to just how tough a nut the 4% level is to crack for benchmark 10-year yields. A number of investors and strategists have flagged 4% as the sort of level where 10-year Treasuries become very attractive — at times adding a wry comment about the power of round numbers.
This particular round number may also have some extra oomph thanks to a long-term trend line derived from the workings of Italian 13th century mathematician Leonardo of Pisa, later known as Fibonacci. Traders often use the sequences he described to guide their positioning, and 3.98% or so happens to be the first, 23.6% retracement of the four-decade decline in the yield to 0.31% in 2020 from its 15.84% peak in 1981. That’s quite an array of numbers to back up the idea that it may take some strong economic numbers — or stronger words from Federal Reserve officials — to send yields higher from here. And if they do, the likelihood would be some rapid increases after the lines in the sand get erased.