(USTs lower on light volumes w/20s OUTperforming...) while WE slept; are rates followin' USD? (who cares, it's gonna be messy and good for stocks); update on the 'bible' (2s5s)
… HEREis what same shop says be behind the price action overnight…
… WHILE YOU SLEPT Treasuries are lower with the 20yr sector outperforming on curve (10s20s30s -1.8bp) with the Gilt market appearing to be leading Treasuries and Bunds to higher rates this morning. JGB's also sold off after Japan's CPI (+3.6% YoY) printed a 4-decade high while ECB's Lagarde waxed hawkishly today too (see link above). DXY is higher (+0.75%) while front WTI futures are modestly lower (-0.5%). Asian stocks were little changed, on balance, EU and UK share markets are higher (SX5E +1.45%) while ES futures are showing +0.8% here at 7:15am. Our overnight US rates flows saw another quiet Asian session to end the week with our desk seeing Fast$ selling in the long-end alongside interest to steepen the curve. Overnight Treasury volume was ~80% of average overall.
… The weekly chart of the 2s10s cash curve shows this week's breakdown and the renewed flattening signal in the still somewhat 'oversold' weekly momentum study (lower panel).
… and for some MORE of the news you can use » IGMs Press Picks for today (18 NOV) to help weed thru the noise (some of which can be found over here at Finviz).
Layoffs in the tech sector are making headlines. But while we expect a substantial labor market slowdown in the coming months, the tech sector likely reflects more idiosyncratic than macro factors. Overall, staffing remains lean and we expect firms to hold on to workers through the growth slowdown.
Tech-related employment has far outpaced pre-pandemic levels while the rest of the economy has only just recovered
TECH layoffs aside, a couple things more rates related … thinking TICS specifically. First up from Global Macro Monitor
TIC data show foreign investors net purchased $80bn in US long-term FI securities in September, down sharply from the prior month. The data also corroborate reports of central banks selling reserves for intervention purposes as the official sector net sold $38bn in UST coupon securities
It appears that Global Wall Street has offered a bit of a break from 2023 year ahead outlooks SO we’ll turn TO some charts which may / may NOT be of interest and hold some funTERtainment value …
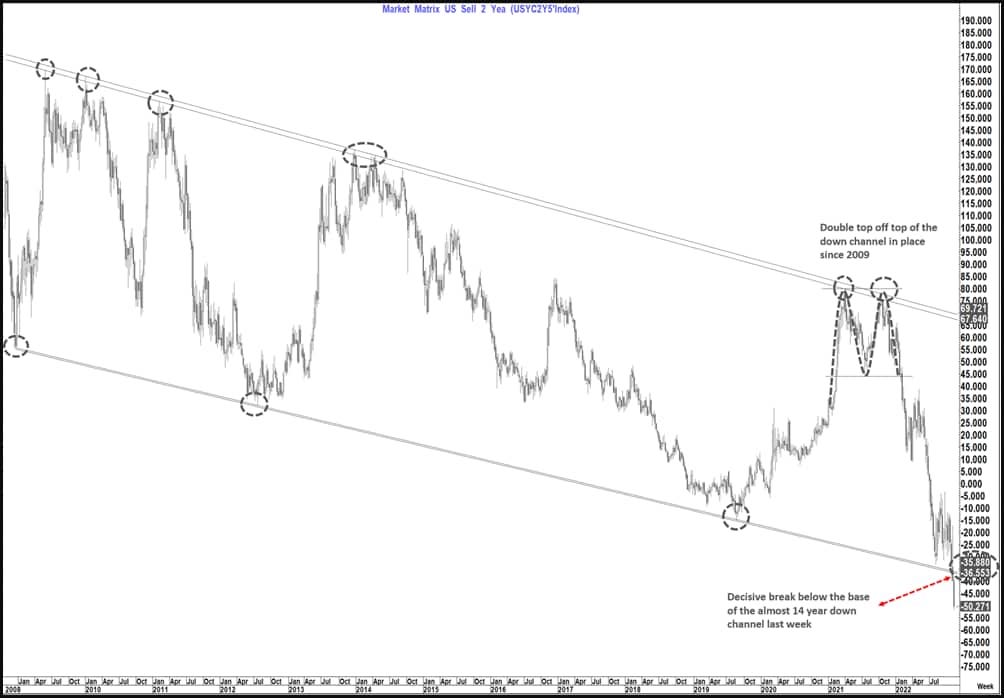
First up from THE author of THE RATES / CURVE BIBLE (2s5s), a question
… Minus 36 to minus 37 bp’s a big a big pivot which broke last week
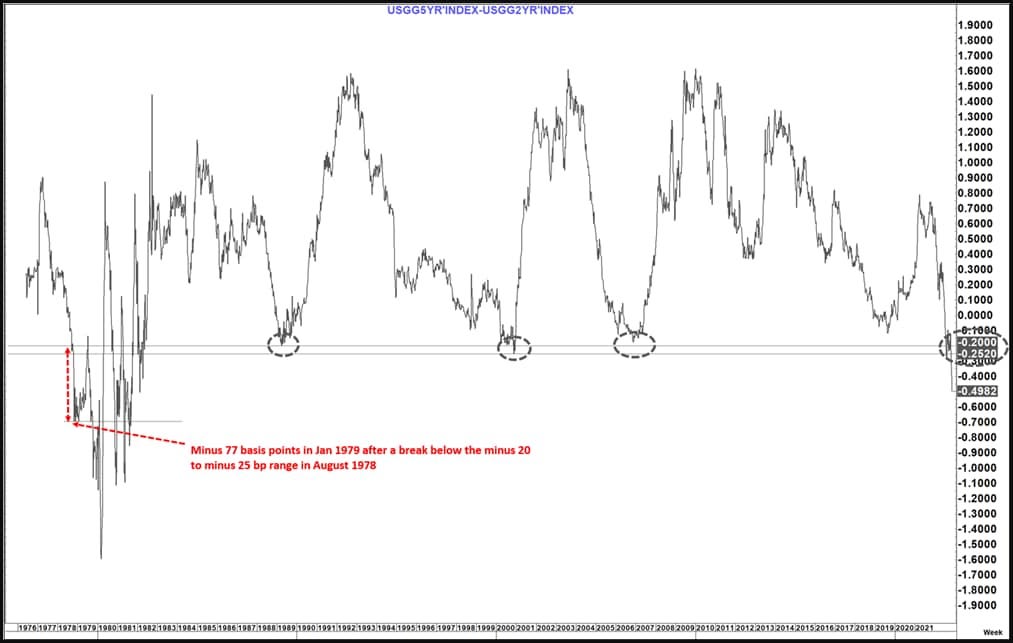
… In addition, when we look back to the 1970’s (We only have a 2 year yield since 1976) we see what happened in 1978-1979 when it broke below minus 20 to minus 25 bp’s
2. The 1970’s was a different World to the last 30 years but maybe not so different to today.
… The buffers on employment, fixed rate mortgages, excess savings, re opening economy etc. will likely take several months to wane before this discussion can even gather traction. At present we see little tangible evidence of ongoing success in the Fed’s inflation fight. Rather we see a short period of apparent “remission” before those hopes get dashed again.
However, the charts above suggest that by the end of Q1, 2023 the pieces of this puzzle may likely be falling into place
Unless the Fed is prepared to wreak the havoc of the 1970’s on employment and the economy (which I doubt) then the turn in this curve, when it comes, could actually be far from the traditional turn of the last 30+ years and morph not into a bull steepener but actually a bear steepener.
That outcome is still a focus for the future but if, as we expect, we move towards minus 75 basis points on our financial bible in the coming months this is likely a discussion that is going to move more into the mainstream.
From the new new testament — 2s5s — TO the basement of 1stBOS,
Chart of the Day: 30yr US Bond Yields broke sharply below key short-term resistance at 4.055/045% earlier this week, which included the late October/early November lows and the 23.6% retracement of the upmove from August, in tandem with a sharp flattening move. The market is so far holding next resistance at 3.825%, which includes the 55-day average and 38.2% retracement, however we look for a break below here in due course, with next resistances at 3.64%, then 3.455%.
The firm REMAINS ‘tactically bullish’ 5s and 10s and would turn so on bonds back at support (4.02%) …
Don’t take your eyes off the US dollar and interest rates! …
… I won’t pretend to know where rates are headed. But if the dollar and rates remain on similar paths, my money is on declining yields at the longer end of the curve.
Yesterday, the 30-year yield fell back below its former 2014 highs after peaking late last month. Risks are now to the downside toward 3.25 as long as the 30-year holds below those former highs. It’s messy! I can’t think of a better scenario for stocks.…
…so they — the ALLSTARS — don’t claim to know where rates are going but where ever they may be headed, it’s going to be MESSY and that, ultimately is good for stocks — is it ME or is EVERYTHING and all the time GOOD FOR STOCKS?
… remind me again how much you are paying for this AllStar level of ‘stratEgery’?
Bond markets have been signaling for a while that risk assets may have been too eager to jump on that October CPI print as a sure sign the worst is behind us. St. Louis Fed President James Bullard underscored the issues when he came out Thursday to say he expects the minimum Fed funds target needed is a 5.125% midpoint. That’s higher than is being priced by rates traders, which also means bond investors look open to fresh turmoil after driving yields down so that notes maturing in five years or more are all under 4%.
A look at the action for implied volatility gauges underscores the potential for further wild moves. The classic MOVE Index, based on one-month volatility, tumbled to well below the three-month gauge and has since rebounded. The last two times that happened, in August and June, both indexes soared to fresh highs. Get ready for a wild year-end, because it looks like the bond market is gearing up for one.