GOOD NEWS … ‘stocks near 4mo HIGH as rate cut bets BUILD (Bloomberg) where you’ll find this all is not ONLY a US phenomenon (see DB ECB call below) but a (nearly) GLOBAL one …
… Markets have now fully priced six quarter-point rate cuts by the ECB in 2024 for the first time, a move that would take the key rate down 150 basis points to 2.5%. There’s also an almost 90% chance of the easing cycle starting in the first quarter of next year, a scenario that was barely contemplated just three weeks ago
… and the funny thing which strikes me is how this very same PIVOT (towards rate cuts) has, in recent memory, been BAD for stocks …
There’s somewhat MORE context just below but … keeping in mind this all from a guy who thought rate HIKES were having an impact back in MARCH (there was an impact, for sure BUT) and PIVOT would / should / MIGHT have been coming quicker THEN than they actually have.
NOW here we are and while, yes it is true, ‘flation moderating, the Fed’s credibility (higher rates were doing some of the Fed’s rate HIKES then and so, lower rates now are = X — please solve for X) is all but GONE?
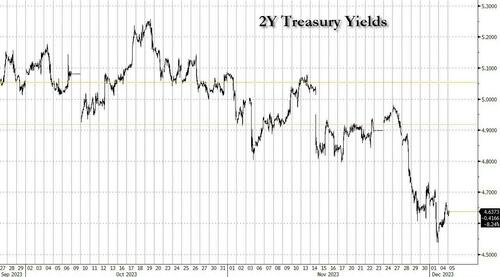
Forget it … I’ll quit while I’m behind and for now, a look at 2yy at / near 4.60% — a level which I’m attempting to highlight …
… To say I’d be nervous and well, putting some hay in the barn (lightening UP if long the front end benefitting from the rate CUT BETS) would be an understatement … see, for example, Sticky Wage Growth by Apollo just below … AND for now, a quick recap.
JOLTs jolted the rates / other markets yesterday and so,
CalculatedRISK: BLS: Job Openings Decreased to 8.7 million in October BondDad: October JOLTS report: yet one more month in the ongoing decelerating trend ZH: Labor Market Implodes: Job Openings Crater, Prior Data Revised Sharply Lower
… here is a snapshot OF USTs as of 705a:
… HEREis what this shop says be behind the price action overnight…
… WHILE YOU SLEPT Treasuries are lower with the curve flatter as locally 'overbought' conditions remain amid little fresh news. DXY is UNCHD while front WTI futures are -1%. Asian stocks rebounded nicely overnight, EU and UK share markets are all higher while ES futures are showing +0.13% here at 7:25am. Our overnight US rates flows saw better net buying from real$ during Asian hours despite a high-volume, belly-led sell-off then. Swaps were quiet while in London hours the desk saw a 'choppy but busy' session with better net buying during their hours too. Overnight Treasury volume was actually pretty weak at ~55% of average overall.
… and for some MORE of the news you can use » The Morning Hark - 6 Dec 2023 and IGMs Press Picks (who CONTINUES to be sportin’ that new, fresh look) in effort to to help weed thru the noise (some of which can be found over here at Finviz).
Moving from some of the news to some of THE VIEWS you might be able to use… here’s SOME of what Global Wall St is sayin’ …
Looking across the wage distribution shows that wage inflation remains sticky between 4% and 5%, see chart below.
The FOMC would likely look at this chart and conclude that a higher unemployment rate is needed to get wage inflation down to levels consistent with the Fed’s 2% inflation target.
Argus: Market Watch - Daily Spotlight (improvement hard to see on the chart BUT bonds losing some ground relative TO stonks…)
Stock Valuations Improve on Lower Rates Our bond/stock asset-allocation model indicates that bonds remain the asset class offering the most value. But stock valuations are much improved, in response to the decline in the benchmark 10-year government bond yield. Our model takes into account current levels and forecasts of short- and long-term government and corporate fixed-income yields, inflation, stock prices, GDP, and corporate earnings, among other factors. The output is expressed in terms of standard deviations to the mean, or sigma. The mean reading from the model, going back to 1960, is a modest premium for stocks, of 0.16 sigma, with a standard deviation of 1.0. The current valuation level is a 0.22 sigma premium for stocks, not far from fair value and down from a 0.98 sigma premium two months ago. Other valuation measures also show reasonable multiples for stocks. The current forward P/E ratio for the S&P 500 is 17.1, within the normal range of 10-21 and down from 22 a year ago. The current S&P 500 dividend yield of 1.6%, while below the historical average of 2.9%, is up from an ultralow 1.2% as recently as 2021. We expect results from our valuation model to continue to improve, as interest rates decline into next year and EPS growth picks up. Based on the current valuation levels, as well as interest rate and earnings forecasts, we called for a recovery in stock prices in 2023 from bear-market lows and in July set a year-end 2023 S&P 500 target of 4,600. That still holds. Our recommended asset-allocation model for moderate accounts is 67% growth assets, including 65% equities and 2% alternatives; and 33% fixed income, with a focus on core and opportunistic segments of the bond market. On duration, we recommend the short end of the curve.
Job openings declined to 8.7mn, suggesting a pullback in demand for labor amid a declining hiring rate and a steady separation rate. This lowers the ratio of vacancies to unemployed to 1.34. All told, the data suggest that momentum in labor markets continued to moderate in October.
BloombergBNP: US November jobs preview: End of strikes to mask fading trend
KEY MESSAGES
In November, returning strikers will likely mask the decelerating trend in hiring, pushing payrolls growth up to 185k (from 150k prior), we estimate. The United Auto Workers and Hollywood strikers headed back to work at the beginning of the month, implying an around 50k jump in job growth between October and November.
Consumers cutting back on leisure activities/discretionary spending in early Q4 will require fewer service sector workers. Anecdotal evidence suggests employers feel less hesitant to lay off workers.
A rebound in participation would keep the unemployment rate at the previous month’s level of 3.9%, in our view, after increasing from 3.8% in October.
Bloomberg BNP: US November CPI preview: Are we there yet? (nuance and detail of these ‘calls’ is off the charts … heads I win, tails YOU LOSE sorta level … mental gymnastics of the HEDGED VIEW … wow)
KEY MESSAGES
With core inflation running near target-consistent rates in four of the last five months, markets have embraced the possibility that the Fed’s inflation fight is effectively over.
Though we expect disinflation to continue through next year, the recent spate of soft core inflation prints likely understates underlying price pressures, in our view. We see core PCE inflation running closer to an annualized pace of 3% than 2% over the next several months.
In this vein, we look for core CPI to rise 0.3% m/m in November (up from 0.2% prior and the 0.2% averaged over June-October). The potential for continued weakness in several services categories skews risks to the downside.
We think core PCE inflation will fall to a 2.5% annualized m/m pace by Q2 2024, effectively matching the Fed’s current end-2024 forecast and setting the stage for a rate cut next May.
… Not only is core inflation on track to undershoot the Fed’s 2023 forecast, but over the past five months it has printed at a pace below officials’ latest projections for 2024 and not too far off the Fed’s 2% target (see Figure 1). All of which raises the question – are we there yet?
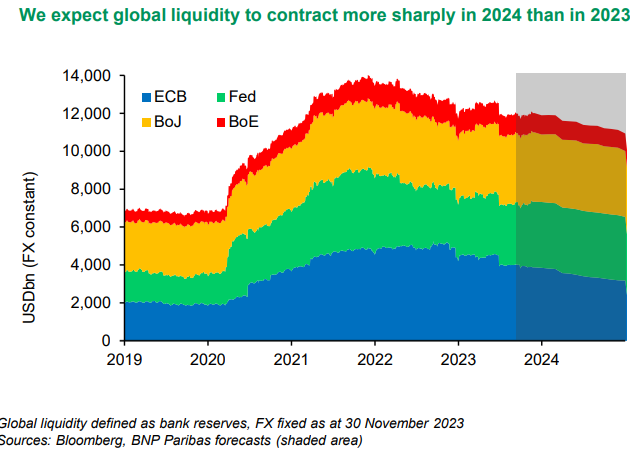
BNP: Global Outlook 2024: Still searching for a landing (not sure what the deal is but there seems to be a ski-jumping analog memo that went around — thinking ‘bout JEFFs SKI JUMP econ noted over weekend and now this — cover image)
Disinflation is sufficiently advanced to allow most DM central banks to start cutting policy rates soon, lowering the risk of a hard landing and allowing for a moderate growth recovery in H2 2024.
In the near term, GDP growth is set to decelerate considerably in the US and remain stagnant in the eurozone. The Chinese economy has passed its trough but will lack momentum going into 2024.
Disinflation and the prospect of rate cuts are positive for risky assets but not enough for a bull market. We see equity risks being skewed to the downside in the US and balanced in Europe and China, but positive in Japan.
Credit will remain range-bound, we expect, with wider spreads in leveraged finance and US Investment Grade, along with rating decompression.
As we believe in ‘higher for longer’ when it comes to long-end yields but not the short end, we expect curves to bull-steepen.
We remain structural USD bears, but the depreciation path will be bumpy.
… US rates: A Fed-led rally
Room to price a deeper cutting cycle: Clearer growth weakness in H1 2024 could see pricing deepen below the 3.50-3.75% terminal rate currently implied.
Longer-term forwards likely to be sticky at higher levels, though: 5y5y rates typically rally into the first cut but are then stable. Record duration supply to the market amid elevated deficits and Fed QT, a comparatively benign economic downturn, and higher global yields support the case for stability in longer-term forwards.
A targeted steepening view for now: Material 2024 cut pricing favors positioning with an eye on the depth of rate cuts at this stage. We prefer 5s10s steepeners.
Monetizing elevated vol to offset negative carry: We favor pairing front-end longs with shorts in low-strike receivers to take advantage of high vol and rich receiver skew while offsetting some of the negative carry.
Issuance, liquidity draining to pressure spreads: Accumulation of Treasury supply amid dwindling liquidity could add to pressure on swap spreads in 2024.
… The rate cut narrative continues to gather pace, leading to a fresh bond rally over the last 24 hours on both sides of the Atlantic. In the US, that was mostly driven by the latest JOLTS data, where fewer job openings suggested that the tightness in the labour market was continuing to ease. Clearly that could be very good news but the rapid normalising of labour market conditions will need to plateau at some point soon to ensure that the appearance of a potential soft landing is not just a path to a harder one …
… That momentum continued throughout the day, particularly after the JOLTS report in the US showed that job openings were down to 8.733m in October (9.3m expected). That’s the lowest they’ve been in the last two-and-a-half years, and it meant that the ratio of job openings per unemployed individuals was back down to just 1.34. That’s down from 1.8 six months ago and moving us closer to the pre-pandemic levels around 1.2. It represents good news from the Fed’s point of view since they’ve wanted to see labour demand and supply come back into balance for some time. As discussed at the top, we would expect to see a significant fall in job openings in a recession so the momentum would need to slow relatively soon to avoid that …
DB: Pricing more cuts will require a weaker labour market (in other words, Fed game currently being played … break it so we can then FIX it …? HATE this game)
We have been positioned for deeper rate cuts in 2024 and 2025 first in Europe and more recently in the US. The rationale for such trades was laid out in Five ways this time is different. As inflation peaked materially above target, it was likely that central banks would need to (1) tighten policy more than in recent history, (2) err on the side of delaying rate cuts from a risk management perspective and (3) subsequently ease policy more aggressively.
The weaker-than-expected inflation prints in the US and Eurozone have confirmed that the hiking cycle is over and opened the door to pricing a deeper easing cycle. We argued recently that the market was pricing a soft landing close to perfection, making the risk/reward for money market flatteners quite attractive. Now, the market is pricing a trough in policy rates (~3.4% in the US and ~2.2% in Europe) closer to (conservative) estimates of neutral. Thus, further significant inversion of the money market curve is likely to require evidence of weakness in the labour market that would justify central banks easing below neutral. While this remains our base case, the evidence is more likely to be observed in Q2 2024 than in Q4 2023.
DB: DBDaily - Big drop in US job openings (visual here looks much scarier than one below from WolfST which is moving avg)
… A big miss on US job openings, down 617k to 8733k in October, consensus looked for a 50k decline. The fall continues the trend decline since March last year and is now at the lowest level since March 2021. Quits rate is unchanged, but the gap between the number of job openings and unemployed people is dropping fast; now at 2.2mn (was 1.3mn pre-covid).
DB: China Macro - 2024 outlook: waiting for policy tailwind (since all the cool kids are having ratings agency updates (or DOWNdates as it is) to credit worthiness, interesting to keep on the economic / MACRO outlook)
China's trend growth has shifted downward in recent years. We believe that potential growth is now in the 4.5-5% range. This means that the economy, likely to grow 4.1% on average in 2022-23, is operating below potential. However, the economy lacks the endogenous momentum to rebound from a prolonged property sector downturn and a sharp drop in inflation.
Only the government can jump-start the economy through forceful and coordinated policy responses. The most important policy variable is its 2024 growth target, which we believe will be set at "above 4.5%".
A 1.5% - 2% of GDP expansion in fiscal spending, combined with further PBoC rate cuts, should be sufficient to lift GDP growth to 4.7% and inflation to 0.9% in 2024.
The property sector may finally stop being a drag on growth in 2024. Its share in GDP will likely stabilize, thanks to government-led urban redevelopment and social housing projects. Recovery in the private housing market could still take time.
The renminbi is expected to stabilize in H1 and strengthen in H2 against the USD, as trade flows remain favorable and capital outflow pressures will likely ease in the scenario of a mild US recession followed by Fed rate cuts.
Goldilocks: ISM Services Increases Above Expectations; Job Openings Decline More Than Expected
BOTTOM LINE: The ISM services index increased 0.9pt in November, above expectations for a slightly smaller increase. The composition of the report was strong, as the employment and business activity components both increased while the new orders component remained unchanged in expansionary territory. Job openings decreased by 617k in October—below expectations for a more modest decline—and the prior month was revised lower. The hiring rate decreased by one tenth to 3.7%, while the quits and layoff rates remained unchanged.
We expect core CPI at 0.29%M in November (vs 0.23%M Oct, 0.3%M cons, 4.0%Y). Core services accelerates on the back of higher hotel prices, while core goods deflation continues. Another negative energy print keeps headline low at just 0.01%M (3.0%Y, Headline CPI Index NSA: 306.765).
Job openings fall to 8.7 million in October, well below expectations
… Looking at other details, the hiring rate was little changed in both the total and private sectors, edging just a tenth lower to 3.7% overall. Both have settled a few tenths below pre-Covid levels are are down about a percentage point from the 2021 peaks, as the post-pandemic hiring frenzy has slowed. The separation rates were also little changed in October, and both are back down to approximately pre-pandemic levels. On a sectoral basis, the decline in openings was broad-based, but notable drops were recorded in health care, leisure & hospitality, and trade, transportation & utilities …
UBS: November CPI preview: Gas down but core up (so, see whatever we wanna see?)
Headline CPI: UBS US Econ 0.12%, UBS Nowcast -0.08%, consensus 0.07% Next Tuesday's CPI release is projected to show the headline CPI rose 12bp (seasonallyadjusted) in November and 12-month inflation remained at 3.2% (a little above the recent low of 3.0% in June). A solid 6½% decline in prices for gasoline and related energy goods is the primary driver of the relatively weak headline CPI increase in November. In contrast to the modest headline increase, we expect a strong increases for both the core CPI, at 37bp, and food prices, at 41bp. Our projection is a little above the current Bloomberg consensus average estimate and well above the projection from our Nowcasting models.
Large uncertainty this month We have been surprised notably in the past couple of months — to the upside in September and to the downside in October with lodging away from home being a particularly large portion of these surprises. This month we see two-sided risks to our projection from the core non-rent services prices that were unusually weak last month. Last month's slowing in these components could be a sign of easing inflation pressure or last month's unexpected weakness could be reversed with greater-than-usual rebound increases this month. As a result we think there is large uncertainty in next week's core CPI release and would not be surprised to see the core CPI increase anywhere from 23bp to 48bp
Moderately weaker core CPIs in coming months
November CPI will probably not change the FOMC trajectory
… US revised 3Q unit labor cost and productivity data will be wrong; the data is derived from GDP numbers that will be revised. But the idea of very weak unit labor costs is plausible. It is unit labor costs, not wages (and absolutely not average hourly earnings) that best reflect labor cost inflation pressures. The trends in unit labor costs make clear labor markets were never really “tight”, and that profits rather than labor were behind the latest inflation episode …
Wells Fargo: JOLTS: Labor Market Coming into Balance
Summary The October JOLTS report is supportive of the view that labor supply and demand have come into better balance. Job openings fell to 8.73 million at the end of the month, the lowest reading since March 2021. The ratio of openings to unemployed persons is 1.34, only a bit above the 1.2 ratio that prevailed before the pandemic. The quit rate is also in line with its pre-pandemic level in a sign that workers are no longer quitting their jobs at the same pace they were when the labor market was at its hottest. On balance, today's labor market data are consistent with a cooling labor market and decelerating wages, which bodes well for future progress in the Federal Reserve's fight to bring inflation back to its 2% target.
The S&P 500 is taking a rest just north of 4550 and south of 4600. Stock investors are waiting for November's jobs report on Friday to decide what to do next. Meanwhile, bond investors aren't waiting to buy more bonds. They liked the latest batch of economic indicators and drove the 10-year Treasury bond yield below 4.25%. Here is a brief overview of the latest bond-friendly indicators:
(1) Citigroup Economic Surprise Index. Several of the latest economic indicators were weaker than expected. That's reflected in the recent drop in the Citigroup Economic Surprise Index (chart). The 13-week change in the bond yield is highly correlated with the CESI.
(2) Job openings. There were 8.7 million available jobs in October, according to today's JOLTS report. That's 1.3 jobs available for every unemployed person (chart). It’s the lowest number of job openings since March 2021. It confirms that the labor market is cooling and suggests that wage inflation will continue to do the same…
… And from Global Wall Street inbox TO the WWW,
Bloomberg: 5 things to start your day (EZ where they spell out how IF you are a rate cut ‘ista you are ALSO going to become increasingly BEARISH STOCKS … or should do, at least)
… The prospect of rate cuts risks turning from boon to bane for stocks, if markets increasingly price more and faster reductions into next year.
The past two times the Federal Reserve pivoted from holding rates to actually cutting coincided with monthly losses for the S&P 500.
The benchmark slid more than 12% in March 2020, when the Fed slashed rates by 50 bps as Covid became a pandemic. A move of similar magnitude at the beginning of October 2008 — followed by another half-point cut by the end of the month — aligned with 17% slump in the index.
Both instances also marked the beginning of a contraction for the US economy. By the time the Fed had reached the conclusion it needed to cut rates quickly, growth — and investor sentiment, by extension — was already hurting badly enough that policy makers had to undo all of the tightening they delivered in that cycle. In other words, a hard landing.
This time, the nearly 130 bps of reductions that rates traders see over the next year would reverse only a quarter of Fed tightening since March 2022. They’re also a far cry from the 500-basis-point pivot in 2007 to 2008, as well as the 225-bp turn from 2019 to 2020. In fact, they’ve been deemed just right for a soft landing by equity investors, leading to the S&P 500’s best monthly performance in more than a year.
That said, further and faster rate cuts than currently priced would imply the economy has hit a dire enough state for policymakers to quickly change their tune. In that scenario, lower rates would go from signaling a still-supportive environment for stocks to acting as a symptom of much deeper economic malaise.
Bloomberg: Companies are going broke gradually, not suddenly (Auther's OpED with visual of markets JOLTd by JOLTS)
… While yes, policymakers would like to see the labor market cool, they’d prefer to see that happen through lower demand for workers rather than employers slashing jobs. So far, as colleagues wrote, that’s largely been working. Vacancies have retreated from last year’s peak of 12 million while unemployment (and layoffs) stayed historically low.The so-called quits rate, which measures voluntary job-leavers as a share of total employment, held for a fourth month at the lowest level since early 2021. All of this is wholly in line with the “best-case” scenarios now widely canvassed of an “immaculate disinflation” or “soft landing” — which broadly mean that inflation and rates come down without a recession to push them. Yields across the board dropped Tuesday, with the 10-year yield dropping below 4.2% for the first time since August:
Bloomberg: Treasuries Face Acid Test As Traders Look Past Powell's Pushback
By Ven Ram, Bloomberg Markets Live reporter and strategist
Front-end Treasuries have rallied big in the past month, but labor market data will pose a key test for traders this week.
Yes, Federal Reserve Chair Jerome Powell did reiterate on Friday that the central bank is prepared to tighten policy further, but was just jawboning against the recent loosening of financial conditions rather than a statement of real intent given the clear disinflationary momentum we have seen of late.
The two-year Treasury yield, which was hovering around 5% before softer-than-inflation readings for October, has since shed some 40 basis points. While the decline has made the maturity look rather rich on the curve, some optimism is justified by comments from Governor Christopher Waller who became the first Fed official to explicitly open the door to rate cuts.
As I see it, the two-year maturity has a subjective 60% probability of entrenching its richness, even if the security may only consolidate its gains between now and the year-end. A crucial first test will come as soon as this week, with ADP employment numbers due on Wednesday and non-farm payrolls data for November on Friday. Curiously, the median forecasts on both expect an improvement from prior numbers, but yet another print that shows employers expanded their payrolls for an umpteenth successive time in this cycle isn’t likely to tell the Fed anything that it doesn’t already know about the resilience of the labor market.
Instead, look at the jobless rate, where the number is forecast to stay unchanged at 3.9%. A reading lower than that will puncture the current rally in rates, for that would pretty much rule out any enthusiasm for the sooner-rather-than-later rate cuts that traders have firmly positioned themselves for. The Fed reckons that a print higher than 4% will be required to bring the labor market back into balance. An acceleration in hourly earnings will also sully the bullish mood in the Treasury markets.
Bloomberg: Race To Price Fed Rate-Cuts Is Making A Hike More Likely (like dueling pianos of Elton John and Billy Joel)
Authored by Simon White, Bloomberg macro strategist,
Expectations of rate cuts in the US are liable to come unstuck as easing financial conditions raise the risk the Federal Reserve returns to the fold with another hike...
Be careful what you wish for…
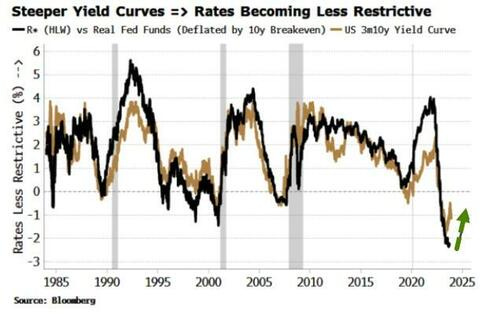
… Also, the Fed’s policy rate is becoming less restrictive. The neutral rate, r*, is unobservable and estimates are released with a lag. But we can get a real-time indication of how restrictive the Fed’s rate is by looking at the yield curve. As the chart below shows, the difference between real fed funds and r* (i.e. the degree of restrictiveness in the rate) is analogous to the 3m versus 10y curve.
The steepening of the yield curve is telling us that even though the Fed has not yet cut the policy rate, it is nonetheless becoming less restrictive…
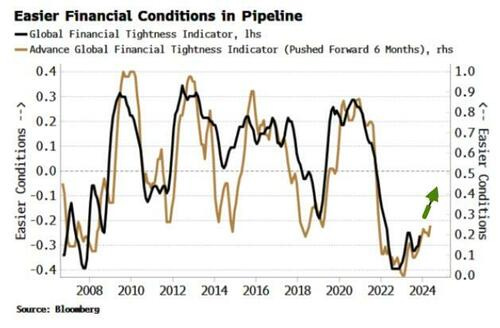
… The Advanced Global Financial Tightness Index (the AGFTI; brown line in the chart below) uses central-bank rate expectations to lead the GFTI by about six months. As we can see, less hawkish central banks are boosting the AGFTI, pointing to the GFTI (black line in chart) continuing to rise also; i.e. financial conditions should keep easing.
Moreover, as discussed in last Tuesday’s column, excess liquidity also continues to rise, which is very supportive for risk assets over the medium term…
… The likelihood is rising the Fed – haunted by the ghost of Arthur Burns – will feel compelled to push against the market and raise rates again.
Bloomberg: Fed Rate-Cut Pricing Will Soon Need A Recession To Be Justified
Authored by Simon White, Bloomberg macro strategist,
The depth of expected rate cuts from the Federal Reserve is close to being consistent with a recession.
If a contraction is on the cards (unlikely in the near term), stocks and credit are mispriced. Otherwise short-term rates now look too low for a soft-landing scenario.
Markets love pushing things to their limits. Soft-landing expectations combined with Fed speak that for the first time countenanced rate cuts drove an increase in Fed rate-cut expectations for next year.
But we are at the point where it would be almost unprecedented for the expected amount of cuts to be delivered unless a recession is imminent.
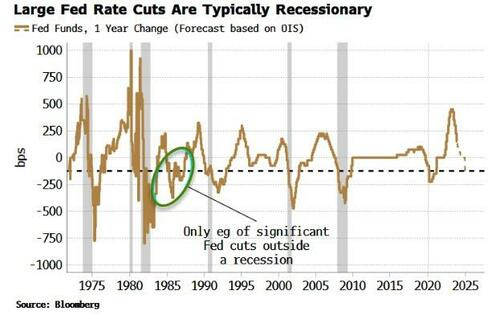
The chart below shows the annual change in the fed funds rate in basis points. The black dashed line shows the current ~125 bps of cuts expected over the next year (based on OIS).
As the chart shows, there has only been one occasion, in the mid 1980s, when the Fed has cut rates by more than this amount at a non-recessionary time (i.e. not immediately before, during or after a recession).
I don’t view an NBER recession as imminent, and the downturn is likely delayed until mid next year at the earliest. But if the rates market is correct, and a recession is on its way, then stocks and credit markets have not got the message, with the S&P only ~5% off its all-time high, and credit spreads having been on a tightening track for most of this year.
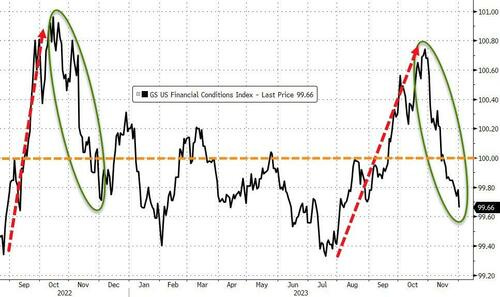
Not only do the amount of rate cuts look overdone, they may not happen at all as the Fed may respond to loosening financial conditions with another hike.
Goldman Sachs’ Financial Conditions Index has been designed to translate in to an equivalent move in the Fed’s policy rate (h/t Jim Bianco of Bianco Research).
The index infers that the loosening in financial conditions is equivalent to up to 90 bps of Fed cuts over the last month.
While the world waits anxiously to see if the jobs report this Friday shows that too many people are working—because the Fed (erroneously) believes that might be inflationary and thus a reason to raise interest rates still further—I offer six charts that look at the U.S. economy from a big picture perspective. I don't find anything sinister or strange in these charts. Instead, I see an economy that is growing moderately (perhaps only modestly). I see a healthy labor market, an equity market that is rising at a normal pace, bond yields that have most likely risen by enough to cool inflation, credit spreads that are unremarkable (which is good), and a dollar that has been fortified by Fed tightening.
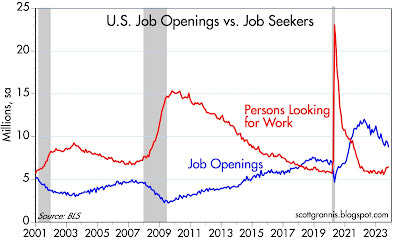
Chart #1
Chart #1 compares the number of job openings to the number of people looking for jobs. Rarely have openings exceeded the number of job seekers by as much as they have in recent years. What's wrong with that?
… Chart #4
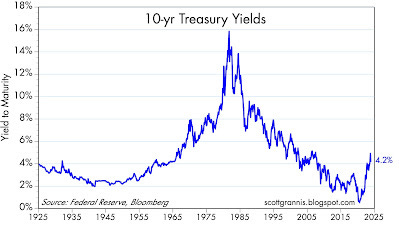
Chart #5
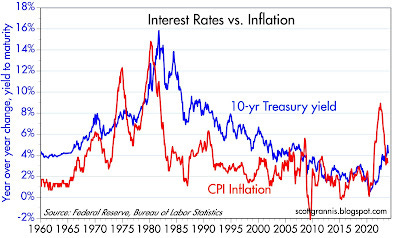
Chart #4 shows the yield on 10-yr Treasuries going all the way back to 1925. It's been a wild ride, to be sure, especially for the past few years, as yields rose by more and faster than at any time in history. Yields hit a low of about 0.5% in the midst of the Covid shutdowns in 2020, and have since risen to a high of 5%; today they closed at just over 4%.
Chart #5 compares these same yields to year over year consumer price inflation from 1960 through today. If—as seems likely—the Fed succeeds in bringing inflation down to 2% or so and holding it there, there's no reason 10-yr yields can't trade in a range of 3.5% - 4%. We're pretty close to that already.
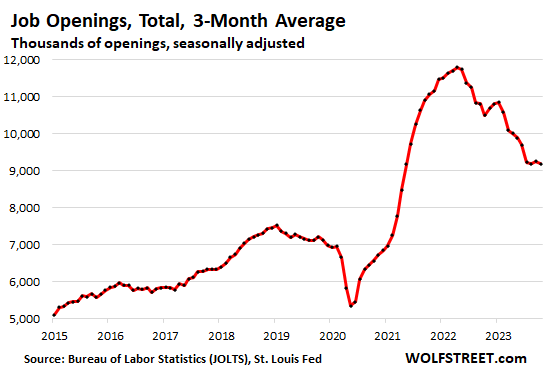
WolfST: Job Market Retightened in Some Industries, Loosened in Others: Layoffs & Discharges, Voluntary Quits, Job Openings, and Hires
… Job openings – as reported by companies, not online job postings – fell in October, more than undoing the big surge in August, but were still 19% higher than in October 2019.
The three-month moving average (3MMA), after the high readings in August and September was flat for the fourth month in a row, and was up by 27% from the three-month average over the same period in 2019.
So that’s the trend: job openings, like quits, stabilized at these lower, but still very high levels:
My Food 'flation keeps going up, at least at Wendy's. The $6 Biggie Bag went up to $7; I remember when the 2 sizes were $4-$5 only a yr or 2 ago....
Speaking of Wendy's, I'm at times a sucker for advertising. They've got the Pretzel Bun Baconator back for a limited time, a whooping $11.60 pre tax. I INTENDED to buy 1, till I saw that price. I then went to In & Out, where I can get a double cheeseburger w/fries and a shake subbed for the soda, for $10.94 w/tax. Of course this same meal was $6.78, 14 yrs ago when I first moved here (Folsom, CA). That's a 4.43% annual rate of Price Inflation upon my In & Out meal since. IF I did the math right LOL! Honestly, not as high as I thought, but certainly higher than so called CPI or Trueflation. I know my WAGES haven't been increasing at a 4.43% rate per yr, so it's actually quite startling to see how drastically my Purchasing Power's declined vs Beef Burgers!
....I'm really nerding out here now. The Steak & Eggs breakfast special at Mel's dinner WAS $5.99 in 2010, now it's $9.99; that's 4.28% annual price inflation of said breakfast special.
As cool as the Elton John vs Billy Joel Piano Duel sounds, I'd much rather witness Beethoven vs Chopin!